
SISTRIX Toolbox dashboards can save you time, improve your workflow, and reduce the possibility that you miss an important event. They’re dynamic, include easy-to-interpret charts, are always up-to-date and are not restricted to one domain. You can also monitor competitors or sector activity.
In this tutorial we show you some useful example dashboard configurations. We’ll also show you how to add performance indicators from across the Toolbox which will help create a consistent workflow.
- What does a SISTRIX dashboard look like?
- Monitor important index values for a single domain
- Which values should I add to a domain-focused dashboard?
- Example dashboard setup - Single Domain
- Creating a new dashboard
- Add the main domain VI
- Add ranking sub-domains / hosts
- Add ranking directories
- Editing a dashboard
- Monitor competitors in a dashboard
- Monitor multiple domains
- Minimalist Dashboard
- Other dashboard ideas
- Summary
What does a SISTRIX dashboard look like?
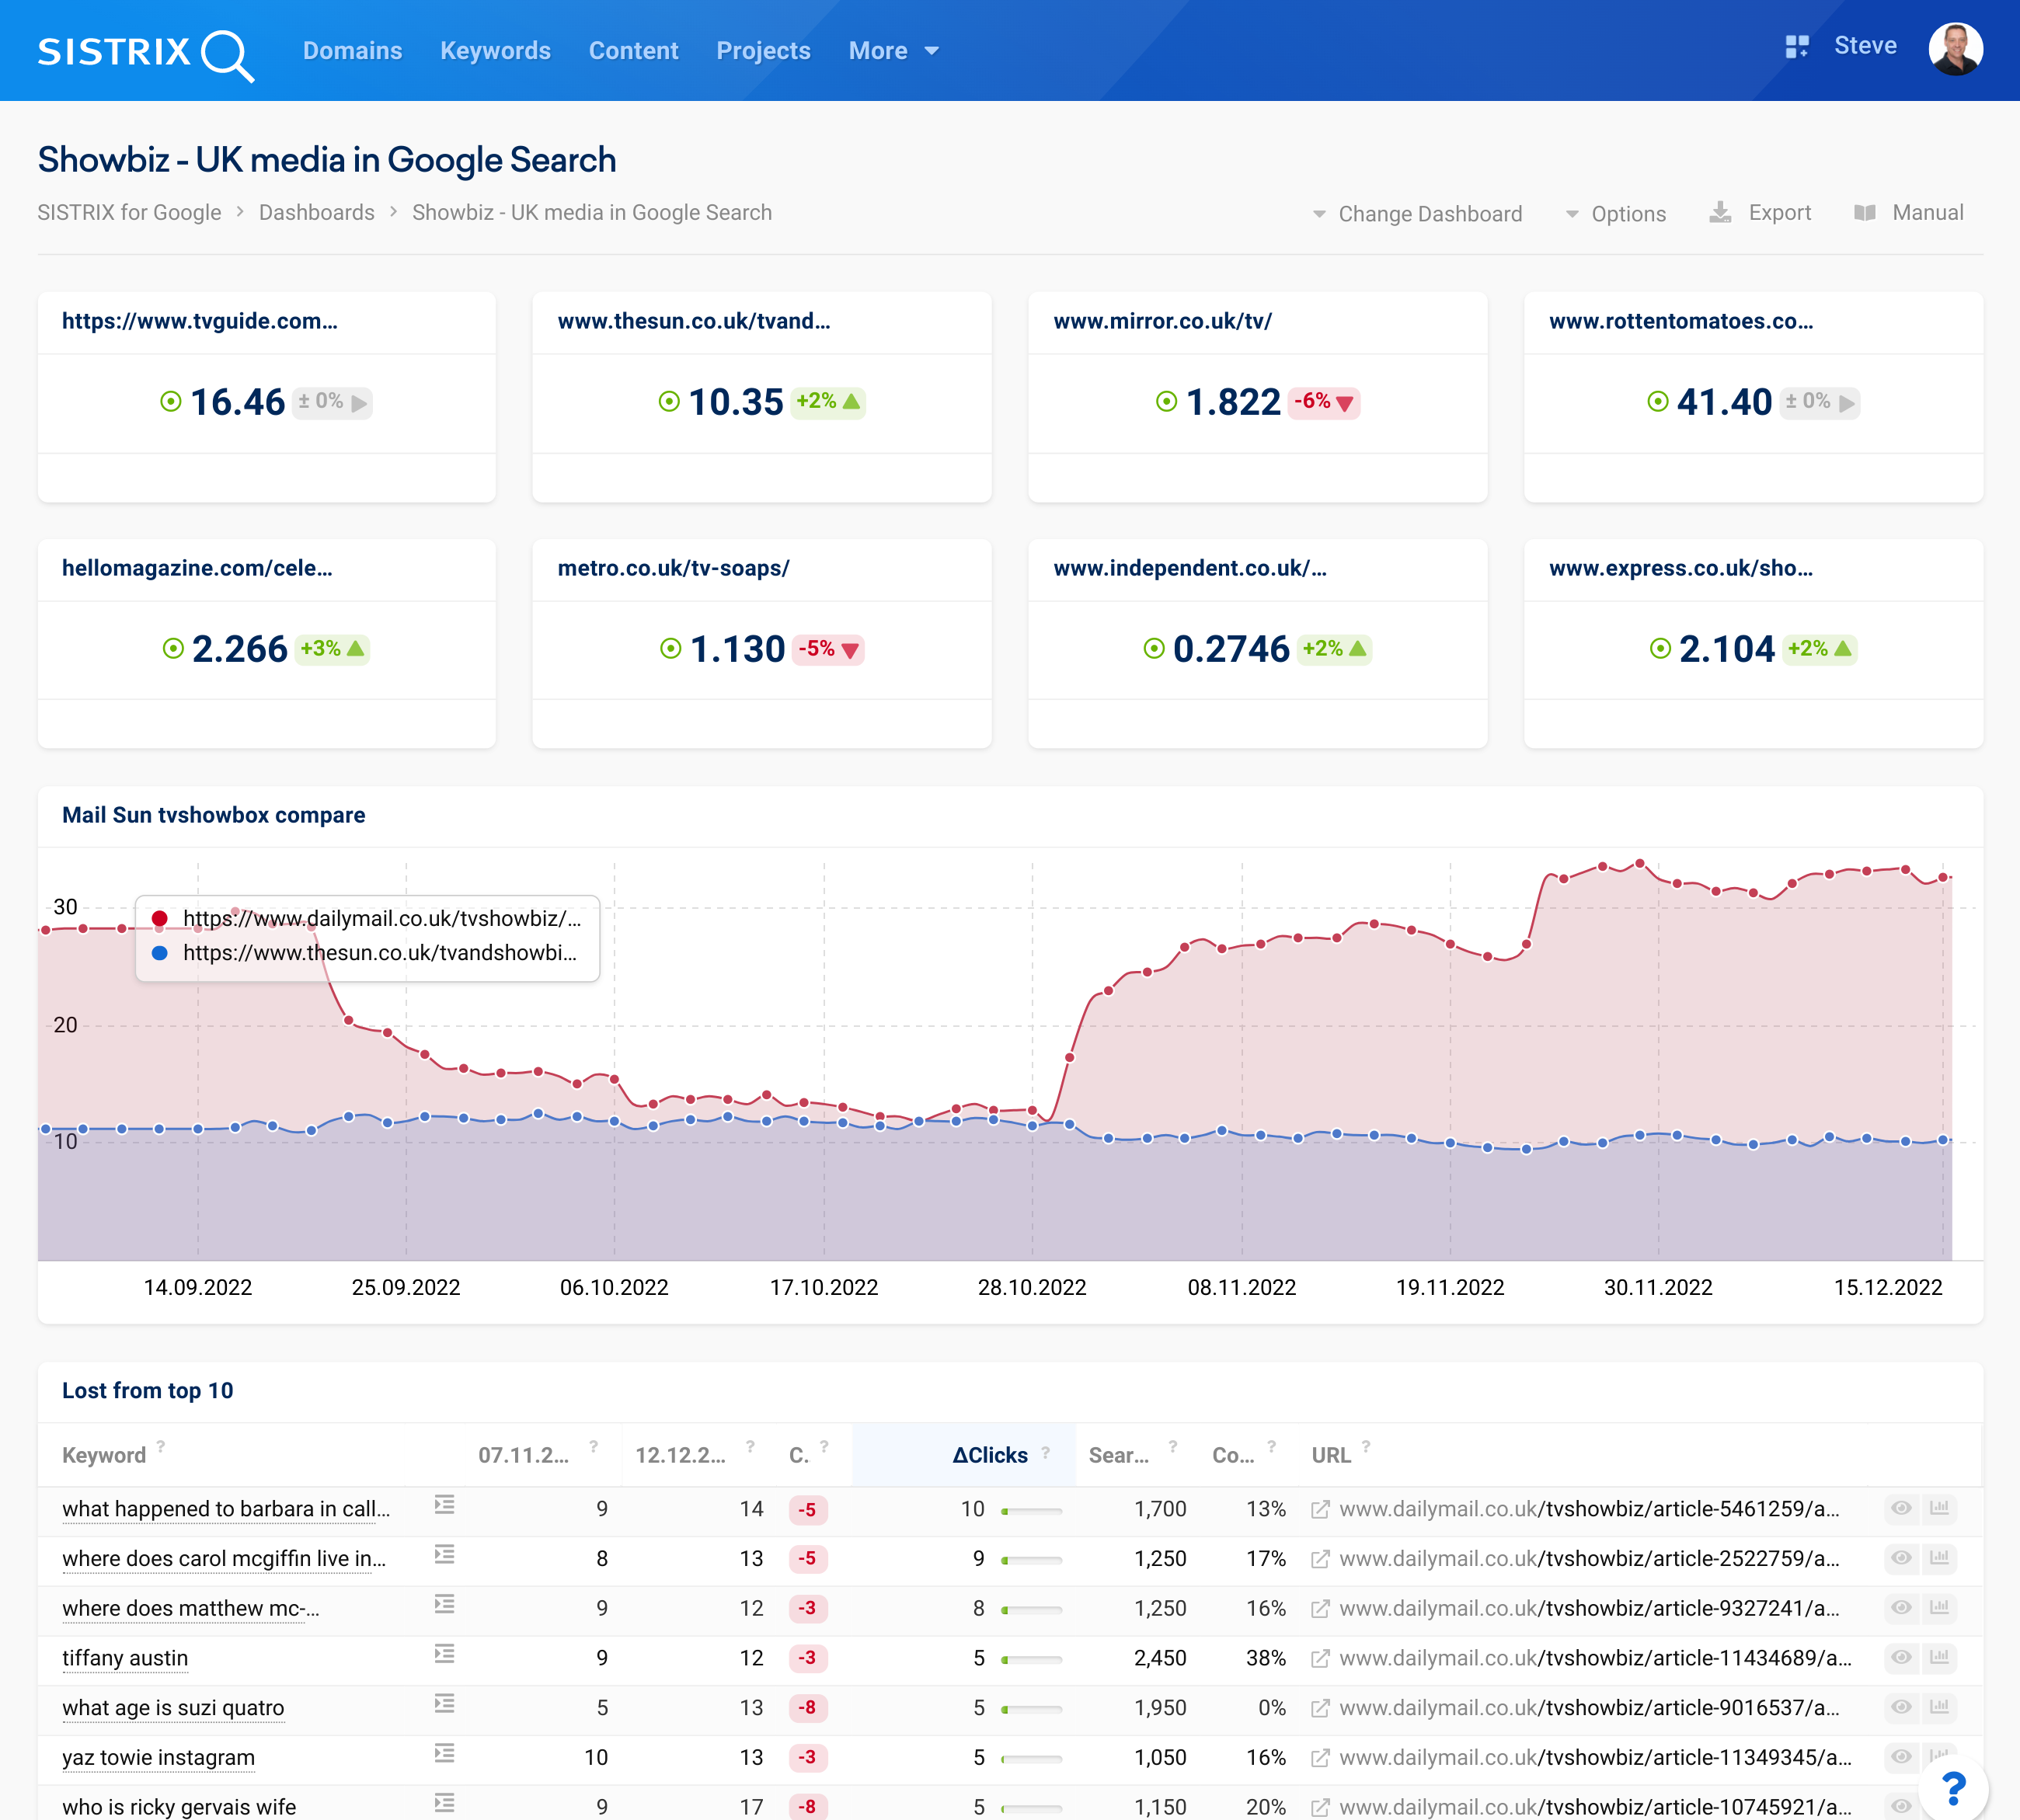
Most elements from the Toolbox can be added to dashboards including elements across different Toolbox modules. A example dashboard in desktop view is shown above. Dashboards are also view-able on mobile screens.
Monitor important index values for a single domain
By monitoring a single domain you’ll quickly be able to see changes, which will help you to make a speedy, informed analysis of the change. By monitoring your customer or competitor, single domain monitoring can also alert you to threats and opportunities.
If you wish to monitor multiple domains in one dashboard, jump to the guide and examples below.
Which values should I add to a domain-focused dashboard?
- The domain Visibility Index chart – The starting point for all domain monitoring and analyses.
- The Visibility Index graph for important directories – Important assets (or competitor threats) must be monitored.
- The Visibility for hostnames – Some sites will serve content on multiple hostnames / subbdomains.
- Top URLS. Especially important when undergoing site changes.
- New and Lost keywords for the last week.
You can add elements from other modules that you have enabled. For example:
- Social Signals : allows you to keep track of popular shared content, from any domain
- New Links: See where your content, and that of competitors, is being linked from.
- Optimizer project elements.
Example dashboard setup – Single Domain
In the following examples, we use the domain bmj.com
Creating a new dashboard
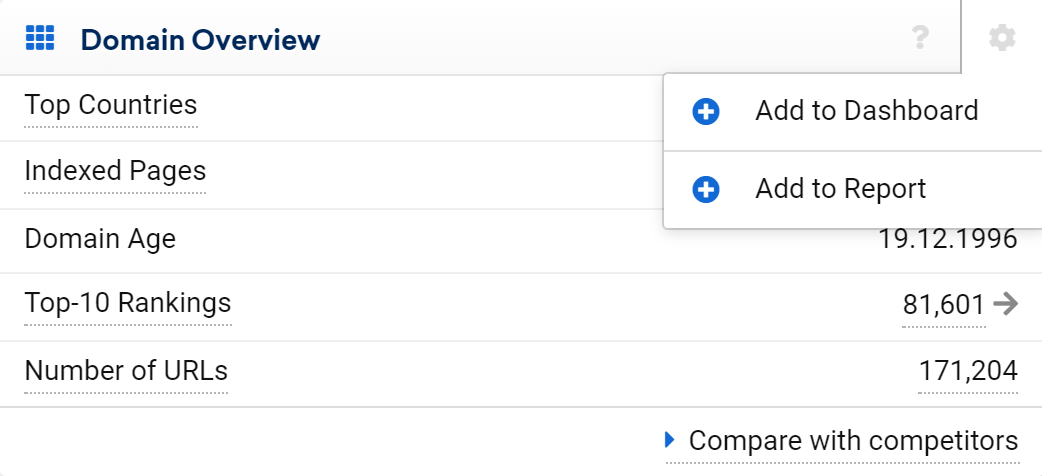
Dashboards are created by adding an element to a new dashboard. For example, by adding the Visibility Index graph. Use the cogwheel on the top-right of sections in the Toolbox to add them to a dashboard and select Create New Dashboard
After adding the dashboard you’ll see a pop-up. Go “to Dashboard” to give it a name.
Point 1 shows where to add the dashboard name.
Add the main domain VI
First, add the Visibility Index chart for the entire domain to a new dashboard. The VI for the domain includes all host names and directories and is the best starting point for monitoring.
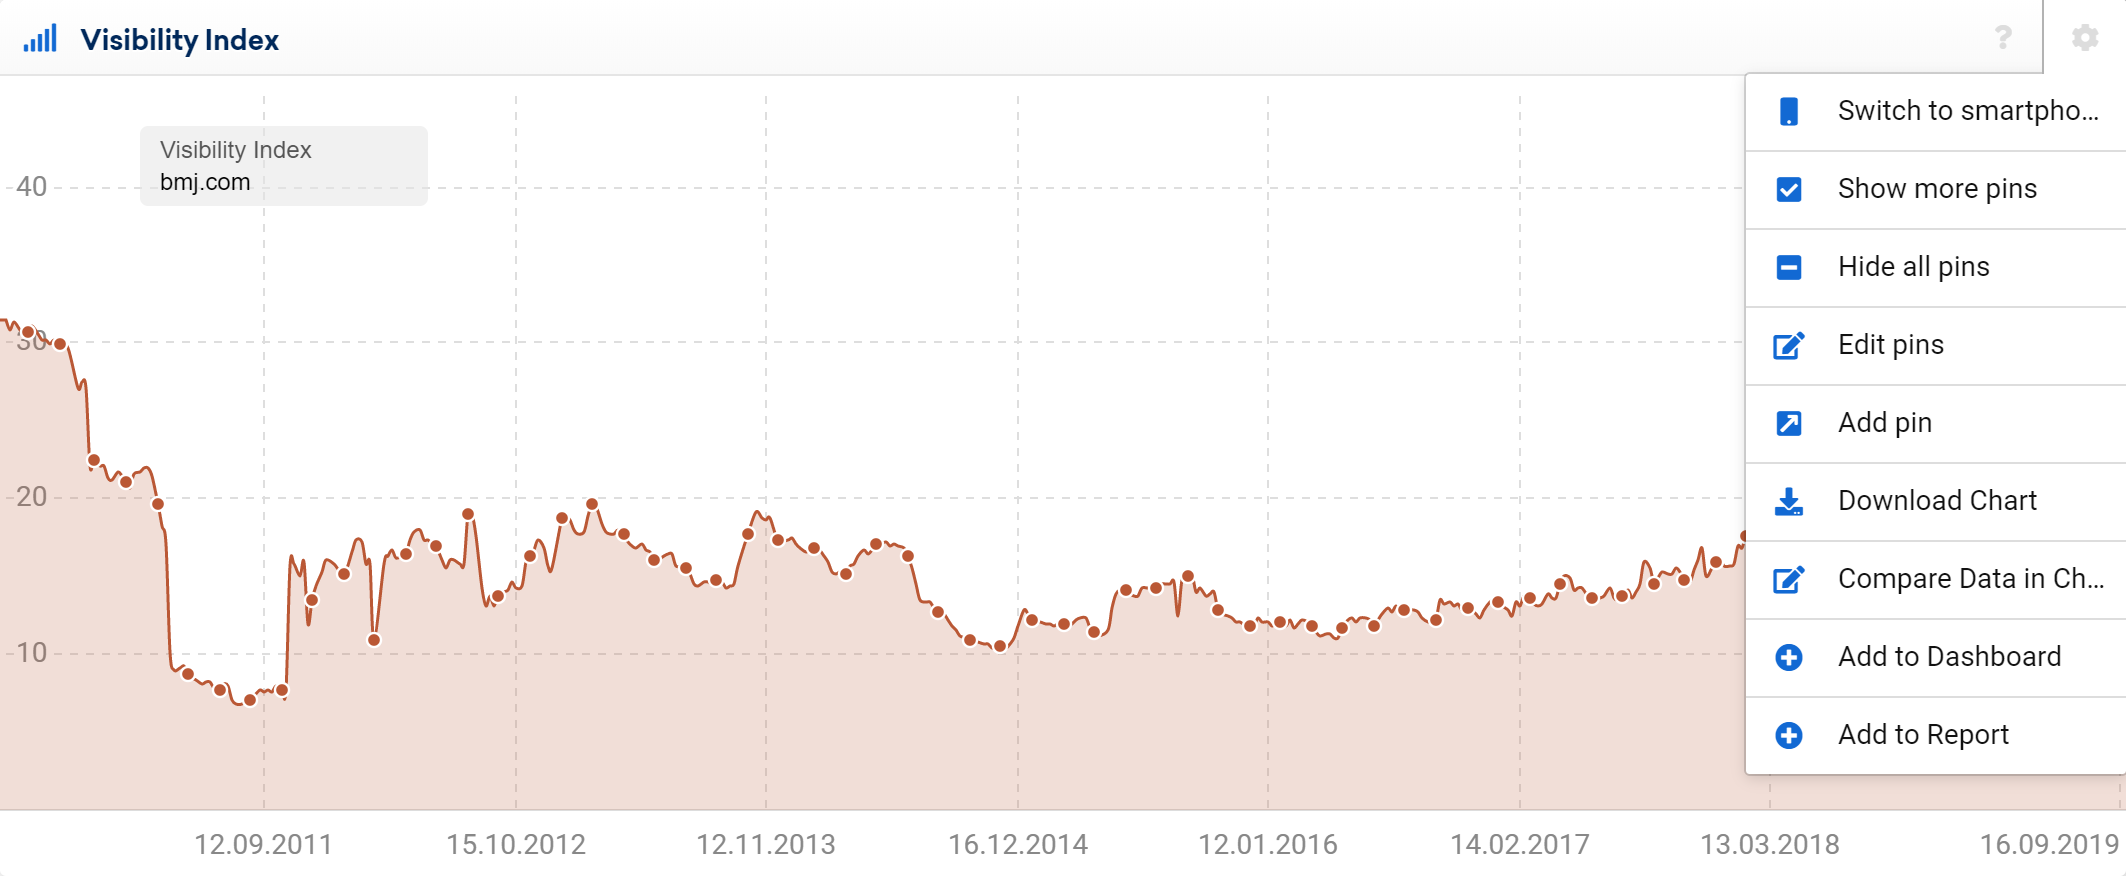
Add the chart using the cogwheel menu item 2 Add to Dashboard.
Add ranking sub-domains / hosts
As the second element in your dashboard, you should monitor the sub-domains / hosts. You can easily view this graphically in the SEO-Module by going to “Hostnames” where you will find the most visible hosts in graphical and list form.
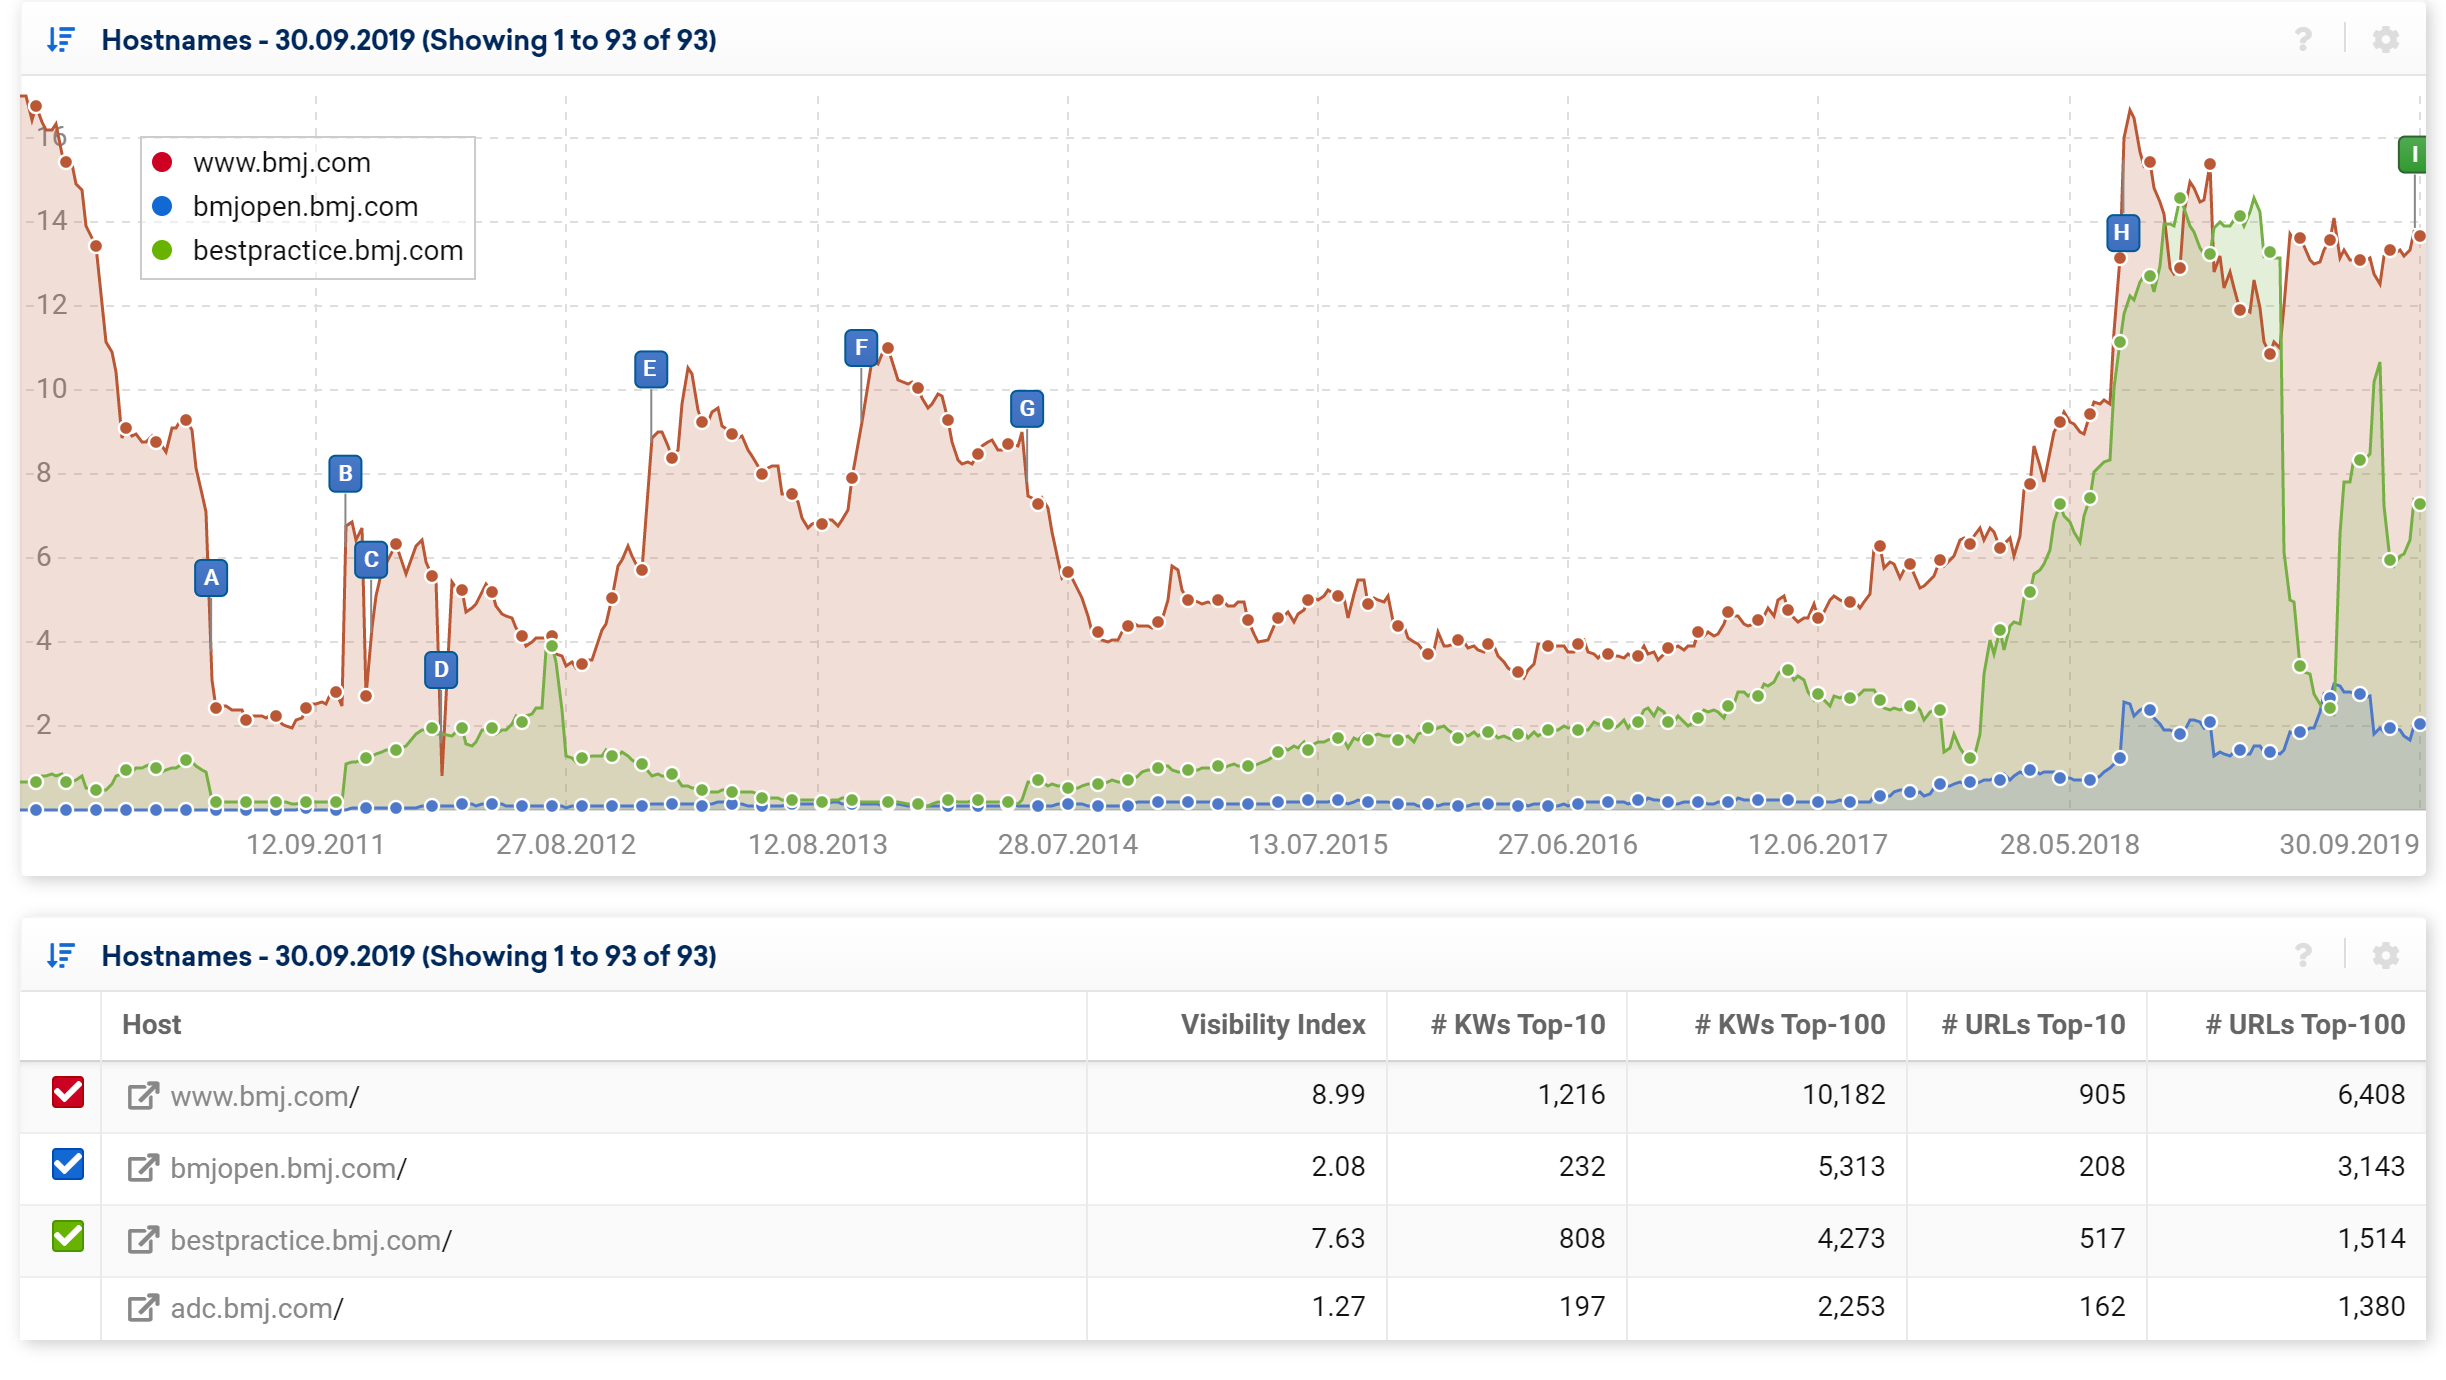
For this tutorial let’s take the top 4 hosts. If you have hosts that are critical, you should also consider adding them.
- www.bmj.com
- bmjopen.bmj.com
- bestpractice.bmj.com
- adc.bmj.com
Add ranking directories
Our next step is adding important directories under the domain. Type the domain name into the searchbar and go to “Directories” in the left-hand navigation of the SEO-Module in this case: https://uk.sistrix.com/bmj.com/seo/directories/mobile/true
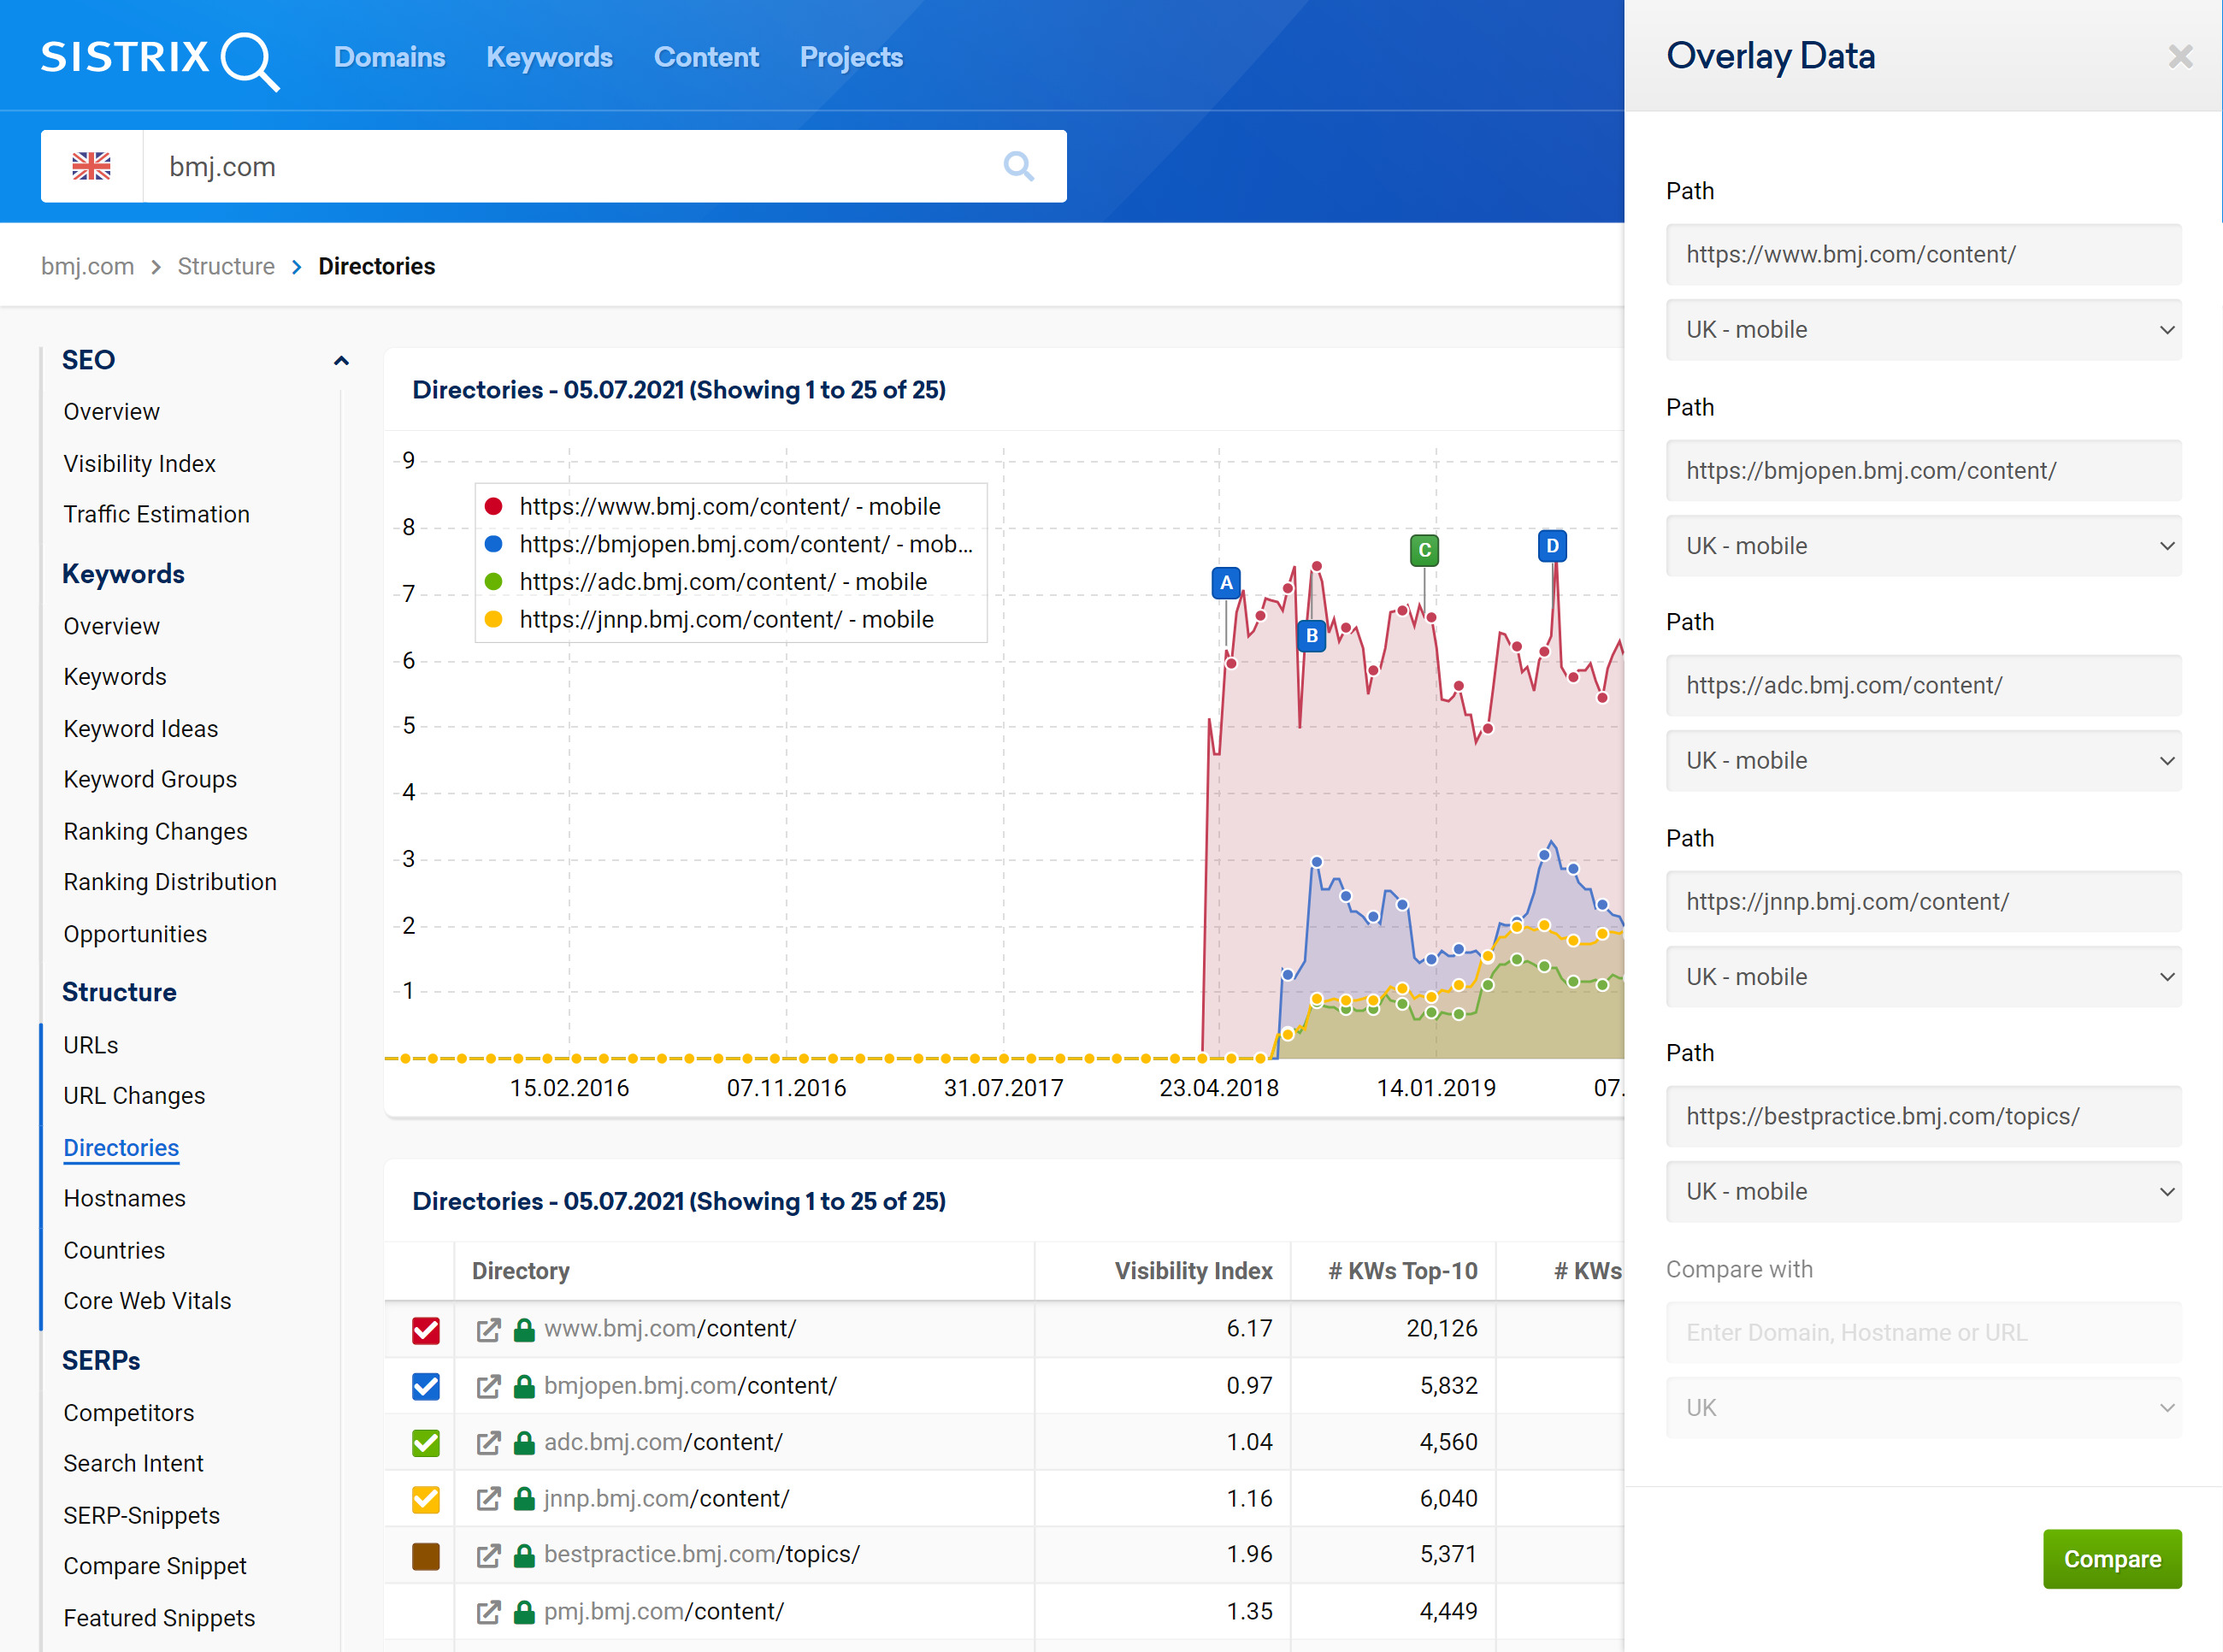
The default chart shows the current top-4 ranking directories (by number of Top 100 ranking keywords.) If you wish to change the view, you can choose up to 6 directories to be shown in the graph by using the cogwheel-menu option Overlay Data.
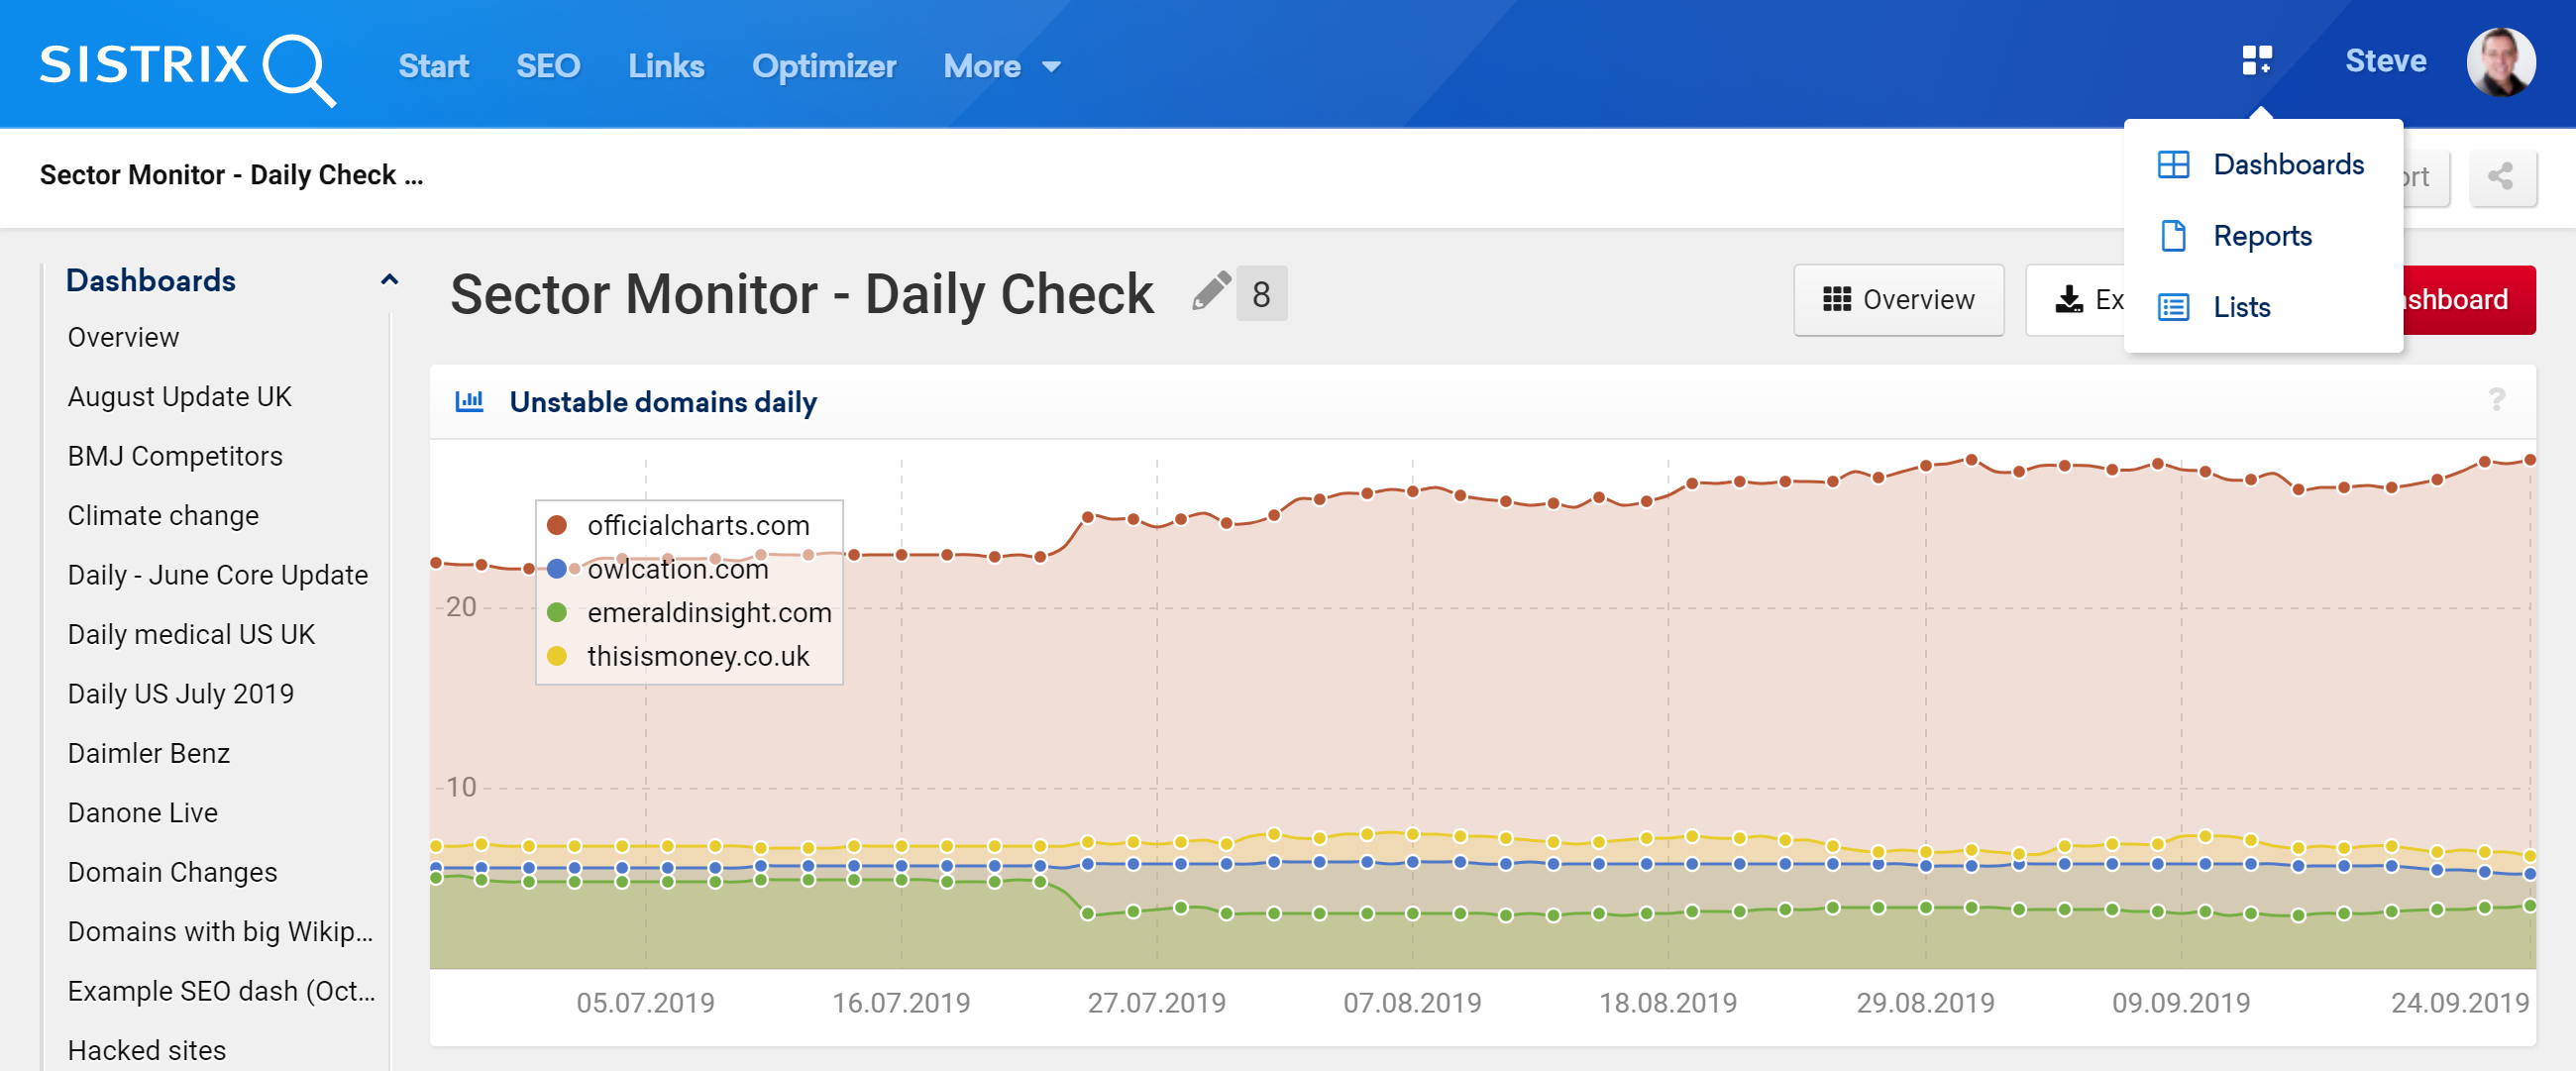
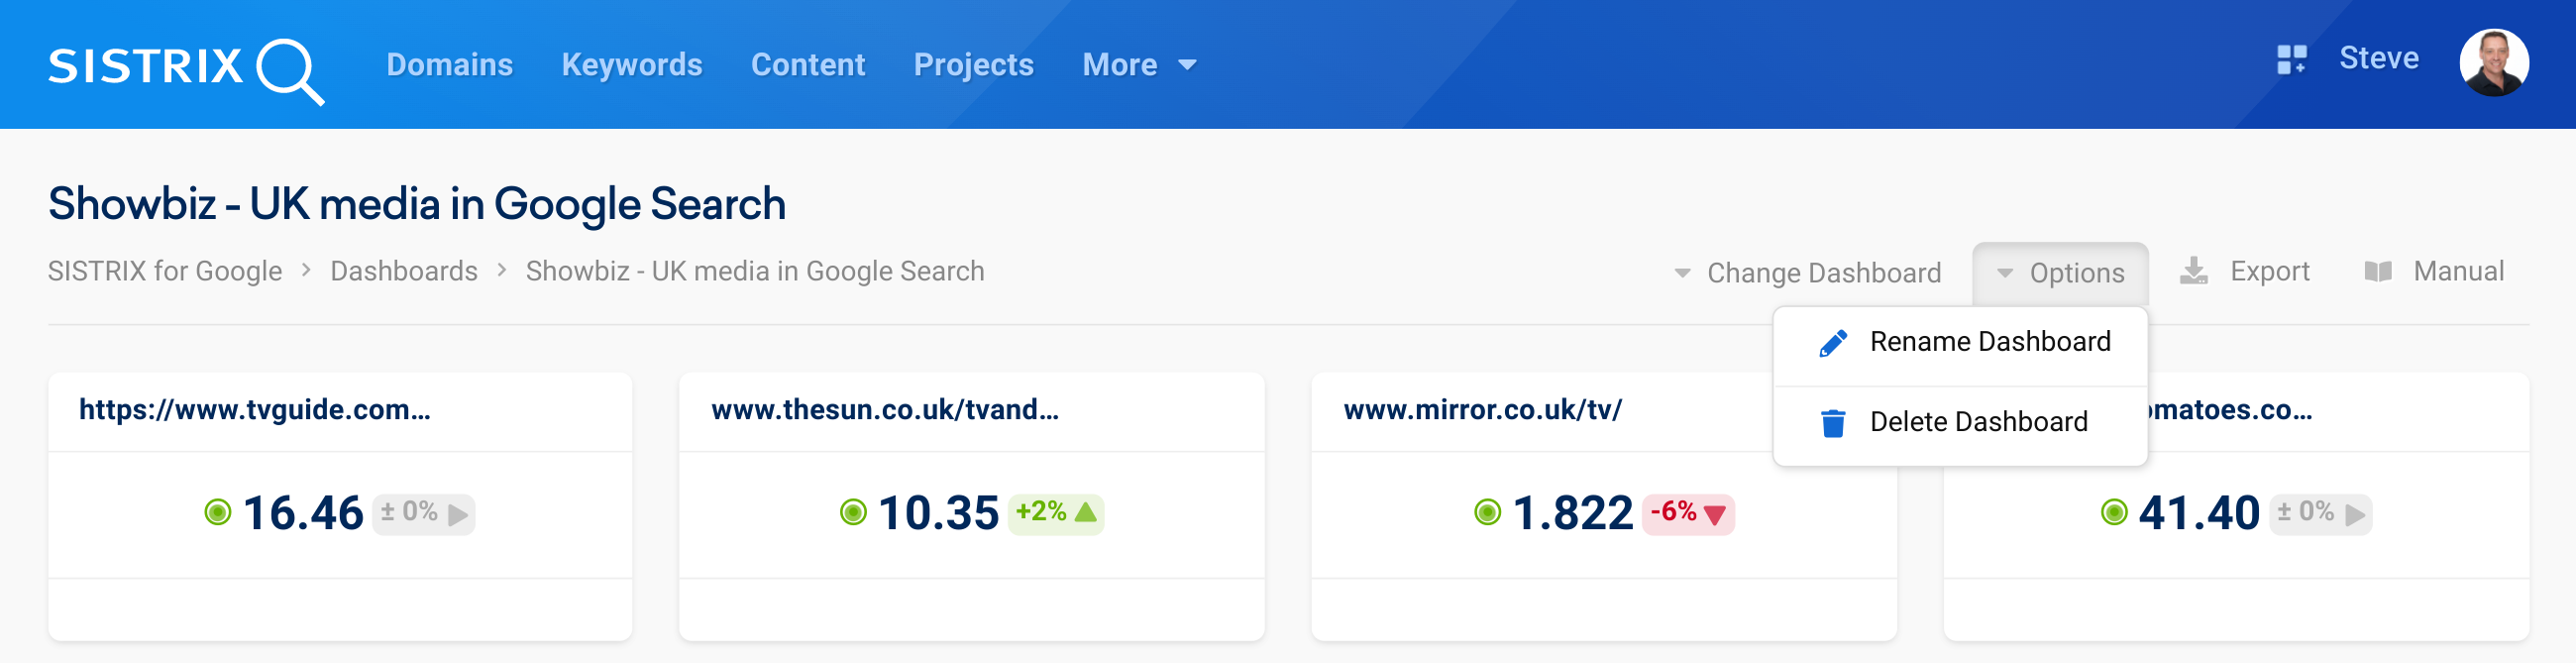
Remember, dashboards are always available via the menu system on the top-right of the dashboard 3 (desktop view.)
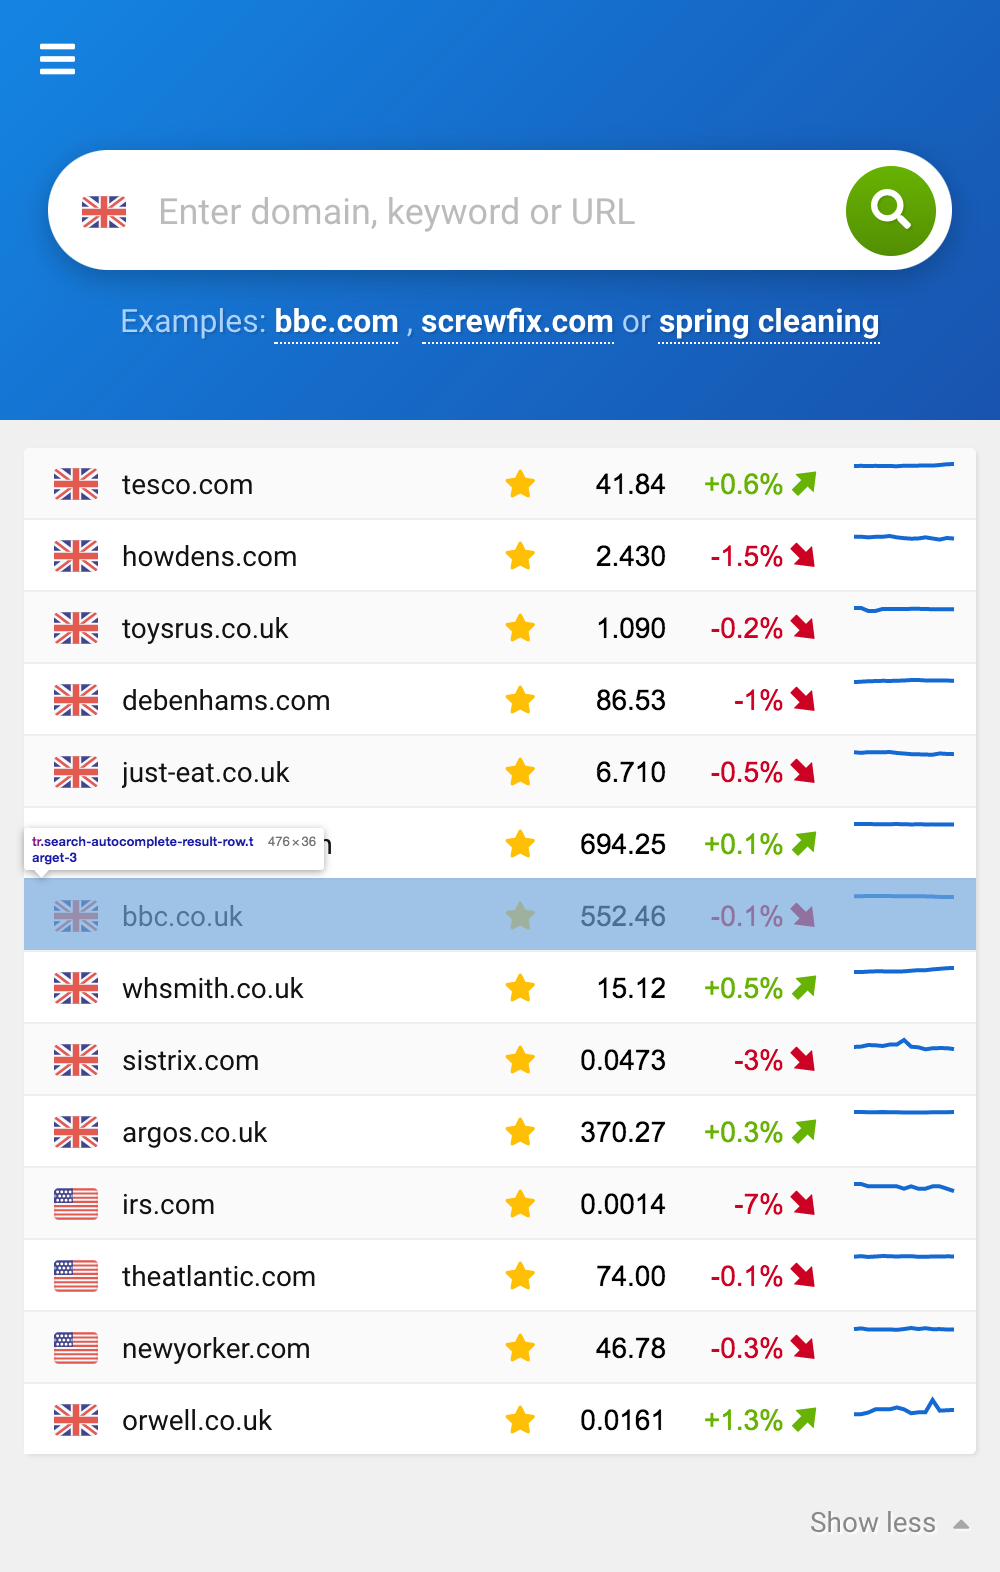
In the mobile view, dashboards are accessible through the burger menu. 4
Editing a dashboard
Through the dashboards overview link, you can access dashboard and edit them. Sections can be dragged and dropped within a dashboard, and deleted.
Monitor competitors in a dashboard
Before monitoring competitors in a dashboard you need to know what the competitor domains are. In some cases, they may not be obvious so the SISTRIX Toolbox includes a competitors list which will shows the real competitors.
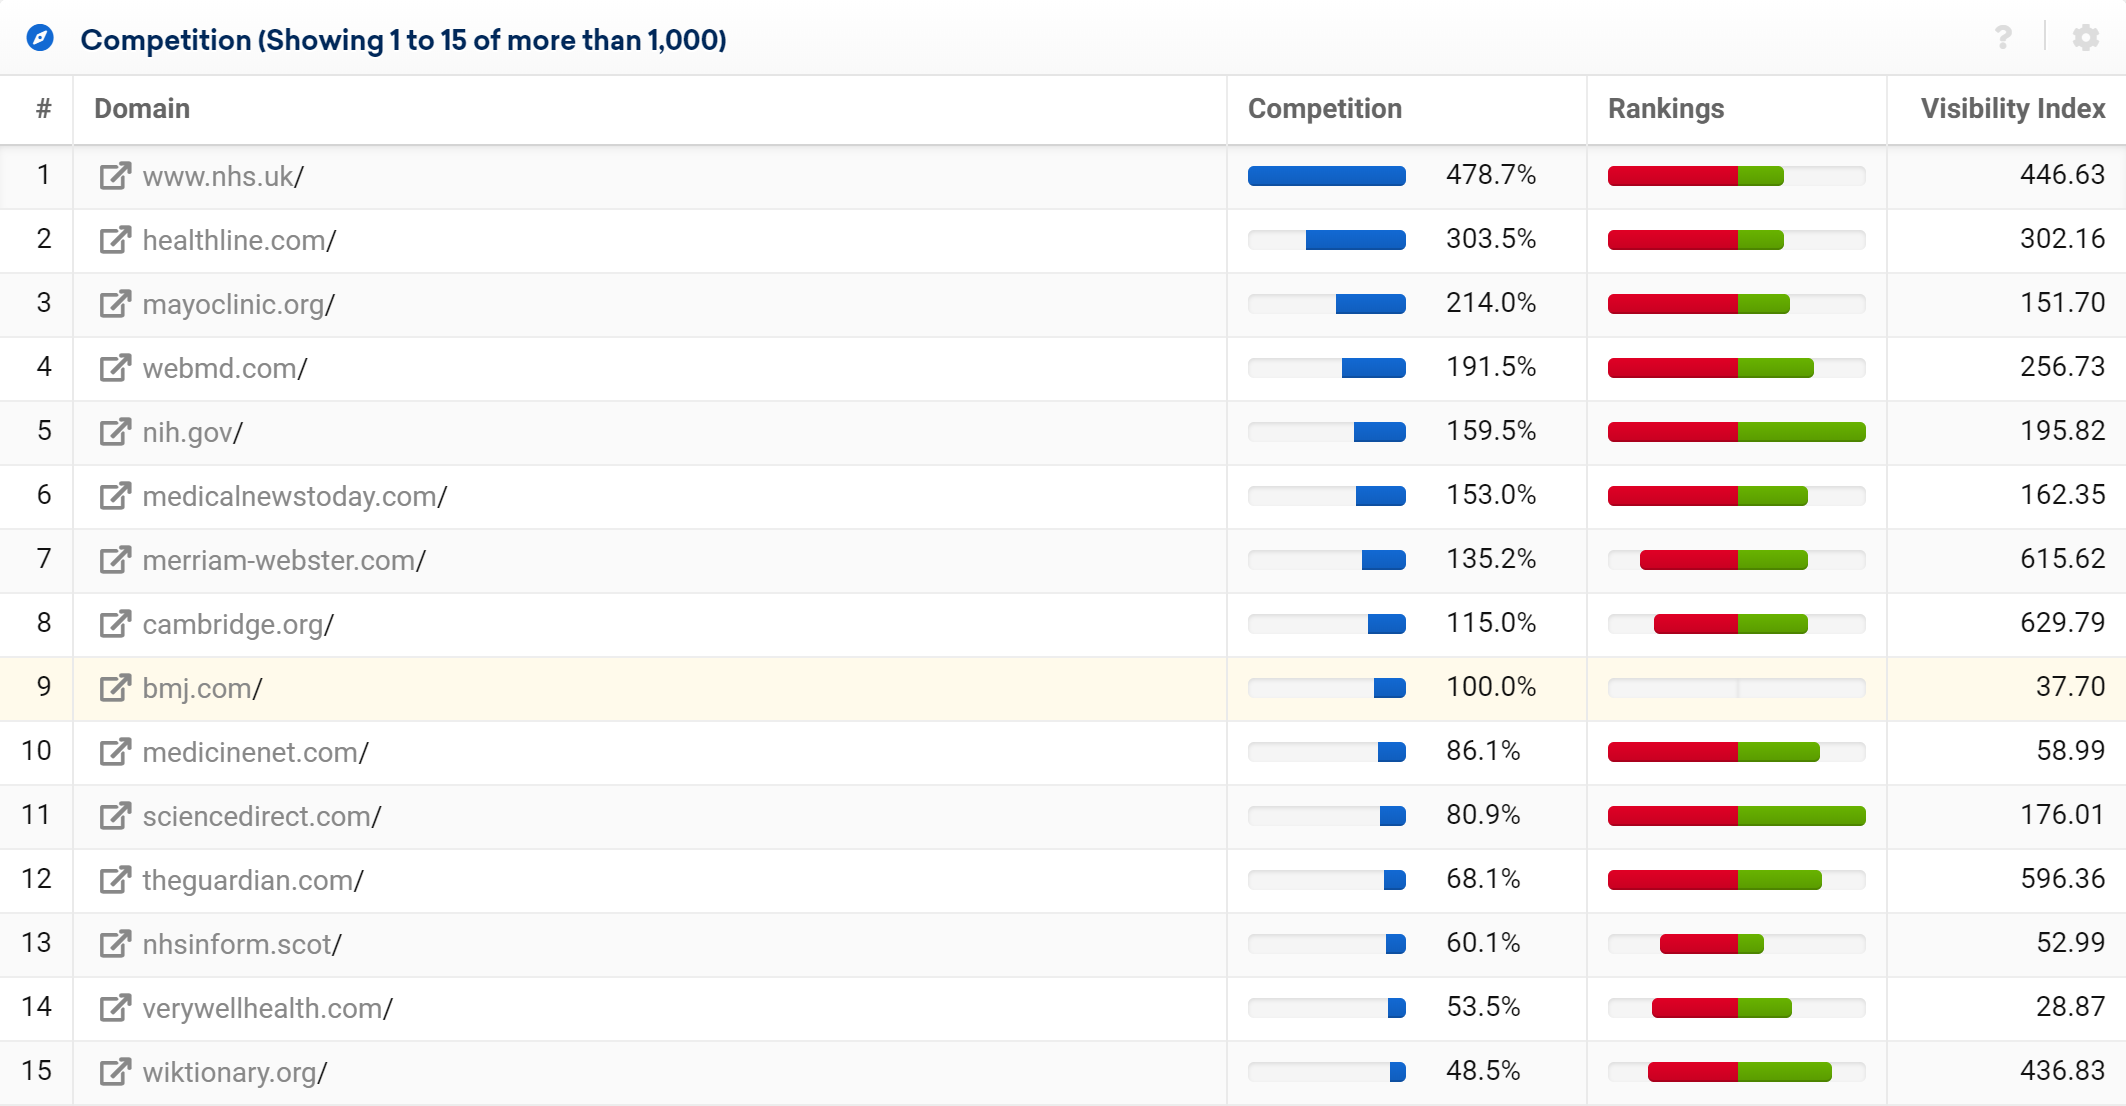
Having identified important competitors you can either create a dashboard for all of your competitors together, or one dashboard per competitor. In the tutorial above we showed you how to monitor a single domain. Let us now take a look at monitoring multiple domains on one dashboard.
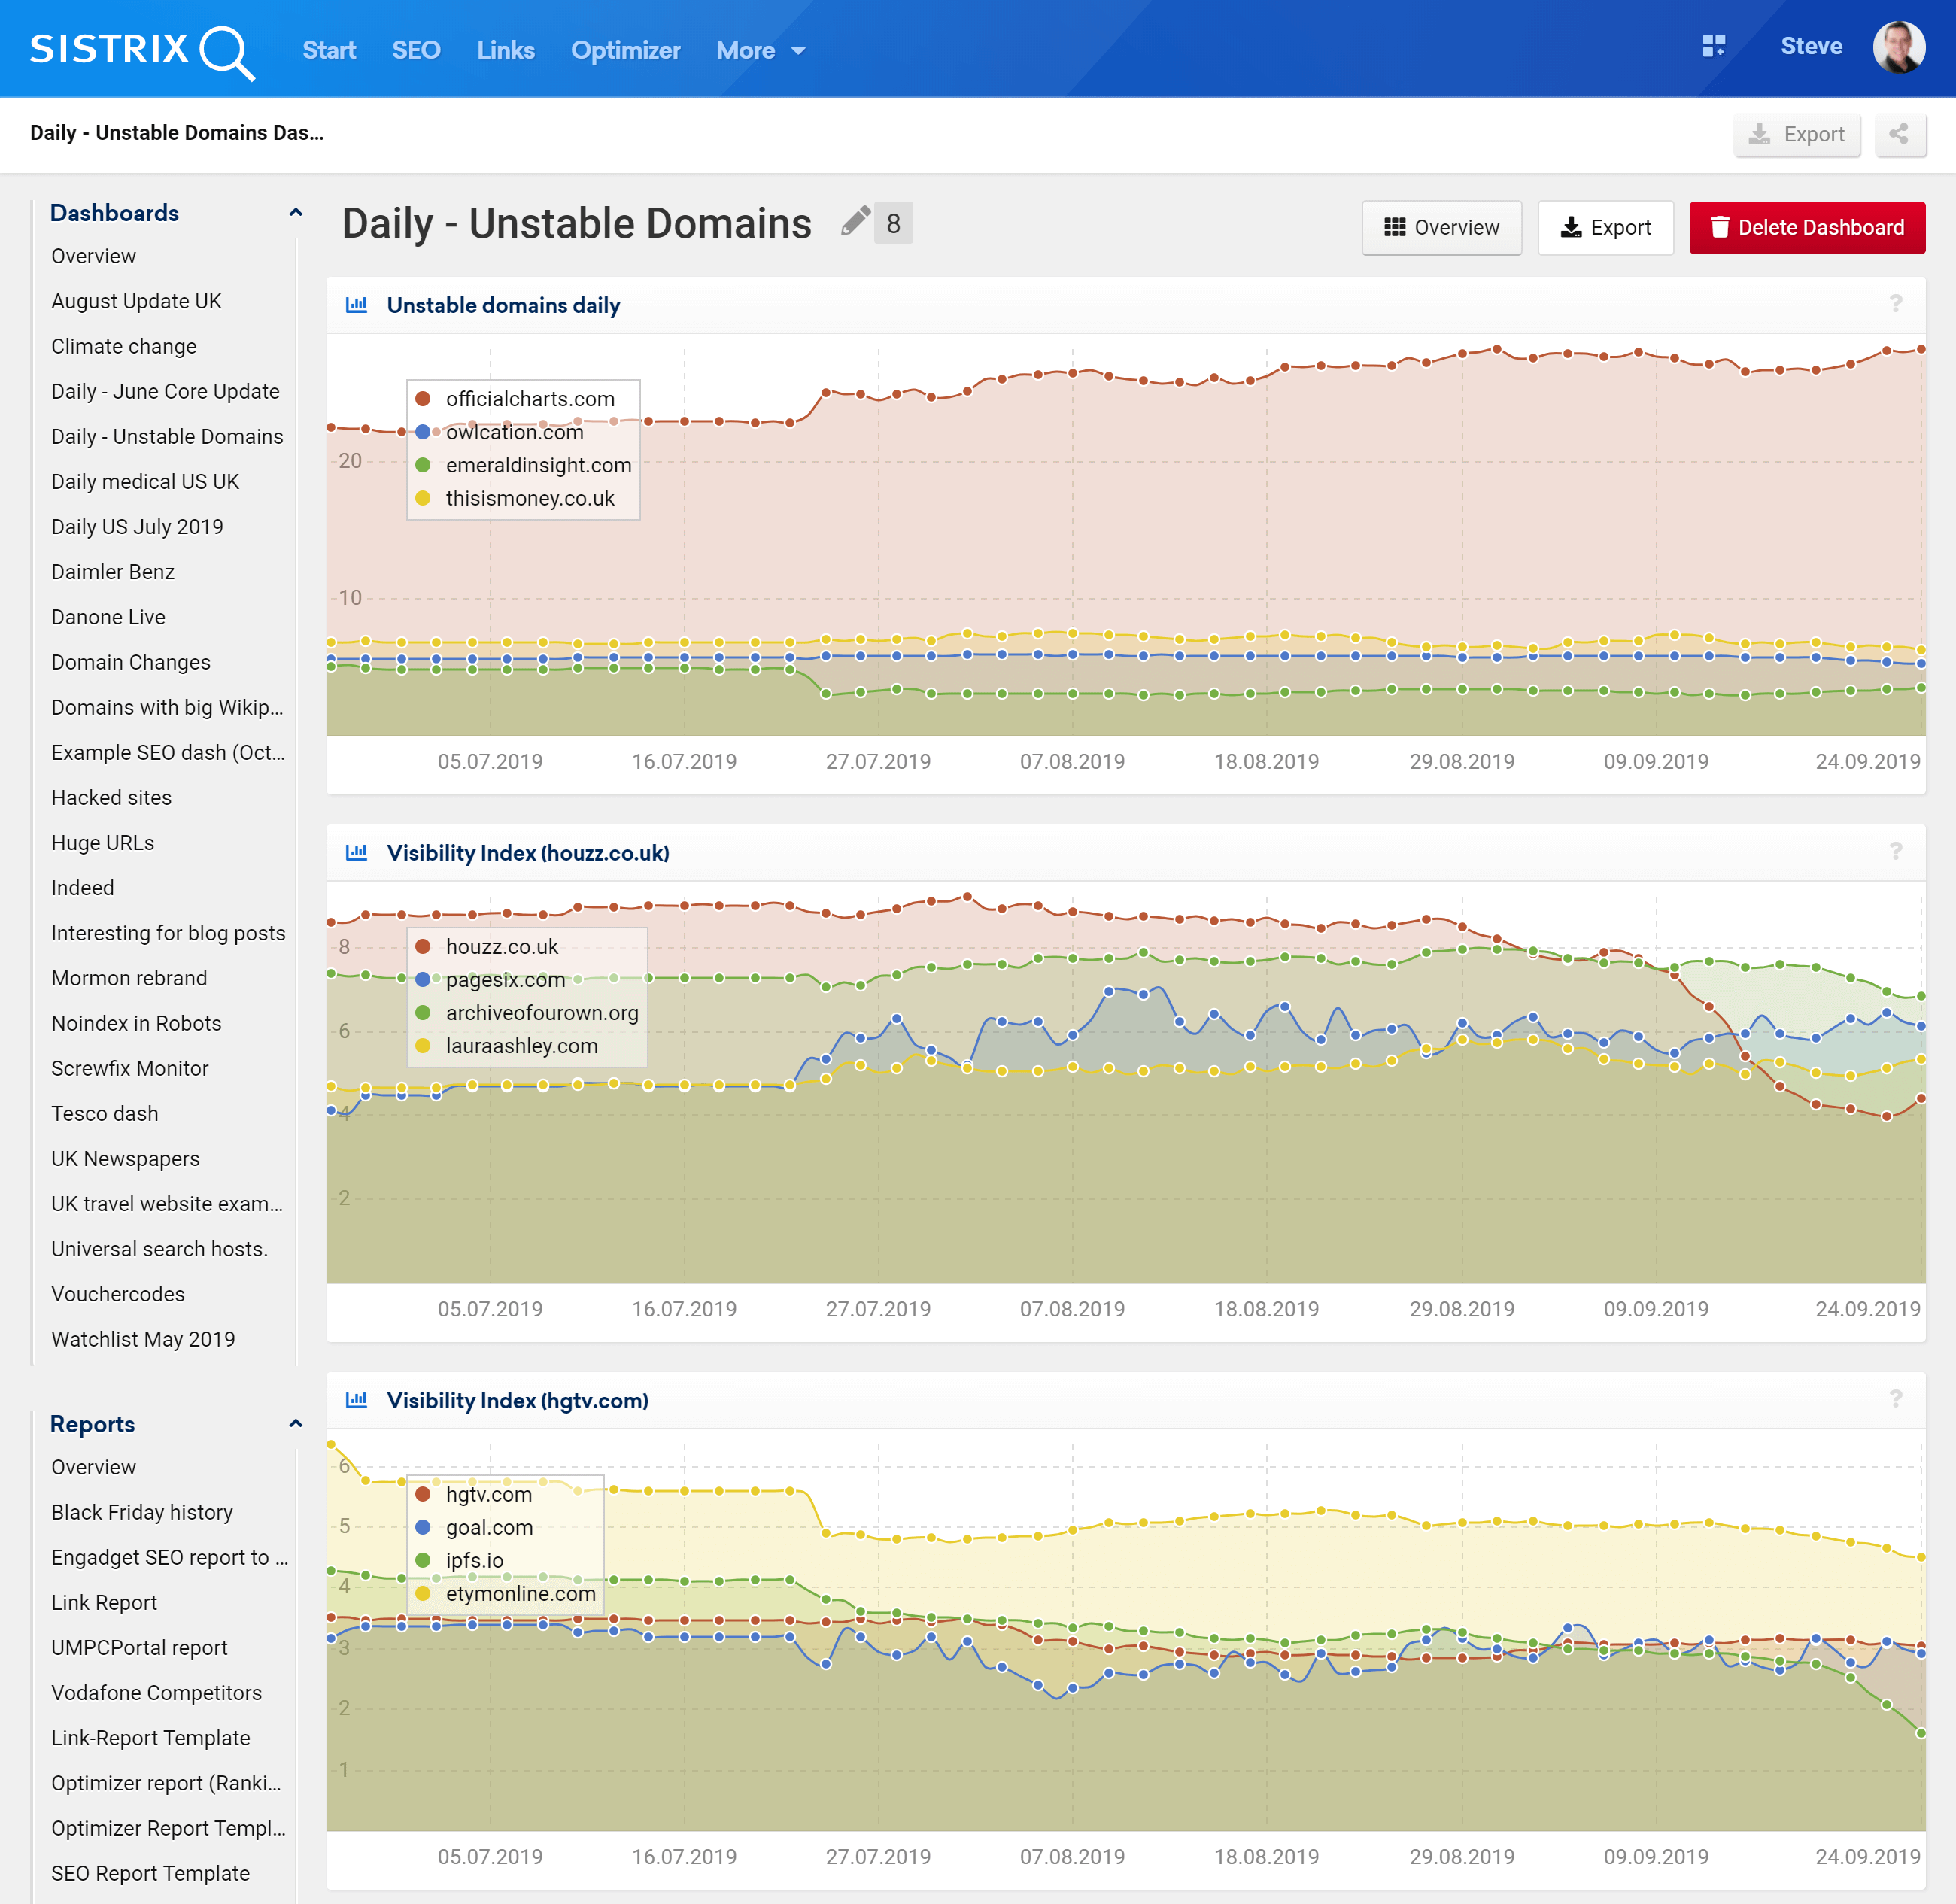
Monitor multiple domains
You can either work with weekly or daily visibility charts but try to stick with one type so that it’s easier to do a direct comparison. In the example below we have combined multiple charts which include multiple daily VI timelines in each graph. By doing this it’s easy to scan through many domains to look for common changes. Two examples of possible changes are:
- View changes across multiple domains that might be caused by a Google Algorithm update.
- View interrelationships of close competitors as one domain loses or gains significant visibility.
Minimalist Dashboard
If you want to track the live VI for many domains, you can just add the first box in the SEO-Module for every hostname and directory you want to monitor to your dashboard. Your dashboard will have a minimalist look and give you a live overview of competitors. Remember that you can add hosts, directories and even URLs.
Other dashboard ideas
Monitor multiple country Visibility Indexes for a single domain to get an international view on the domain. You could, for example, add the important hreflang location for each country into one dashboard.
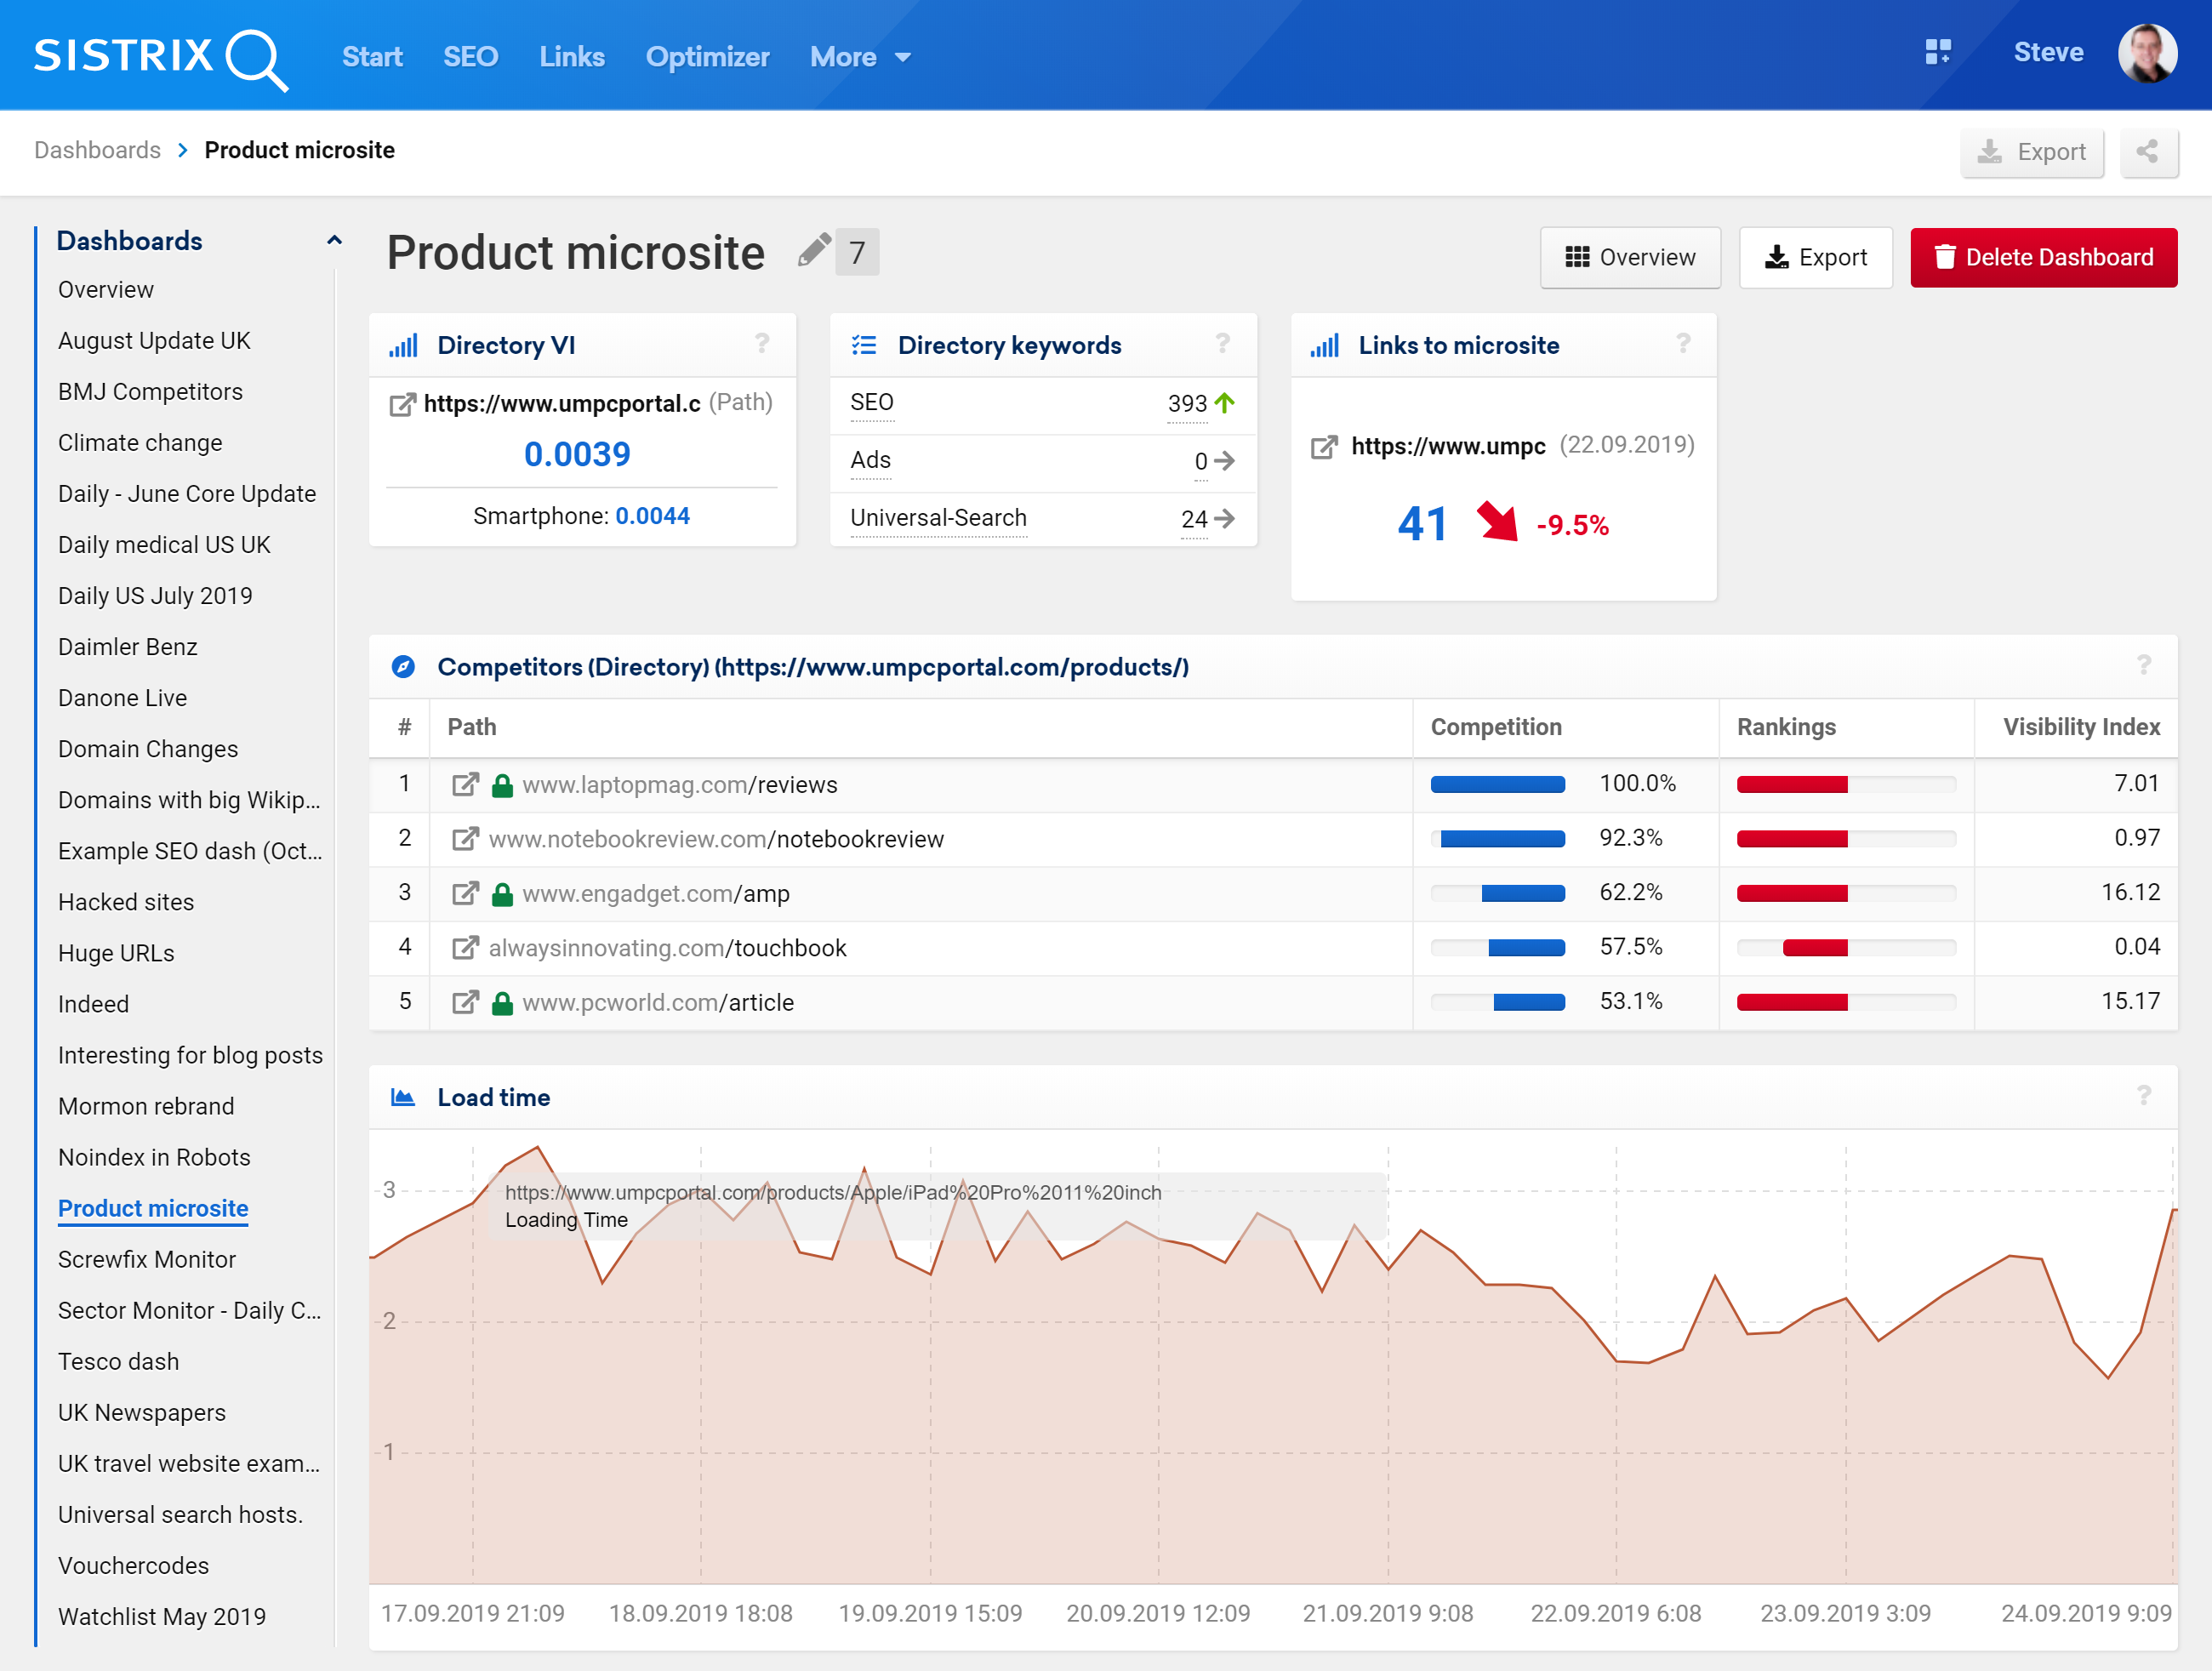
Use the Optimizer to monitor a product launch which might include new content, brand or model names that are not in the historical data. Add these, and monitor the directory or host where the new ‘micro site’ is hosted. You can also add links, load-time and directory-level competitors as shown in the example below.
Monitor new Social shares to see what content is popular on social networks.
Summary
By using dashboards you’ll get a focused overview of the most important movements when it comes to your domain, or your competitors. Combine elements from various modules, including the Optimizer, to create dashboards that team members can use to keep them focused on the right figures. Mobile views, shareable views and PDF exports help to keep stakeholders informed, at any time.