
Analyse the Ranking Distribution of a website to determine how much trust Google has in a domain or whether you have been penalised, and quickly find ways to improve your SEO work.
- Why should I use Ranking Distribution?
- Ranking Distribution in SISTRIX
- Example Use Cases
- Google's trust in a domain, host, directory or URL
- Recognise the effects of a manual penalty
- Detect crawling or competitor issues
- Find Page 2 optimisation opportunities
- Compare domains in a sector to find best practices and opportunities
- View the development of a domain during an SEO project
- The truth doesn't always lie on the surface
The Ranking Distribution visually shows you how the rankings are distributed across the first 10 Google result pages. In this tutorial, we show you where to find the Ranking Distribution in SISTRIX, how to analyse it and in which cases it can help you in your daily SEO work.
For those of you that would like a quick walk-through, here’s a demo video. More details and example uses are shown below.
Why should I use Ranking Distribution?
Being a graphical representation, it can be used to quickly analyse a domain for the following aspects, for example:
- Analyse Google’s trust in a domain, host, path or URL
- Compare competitors to find best practices
- Find Page 2 optimisation opportunities
- Analyse the background of a manual Google penalty
- Monitor the progress of a project during certain SEO measures
With the Ranking Distribution, you can assess the ranking performance of a domain. In a separate article, you can learn more about Ranking Distribution as one of the most important SEO metrics and different performance types.
Ranking Distribution in SISTRIX
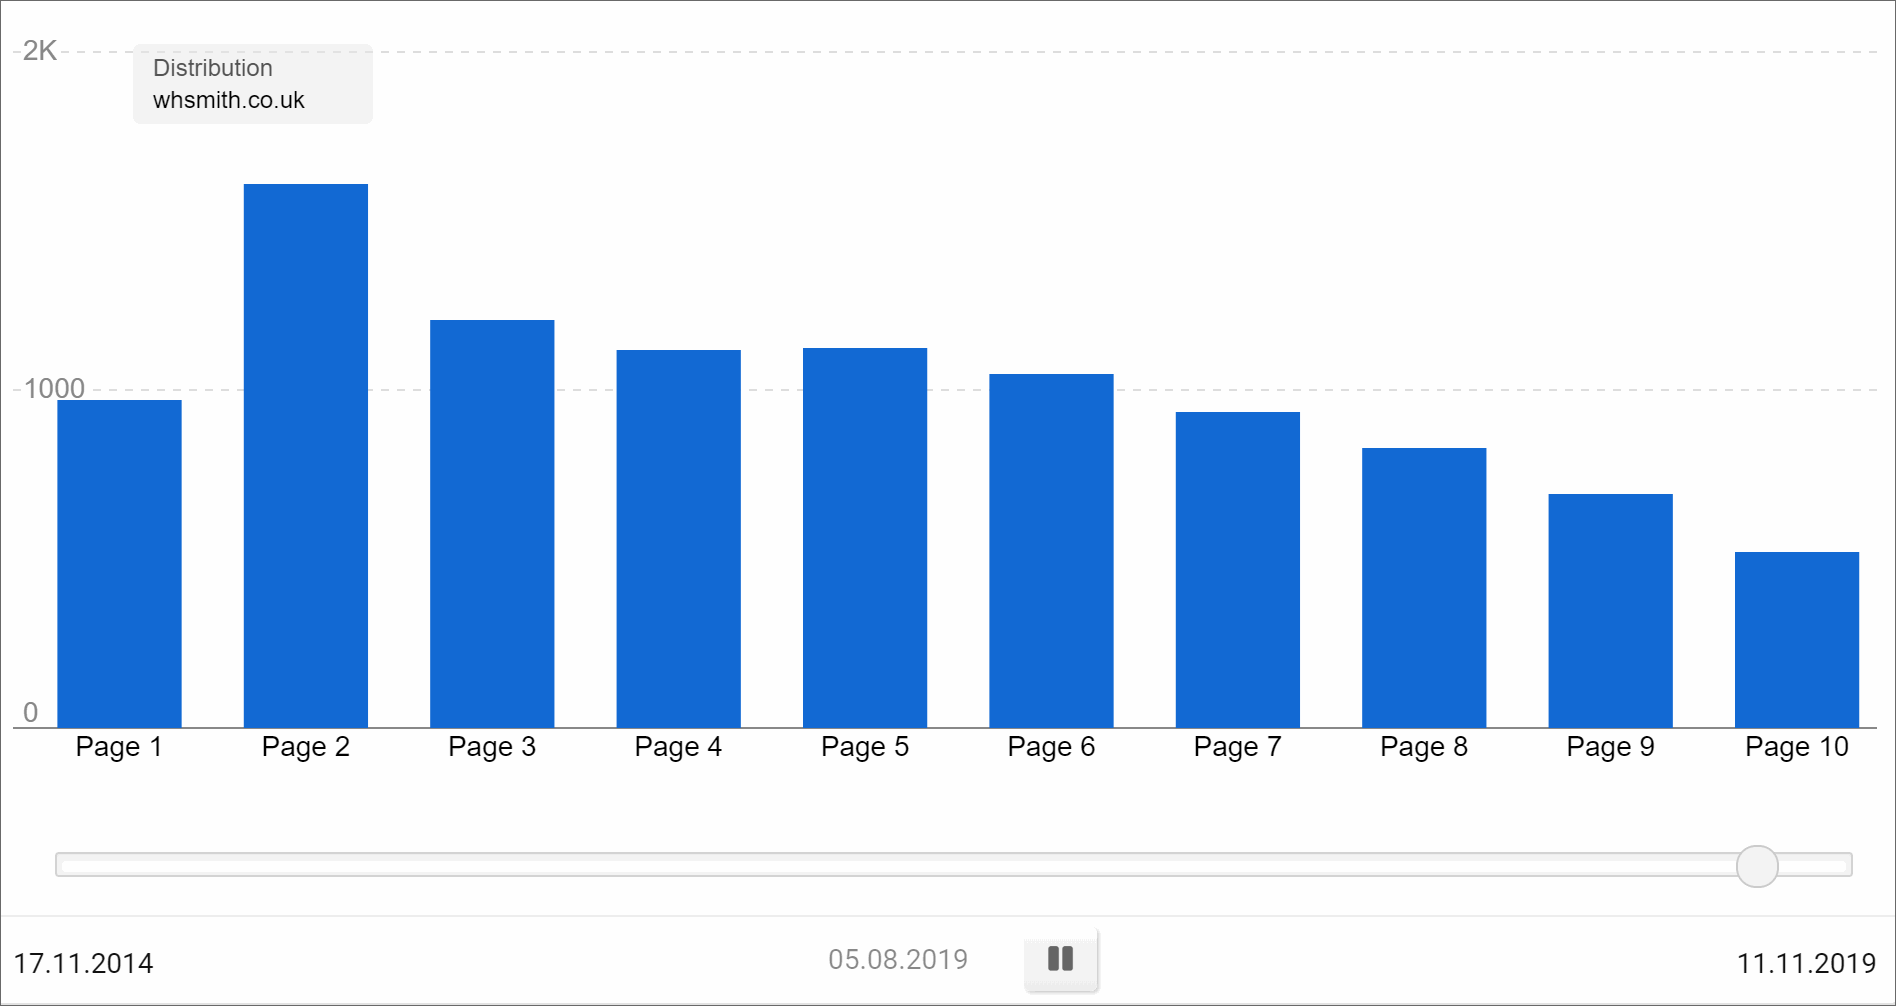
The ranking distribution data is available for all domains, hosts, directories and URLs that have rankings.
You will find the ranking distribution in the navigation on the left-hand side after entering a domain (or host, directory, URL) into the SISTRIX search bar. 1
The SISTRIX Toolbox will, as the default setting, show you the percentage value of mobile data. You can change these settings using the options at the top of the screen:

Choose between absolute values or percentages 2. Later in the tutorial, we will explain when this makes sense.
With the button “Options” 3 you can switch between mobile and desktop data.
In addition, you will find the buttons to export the entire page as a PDF, to create a shortlink or to open the manual on ranking distributions.
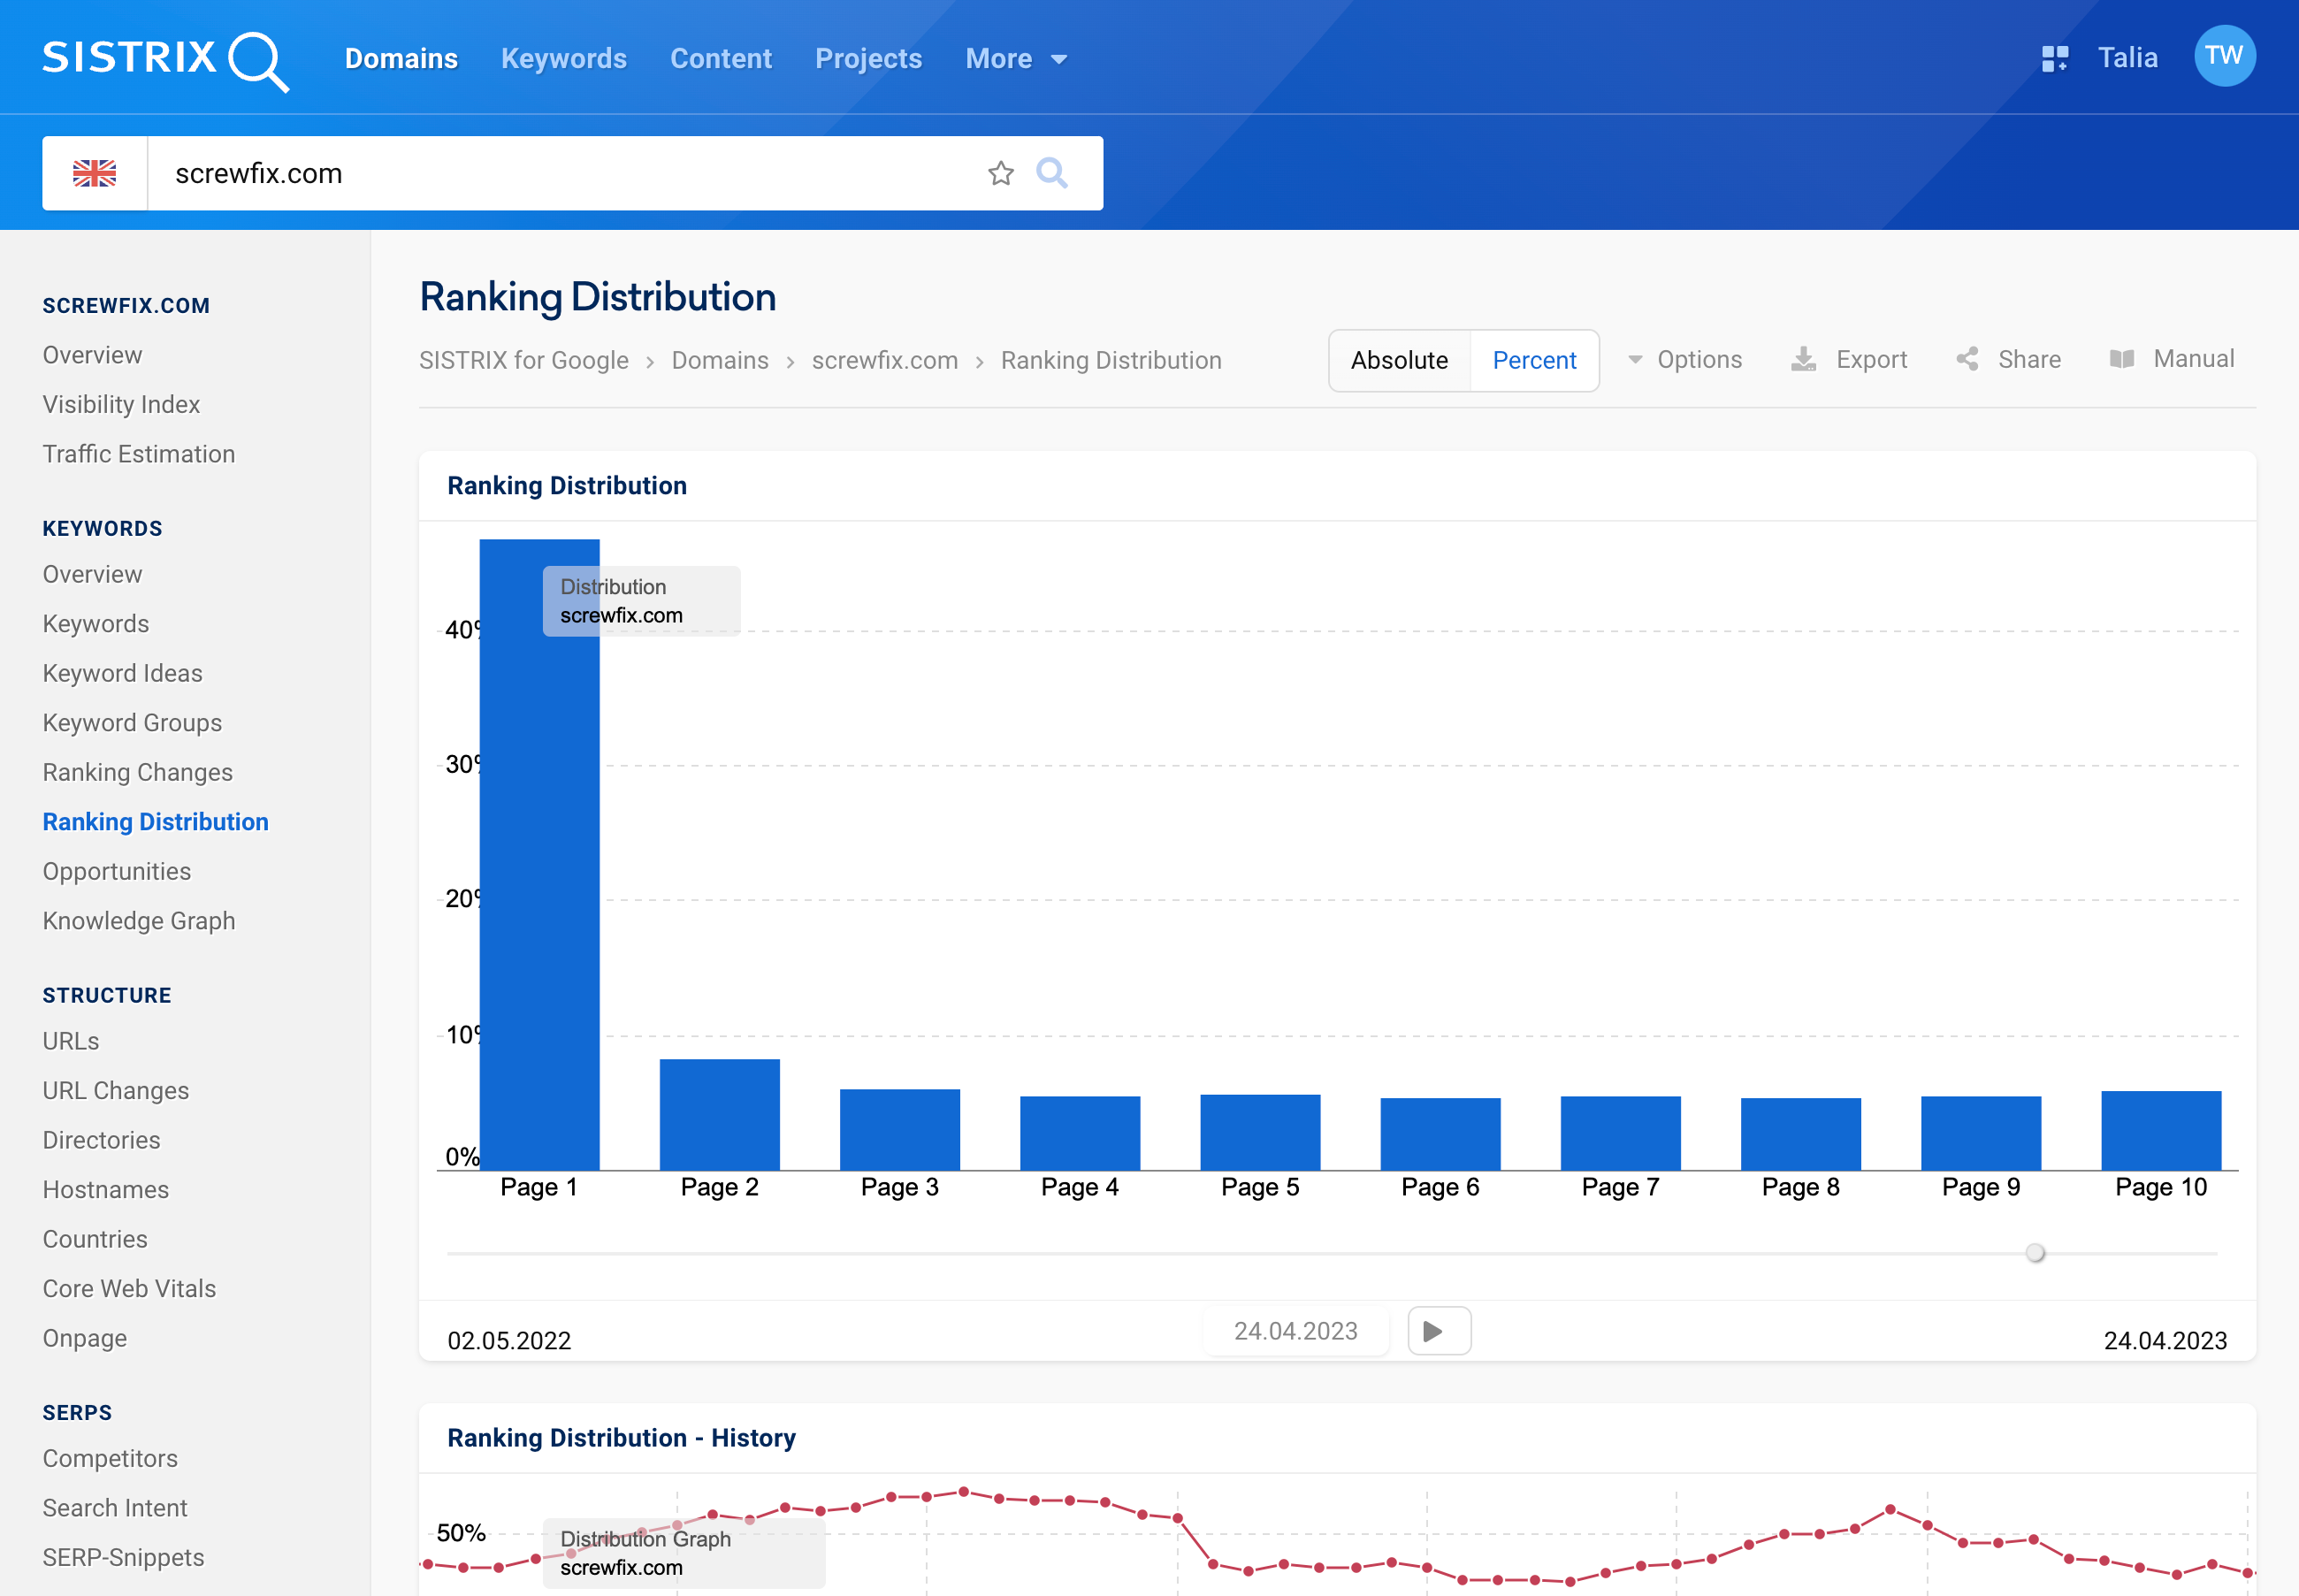
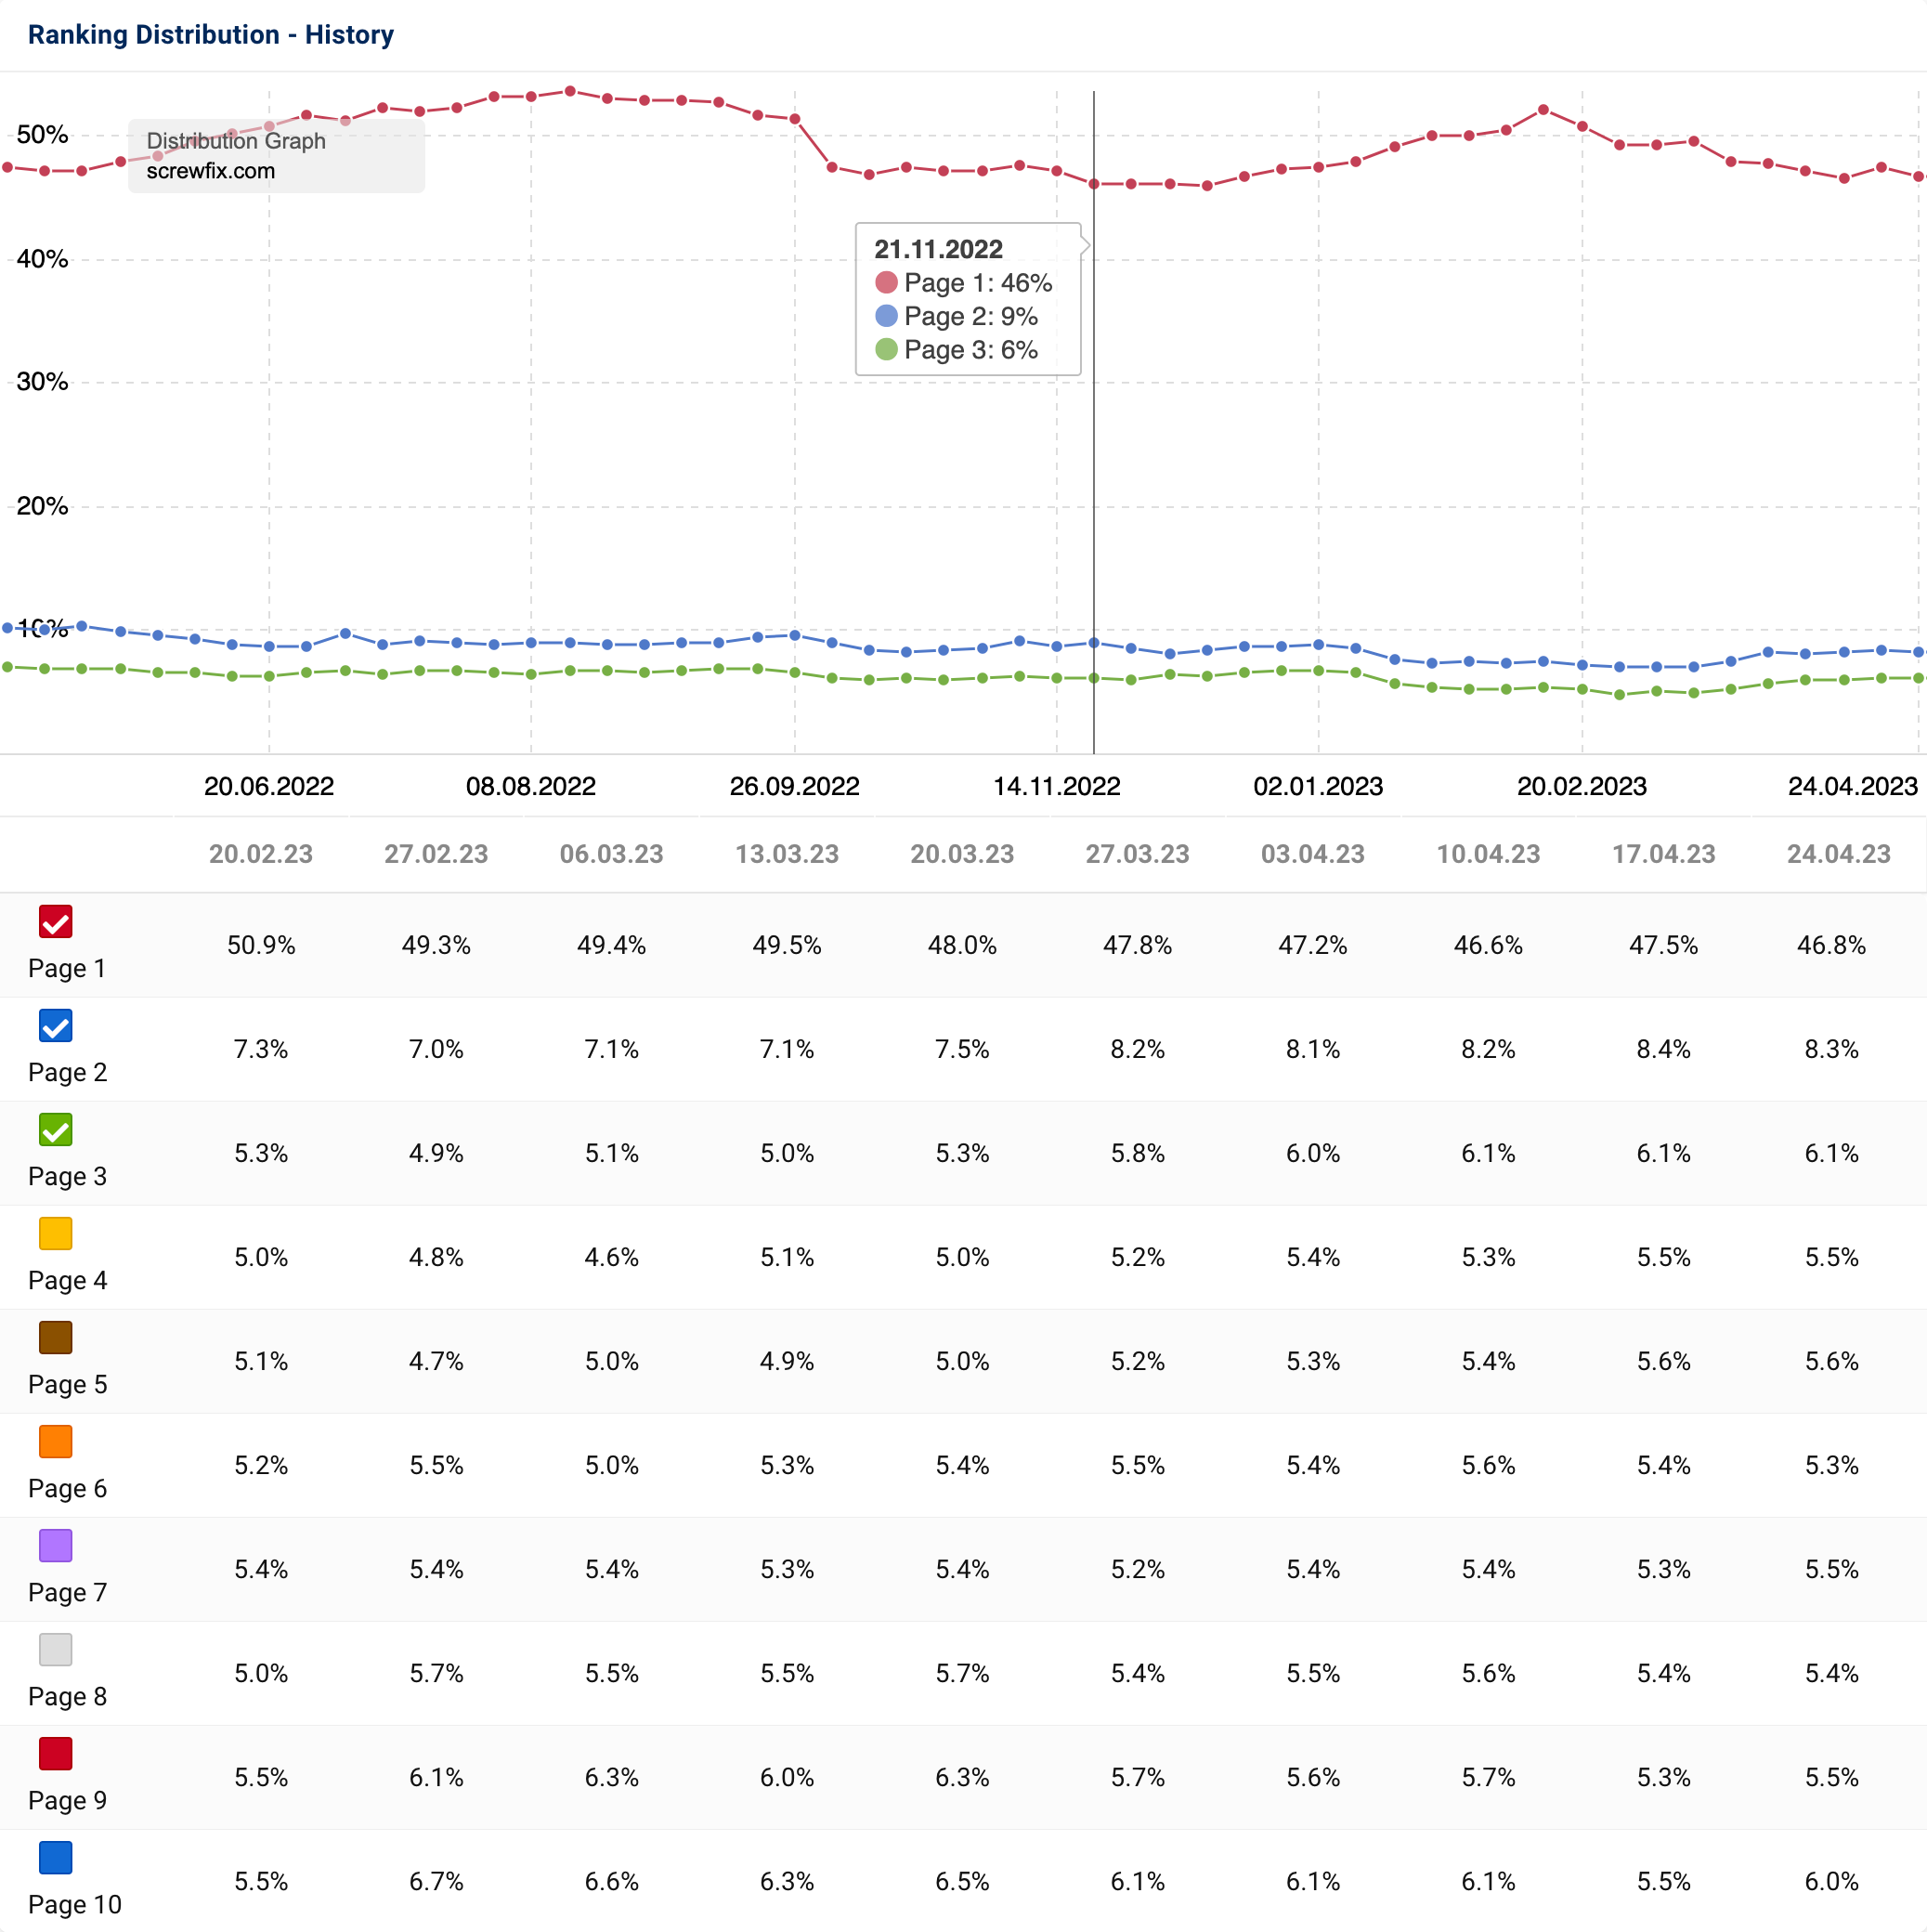
The bar chart directly below the options menu shows you how the rankings of the analysed domain are distributed across the first 10 results pages on Google. Page 1 represents the organic ranking positions 1 to 10, page 2 are positions 11 to 20 and so on until page 10, which shows positions 91 until 100.
In our example, we see that 46.81% percent of the top 100 rankings of the domain screwfix.com are on the first Google results page.
The objective of every SEO should be to rank on the first Google results page for relevant keywords with the own domain.
Note that this analysis shows the number of rankings. That means, if the domain ranks on positions 1 and 3 for the same keyword, both rankings are counted.
The ranking distribution can also be checked for subdomains, directories or individual URLs. Thanks to this in-depth analysis, you’ll be able to spot which content formats are well received from Google’s users and therefore generate more positive ranking signals. More on this later in the tutorial.
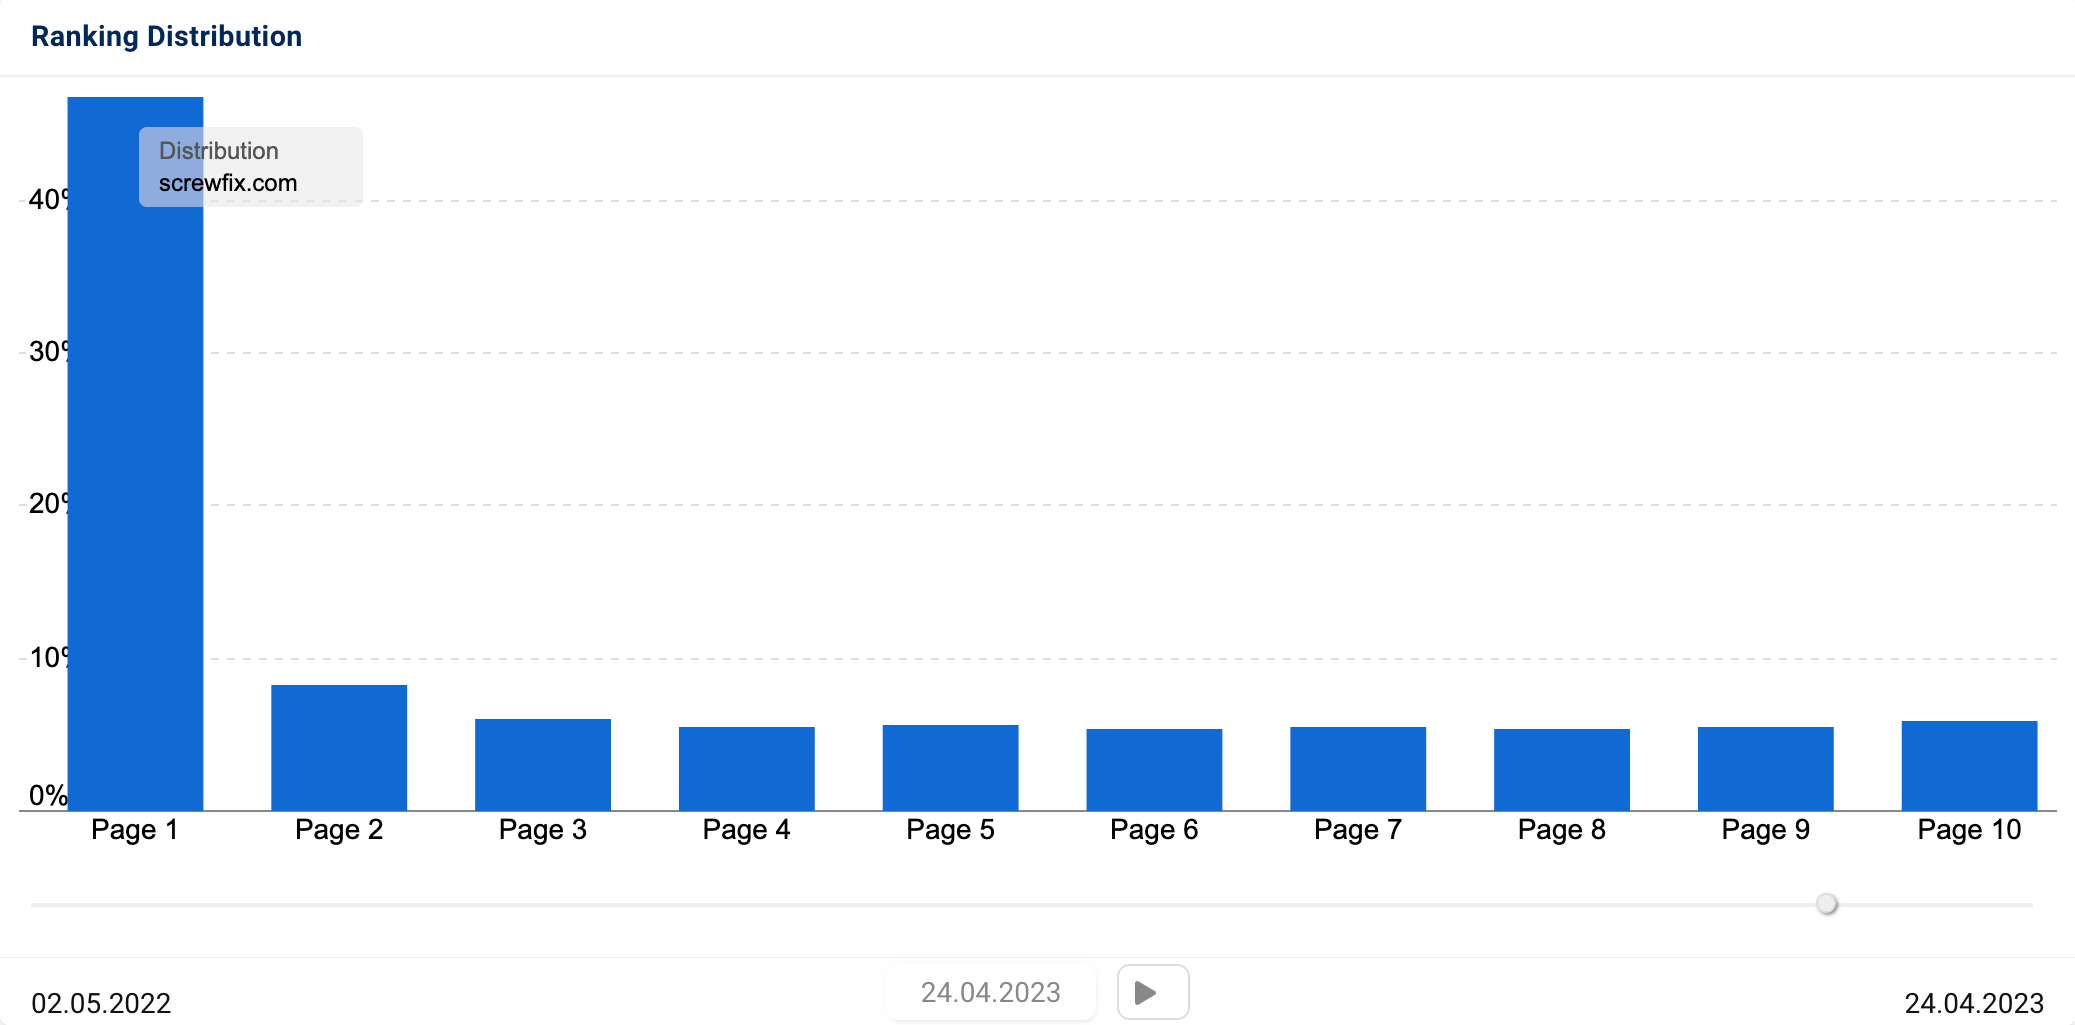
Hover the mouse over one of the bars to see the exact number of rankings (in percent or absolute) for this page. 1 You can also click on the bar to be redirected to the keyword table for the domain for this Google results page.
With the help of the slider below the diagram, you can look at the ranking distributions at specific points in time up to one year into the past. 2
By clicking on the play button below the slider, you can start a slideshow of the historical development of the ranking distribution. 3
The slideshow allows you to quickly analyse the changes of a website at a glance. That way you can see whether a certain content format of a competitor is becoming stronger over time, for example, and whether you should take a closer look then.
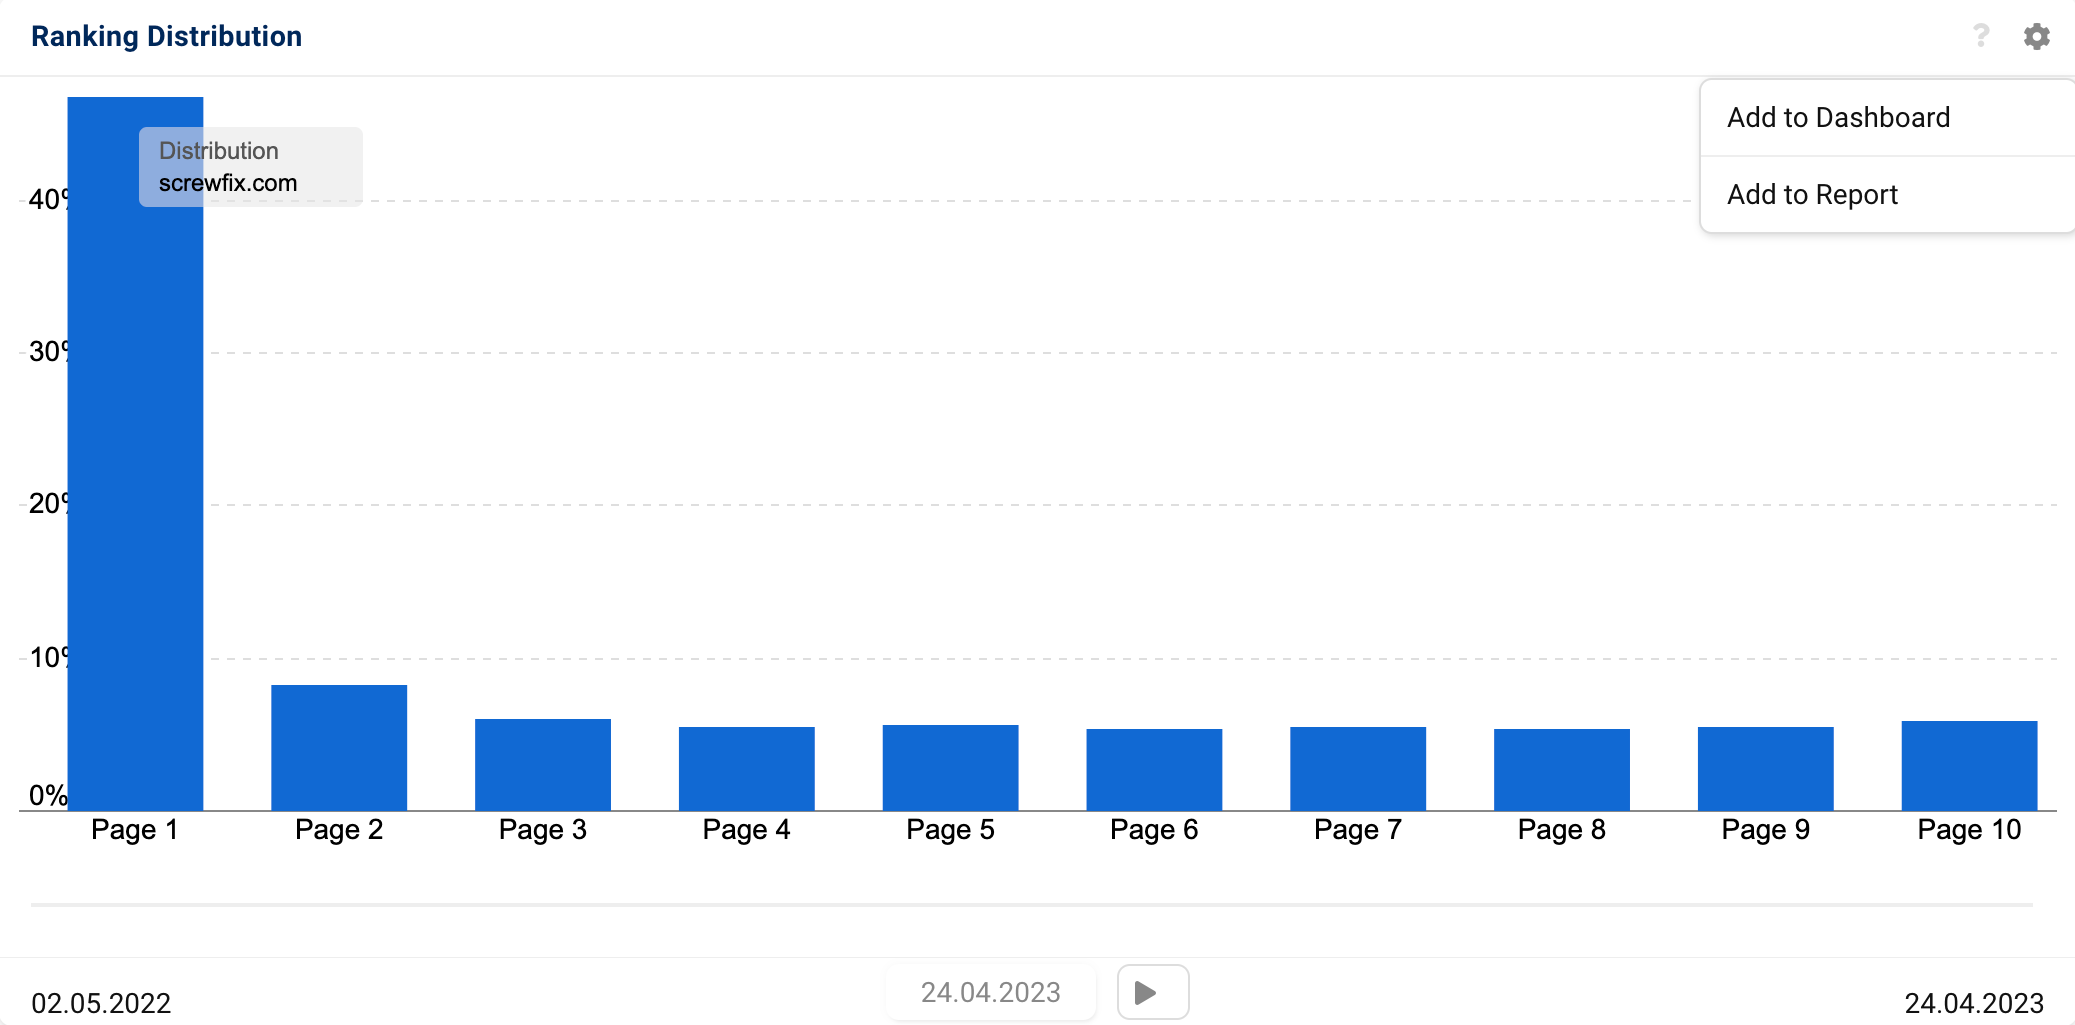
The cogwheel in the top right corner of the bar chart 4 takes you to the box options. There you can add the chart to a dashboard or a report.
Directly below the bar chart, you will find a graph showing the ranking development throughout the last year. There you can directly compare and analyse the rankings on the various Google pages.
By default, the lines for the first three pages will be displayed. You can select or deselect more pages with the colourful checkboxes in the table below the graph 5.
By hovering the mouse over one of the data points in the graph, you will see the values (in percent or absolute) of the domain for the respective week. 6
Here, too, you can access the box options via the cogwheel in the top right of the box 7. There you can, for example, manage event pins, download the graph or also add it to a dashboard or report.
Example Use Cases
The more you analyse the distributions of different domains, the faster you will recognise changes. Below, we will introduce example use cases of ranking distribution analyses.
Google’s trust in a domain, host, directory or URL
With the help of the Ranking Distribution, you’ll be able to measure the success of content on Google, i.e., how much trust Google has in the respective pages.
Let’s assume a page has technical problems. Either the page takes too long to load for Google or takes a long time to render. Or there are other problems on the page that prevent Google from reading and understanding the content.
In that case, it is likely that Google will regard these pages as less important over time and lower the rankings.
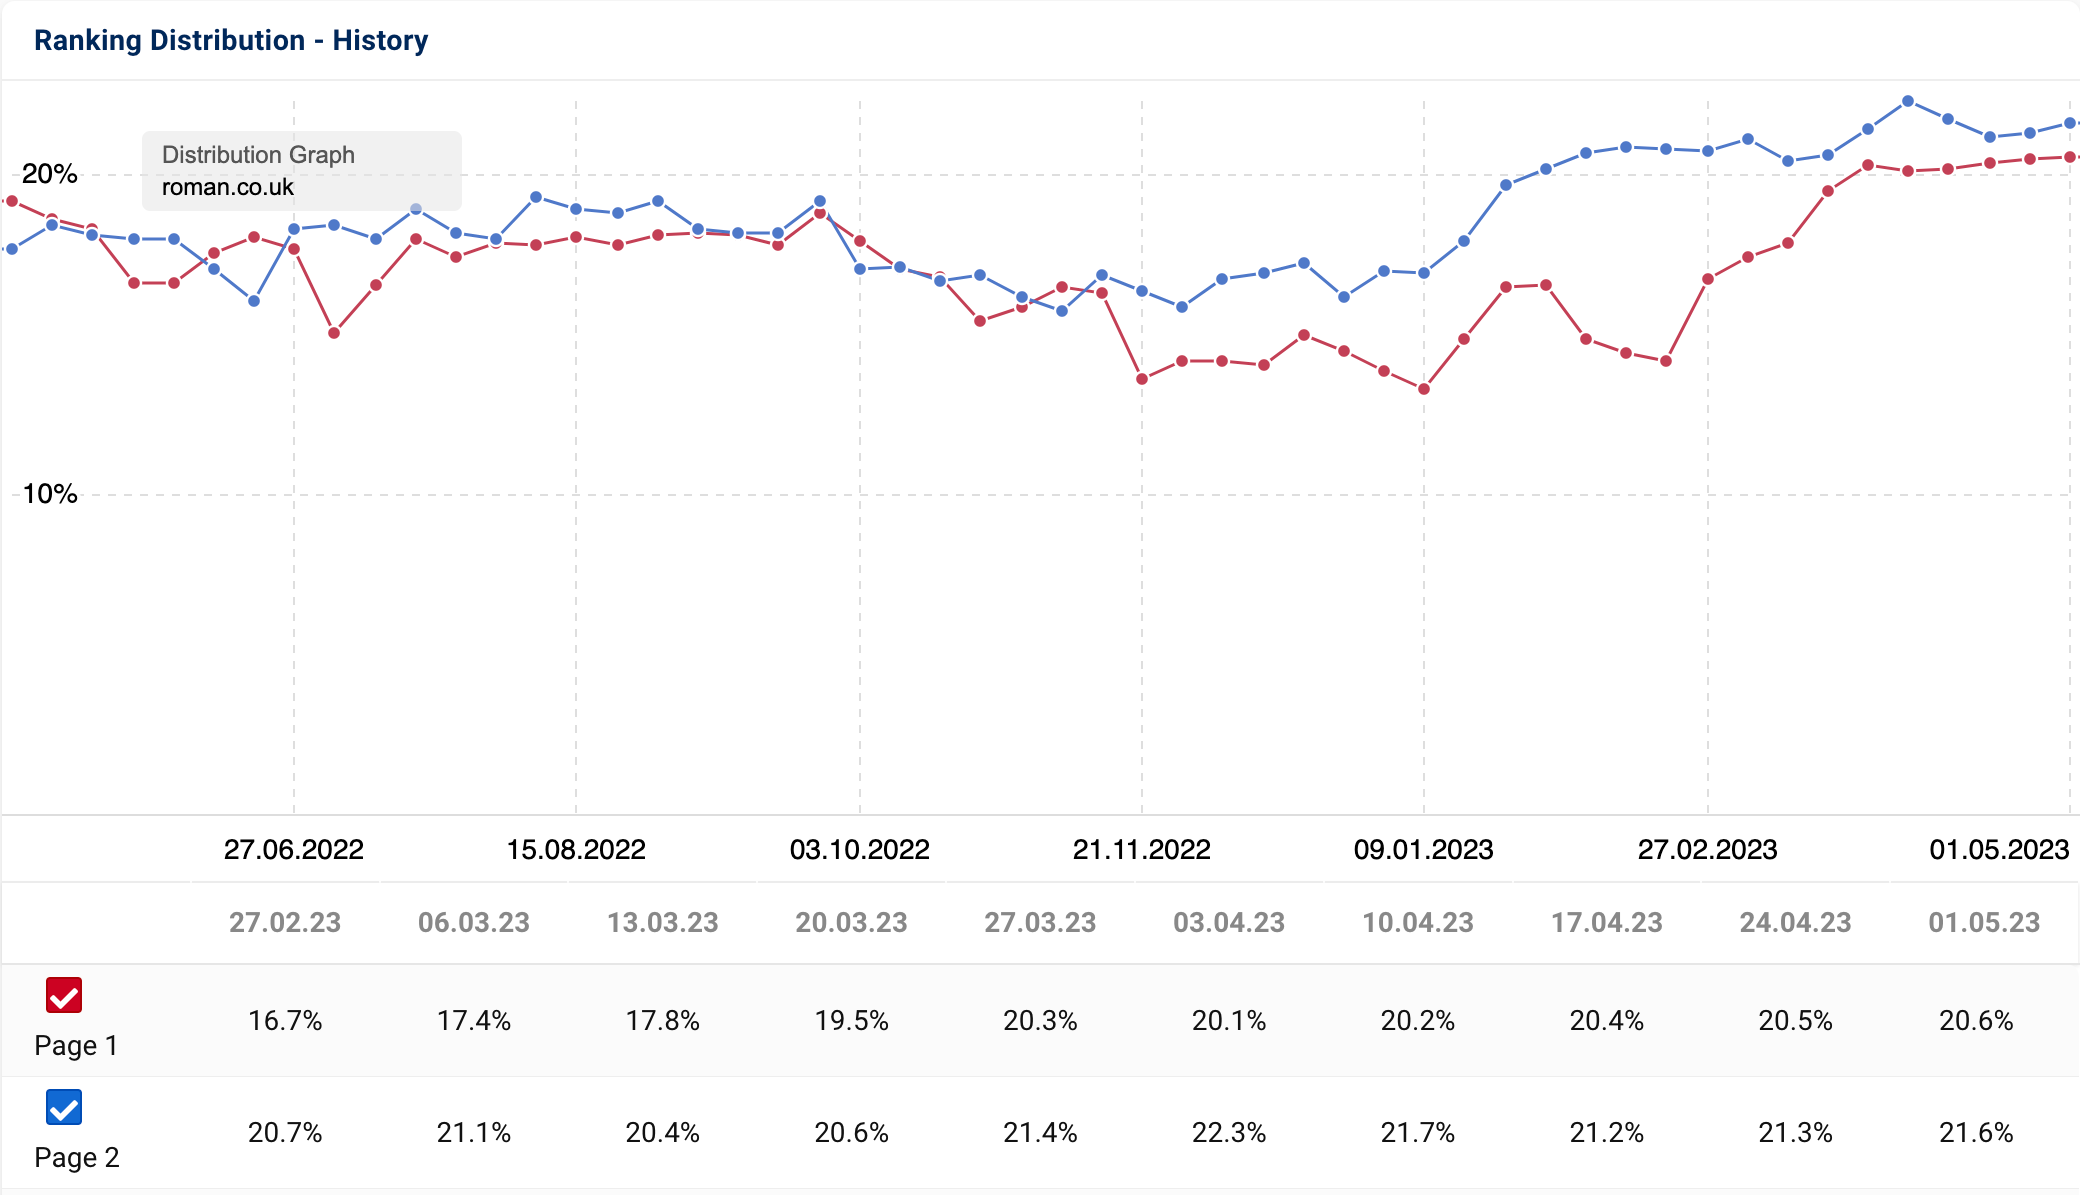
This graph shows the history of the rankings on the first (red line) and on the second (blue line) Google results pages for the domain roman.co.uk. We can see that the rankings on the second Google page rise in December 2022, while the rankings on the first page fall at the same time.
At first glance, a larger number of rankings seem to have migrated from the first page to the second. Google possibly trusted other pages more and pushed the pages of roman.co.uk to the second results page.
Recognise the effects of a manual penalty
The Ranking Distribution can also be used very well to recognise manual Google penalties and make them visible to those affected.
Often, even the rankings for brand keywords are affected. Since you can also analyse the ranking distributions of hosts and paths in SISTRIX, you can also find penalties on a smaller level.
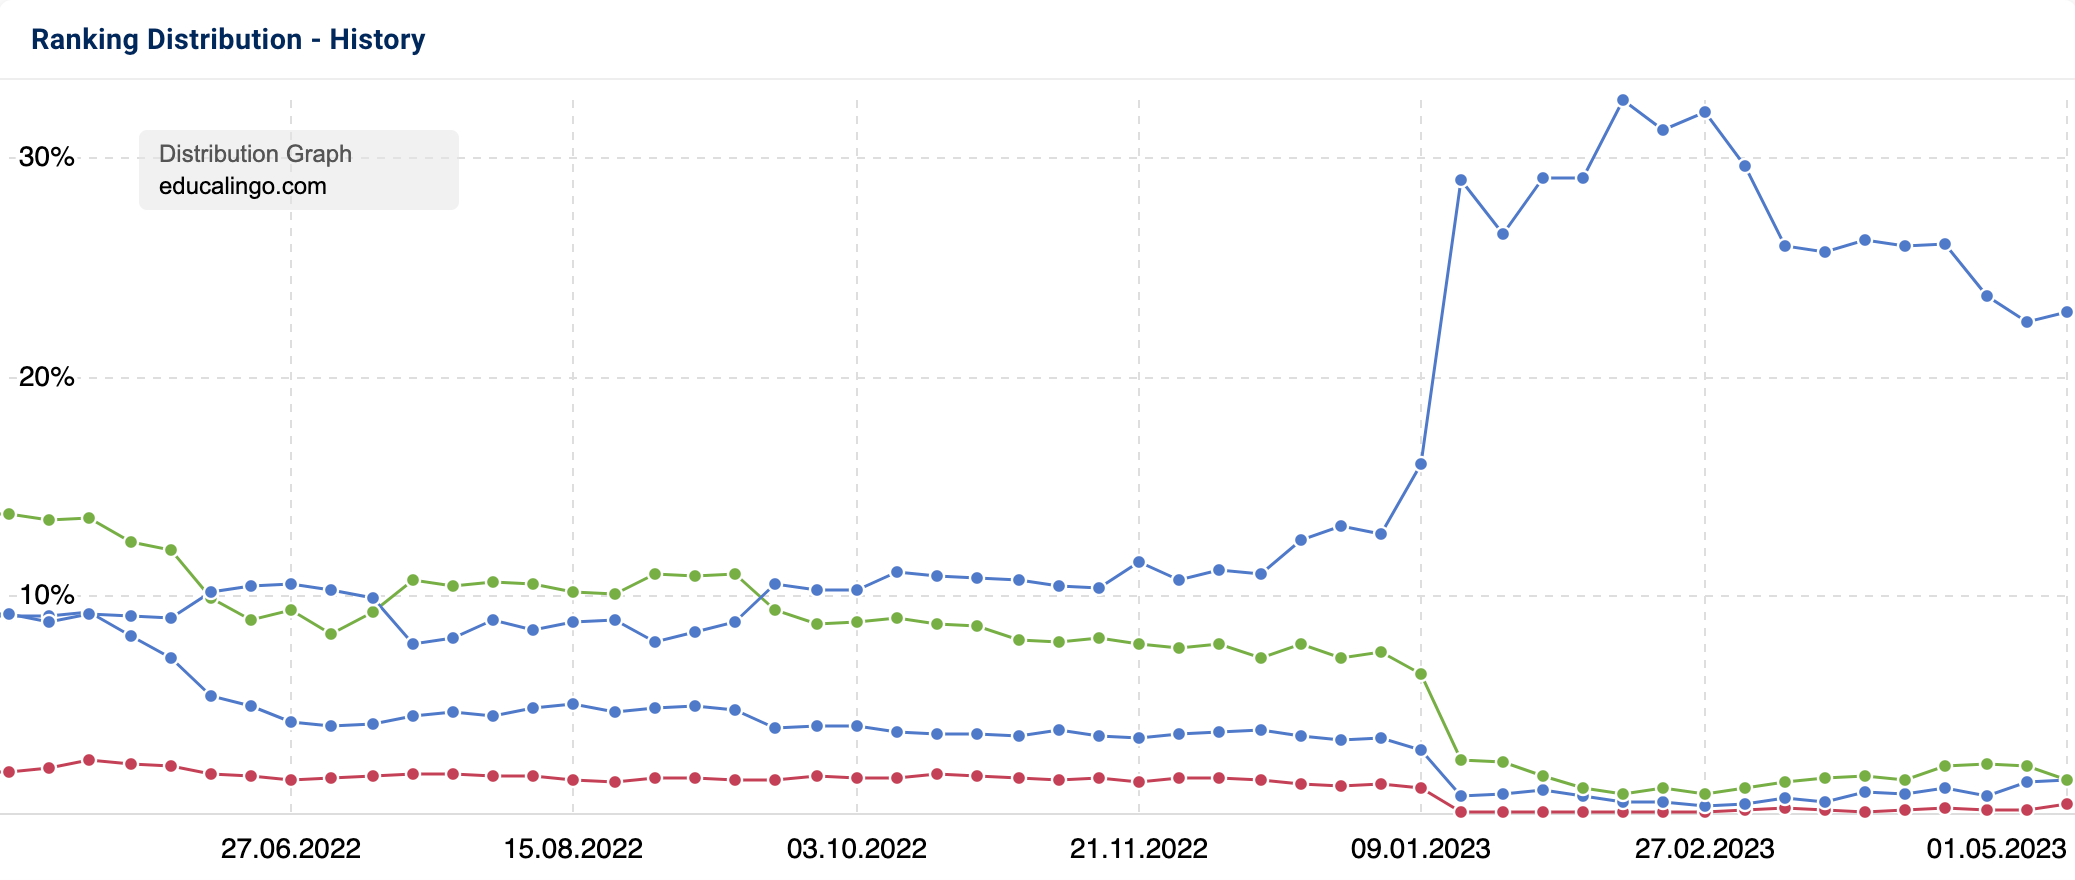
In the example above, the rankings are almost completely pushed out of the first 3 results pages from one week to the next. The tenth result page, on the other hand (the upper blue line), rises rapidly.
To avoid any long-term damage to the website, you should analyse the changes more closely and identify the problem or a solution to it. We explain how to do this in our tutorial on Ranking Changes.
Detect crawling or competitor issues
It is important to cross-check both percentage and absolute values. Quality or competitor issues could be slowly eating away at the rankings of a domain. This might not be recognisable, if only the percentage values are used.
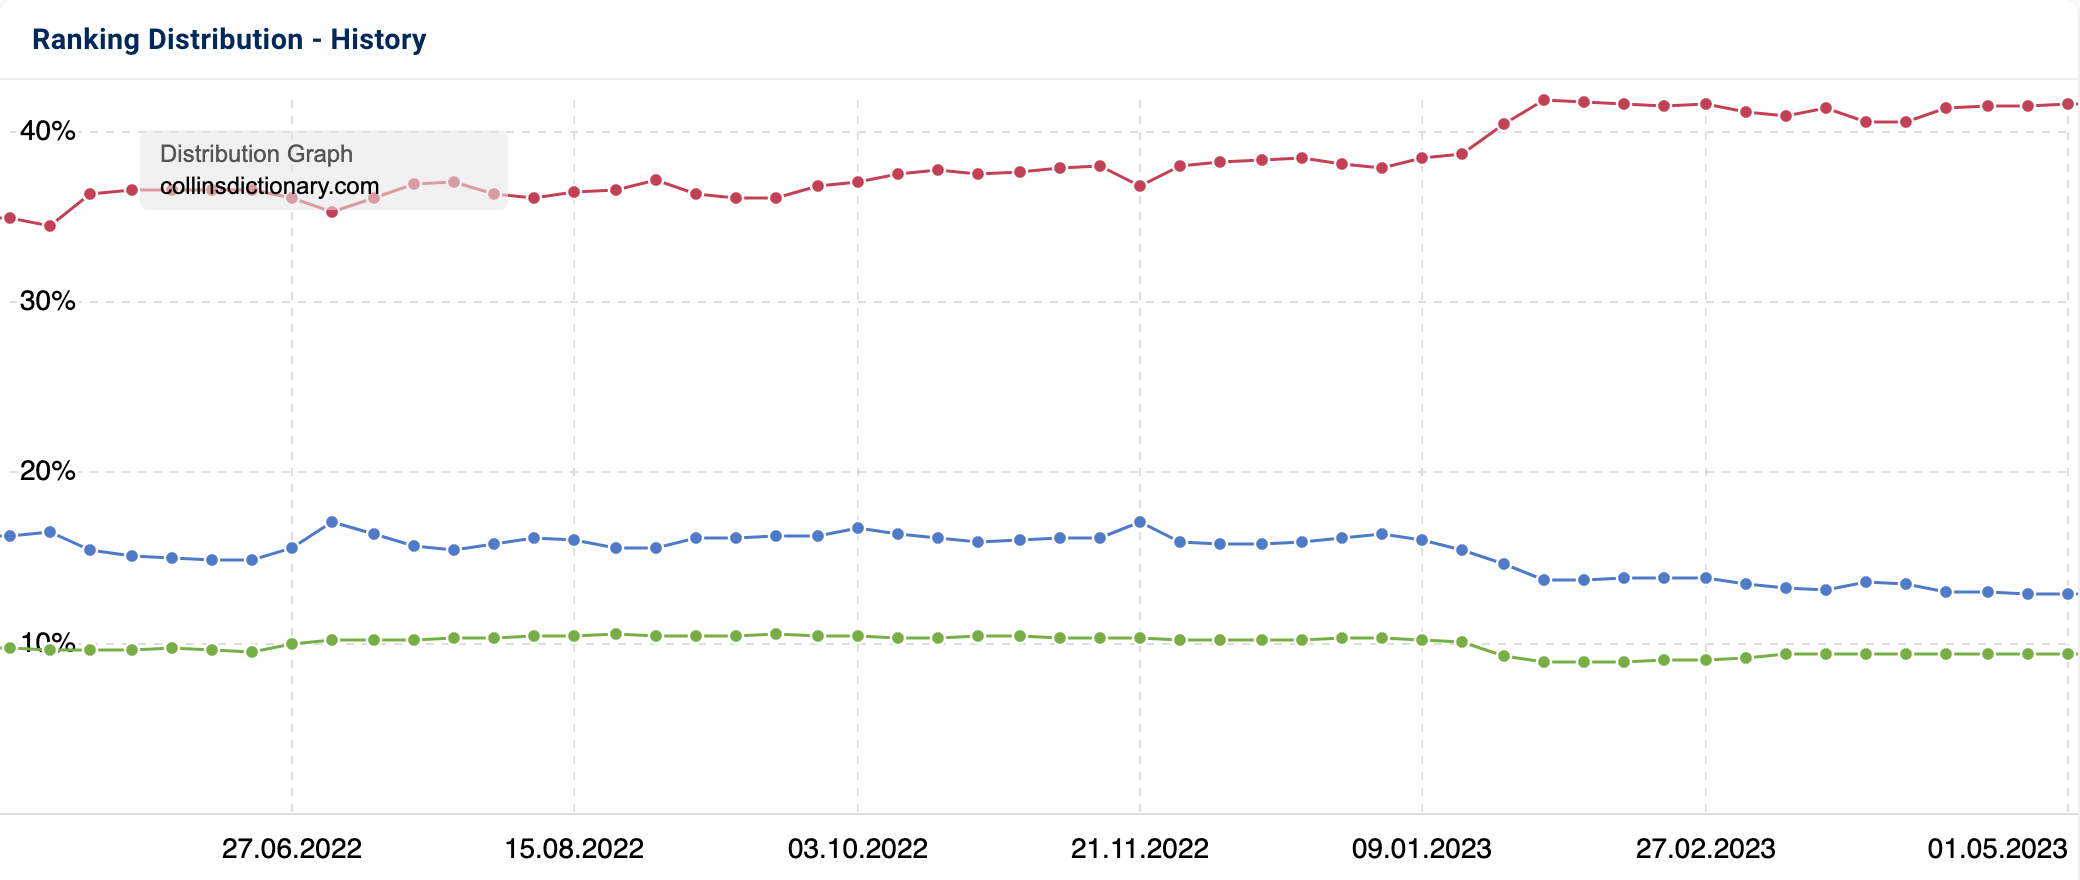
In the graph above for the domain collinsdictionary.com, we see a slightly increasing percentage distribution for page 1 (red) in the beginning of 2023, a slightly decreasing one for page 2 (blue) and a relatively constant percentage distribution for page 3 (green) over time.
However, if we take a look at the absolute values, a completely different image can emerge.
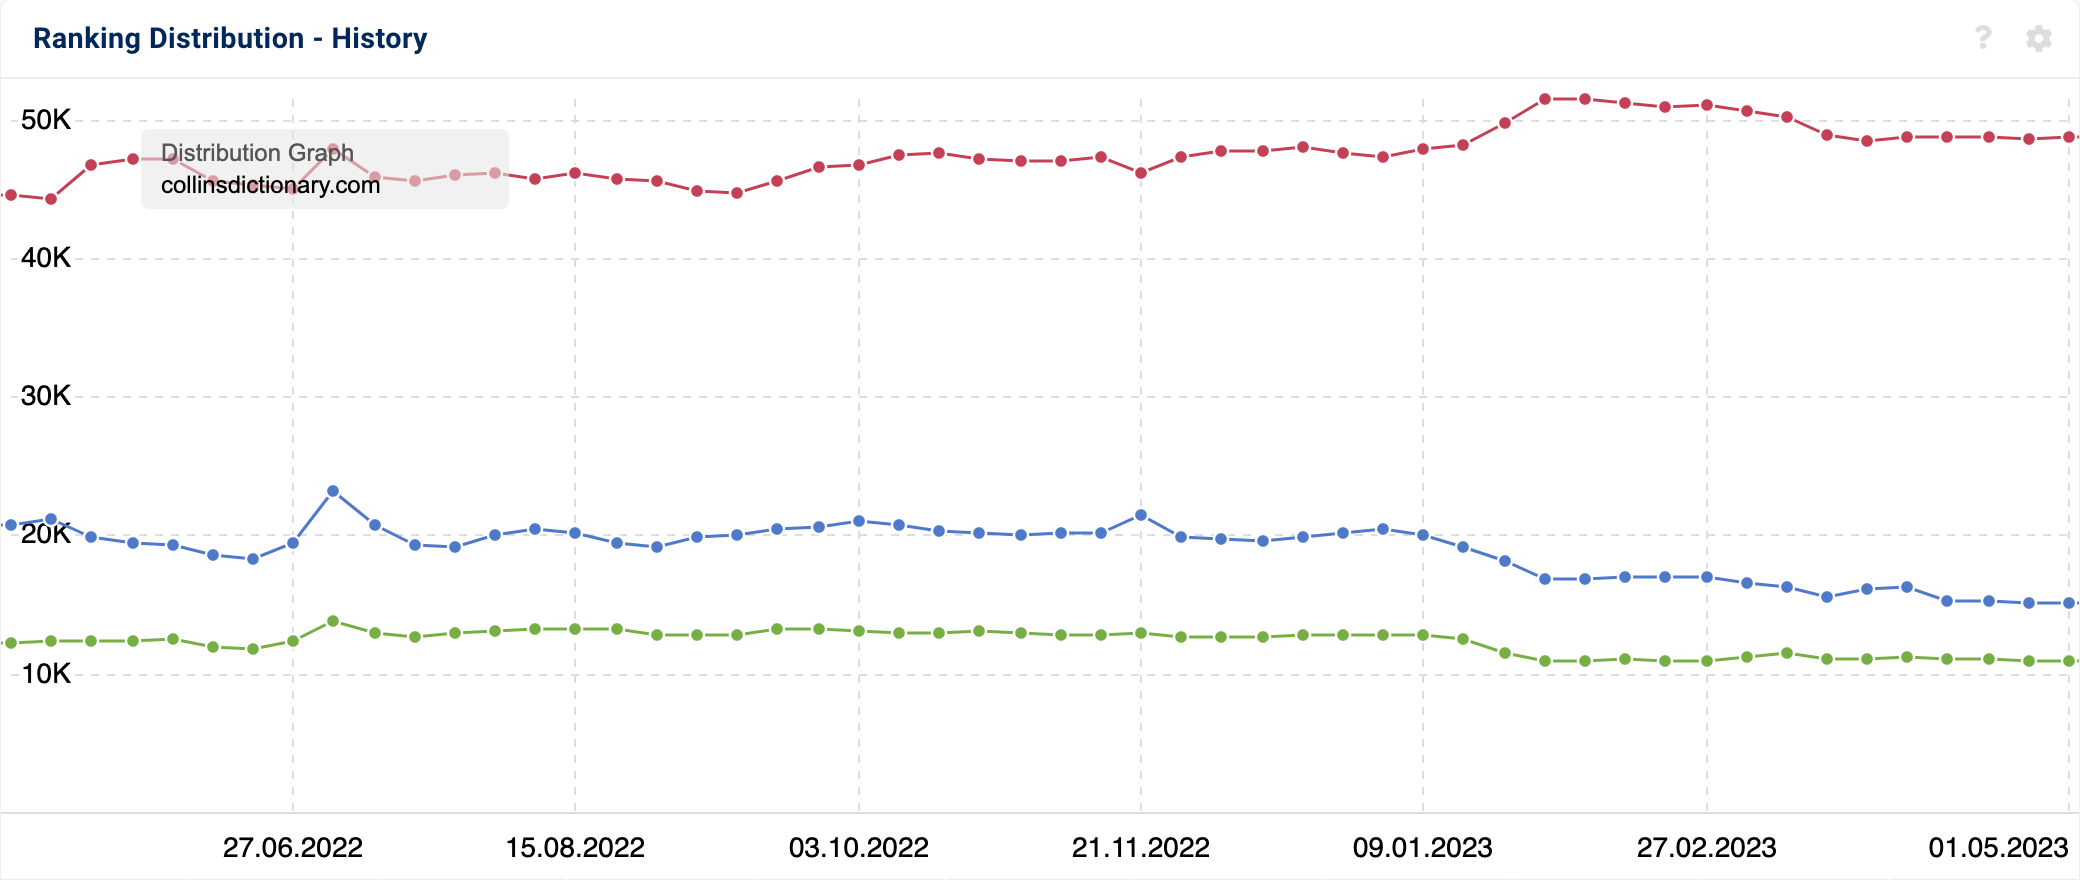
The increase in rankings on the first Google page at the beginning of 2023 is now not so noticeable any more, and pages 2 and 3 both show a slight drop.
The particularly strong percentage increase of the rankings on the first Google page is so significant, precisely because the other results pages are dropping. This naturally increases the percentage of the total rankings of the domain for page 1.
Therefore, you should always cross-check the percentage and absolute ranking distributions so that you don’t miss anything. Based on this, you can analyse fluctuations further and detect SEO issues very early on.
In the case of a slower loss of rankings, it would be prudent to check, whether individual pages are suffering from quality issues or whether they may be a competitor offering better content for the keywords concerned and therefore taking over the ranking.
Find Page 2 optimisation opportunities
Over 99% of all clicks occur on the first search results page. Only a tiny percentage of users make the effort to take a closer look at the results of the second page. That is why you should try to achieve as many rankings on positions 1–10 as possible.
Rankings that are achieved on positions 11–20, i.e., the second Google results page, are called “low hanging fruits”. For these keywords, Google has determined that there is a good contextual correlation between the page and the keyword. However, the page may not yet be good enough to rank on the first results page.
The effort to improve these rankings and to rank on the first SERP for the keywords is, however, small. After all, there is not much left to get there.
The Ranking Distribution can help you identify these rankings. To do this, open the bar chart of a domain.
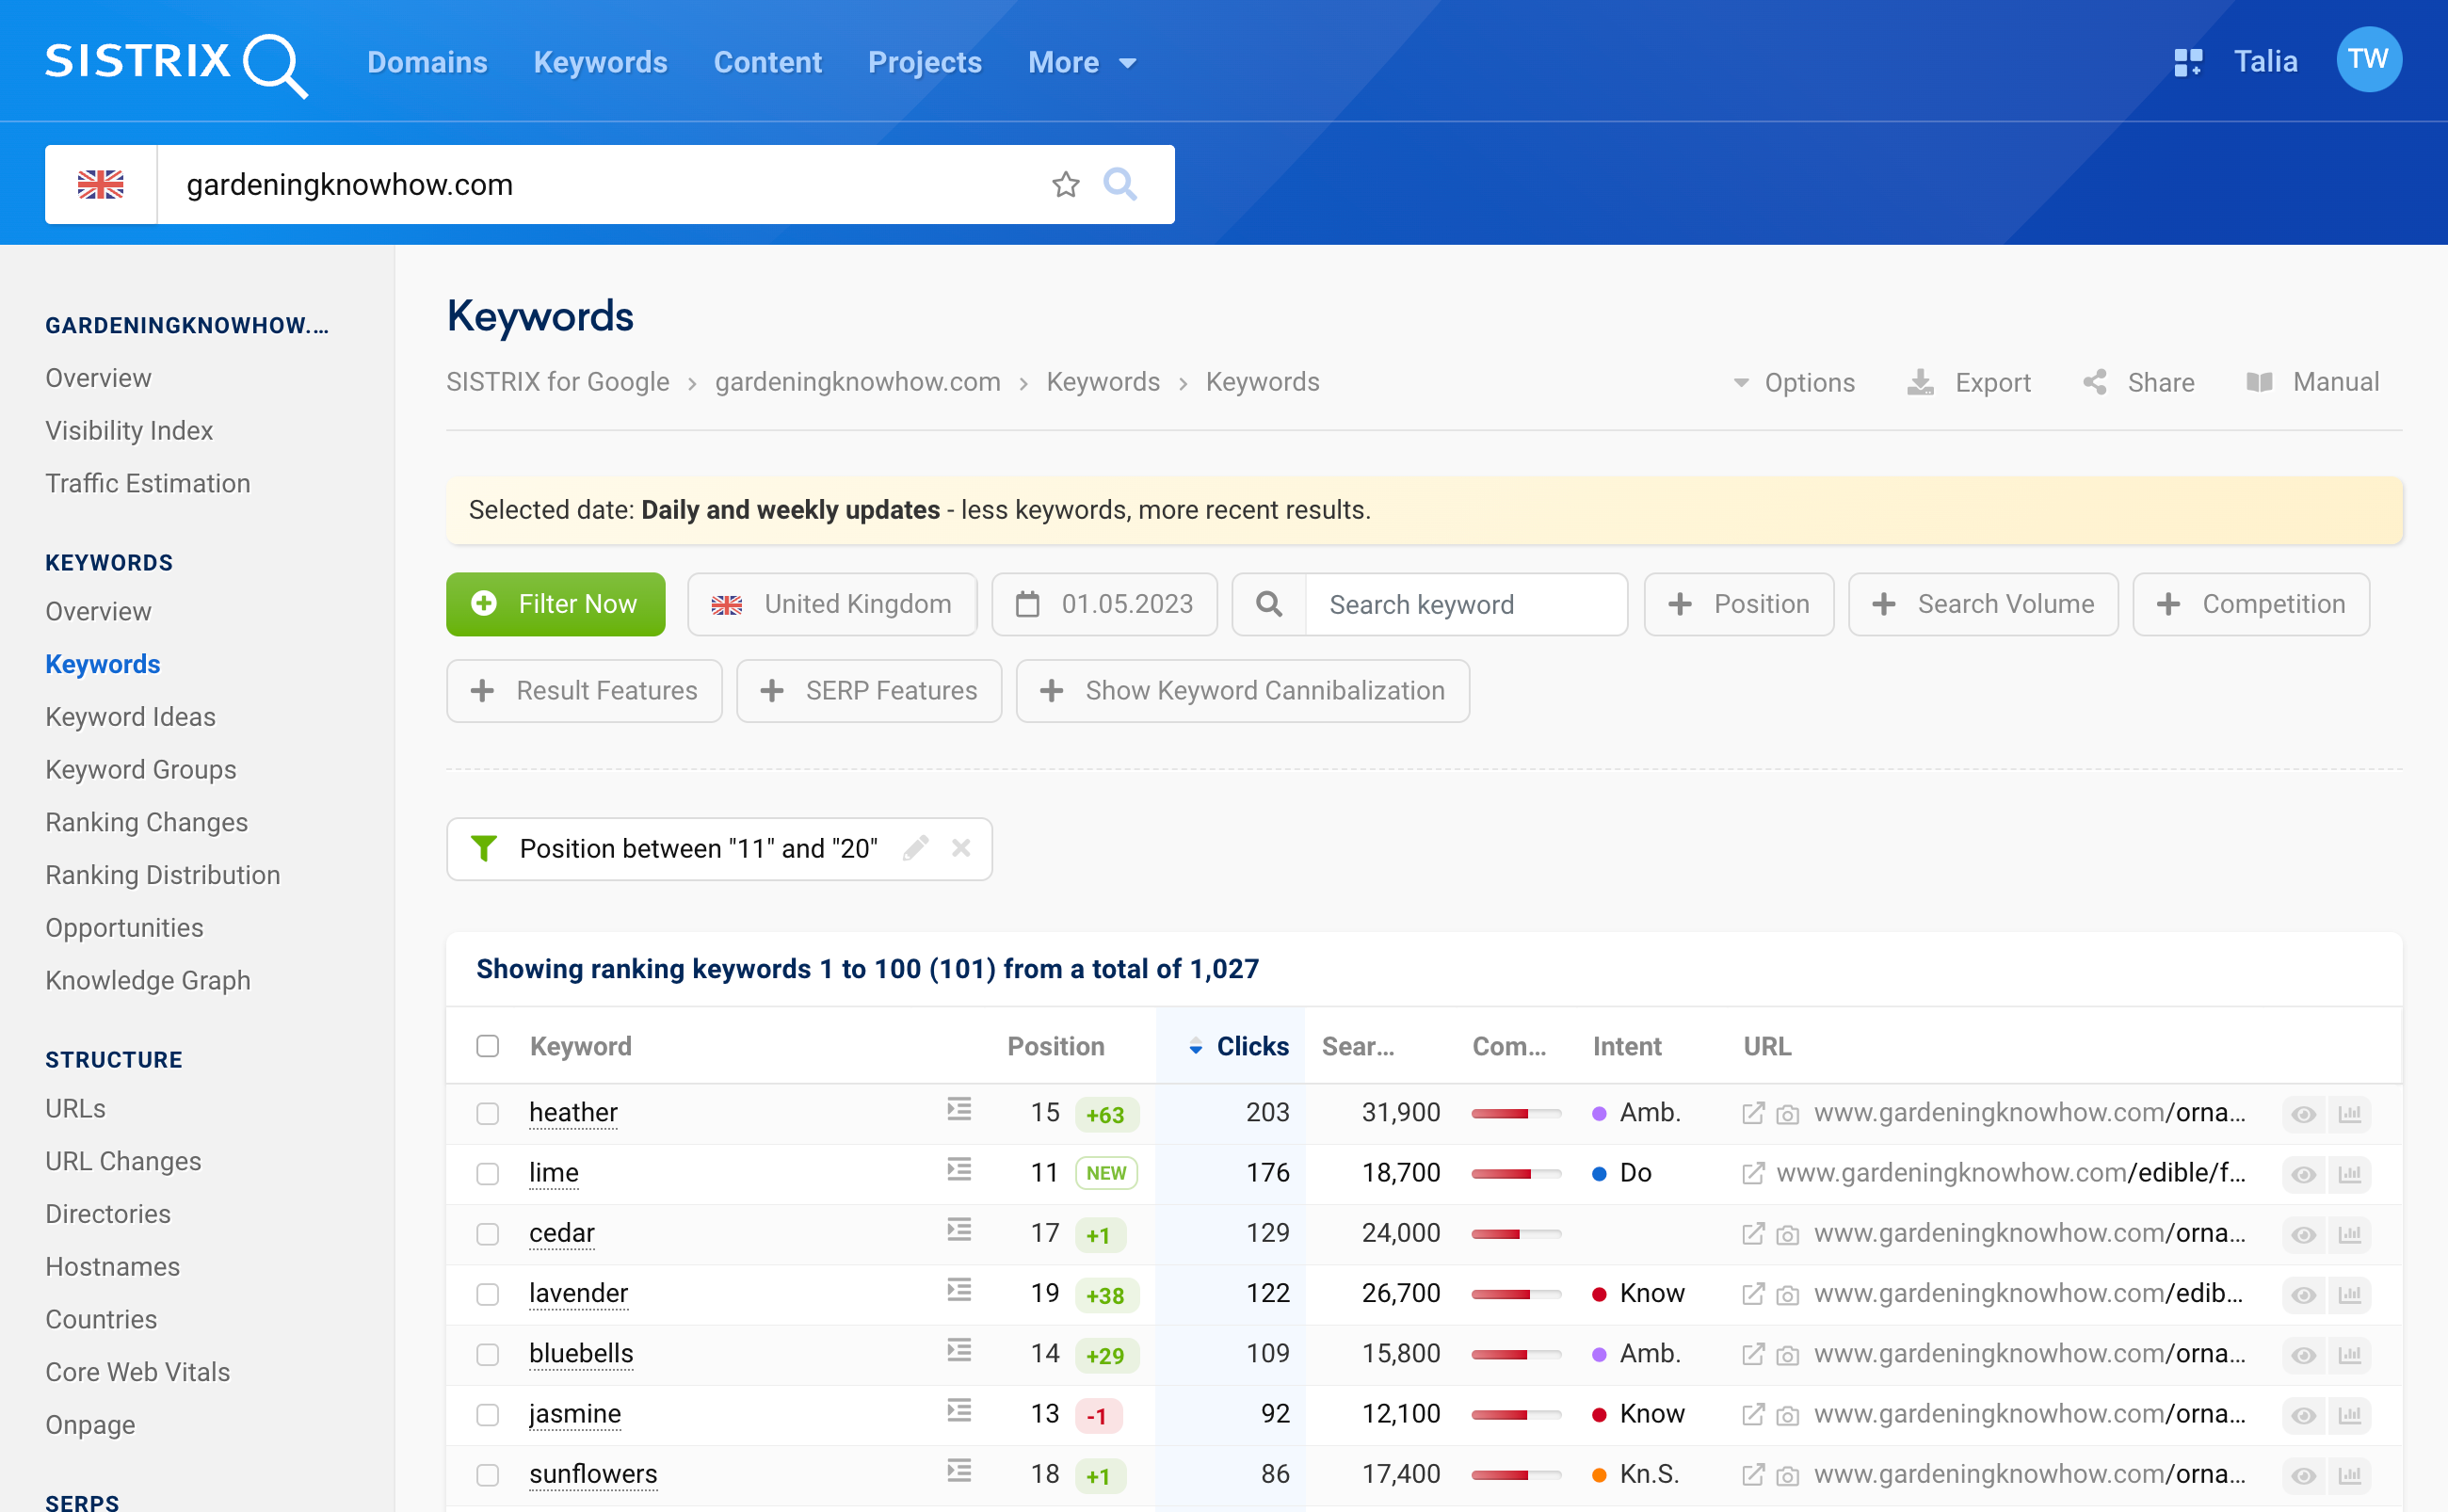
By clicking on the bar for page 2, SISTRIX automatically opens the keyword overview for all rankings on page 2 1 for the desired week 2 (the date set with the slider).
You can now take a closer look at these keywords, optimise the respective pages and thus improve your rankings. You will find everything you need to know about content optimisation in a separate tutorial.
Compare domains in a sector to find best practices and opportunities
In SEO, it is essential to know the competitors in one’s sector. By evaluating the successful directories of those competitors, you can identify which types of content formats work for that sector and which ones you might want to try out in your own strategy.
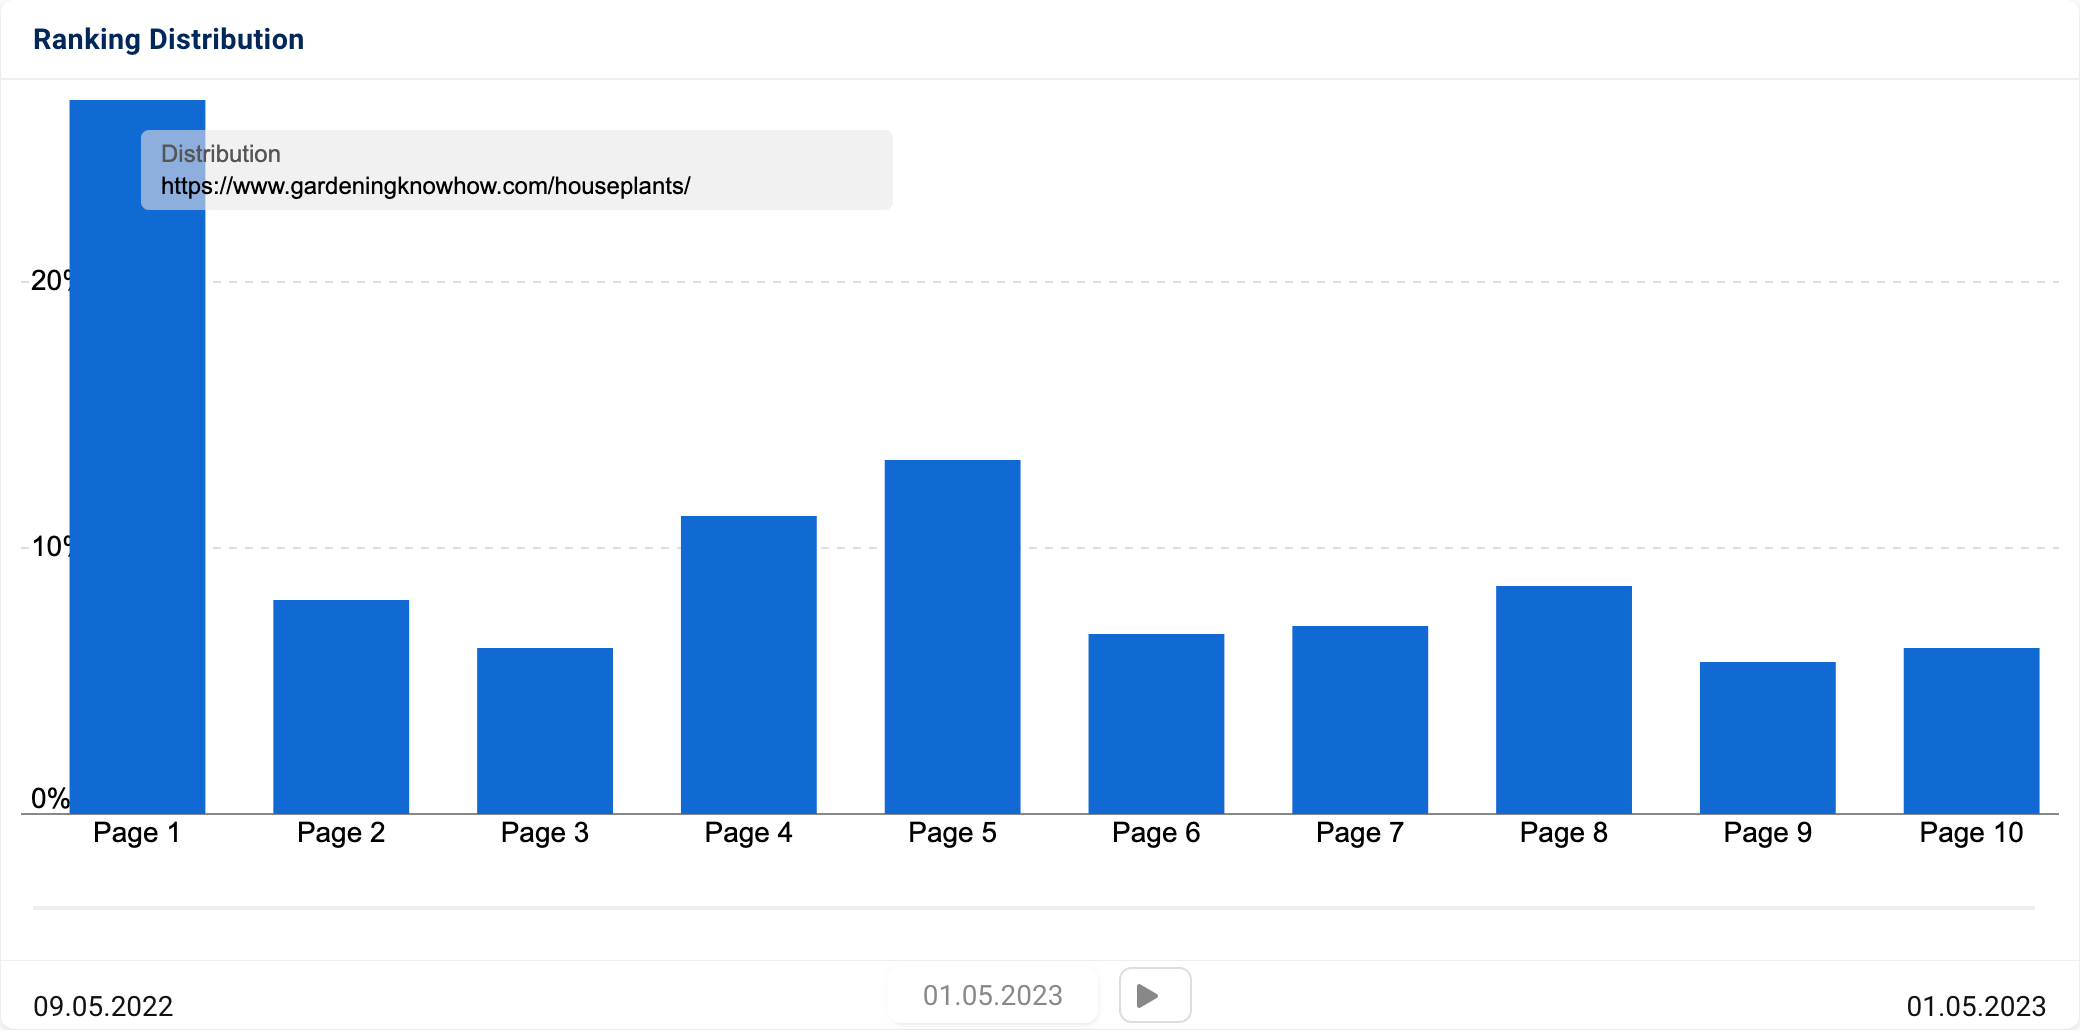
The /houseplants/ directory on gardeningknowhow.com manages to achieve almost 30% of the rankings on the first results page. This is already a very good distribution. However, when we look at the /flowers-plants-shrubs/ directory on thompson-morgan.com, we see a different picture.
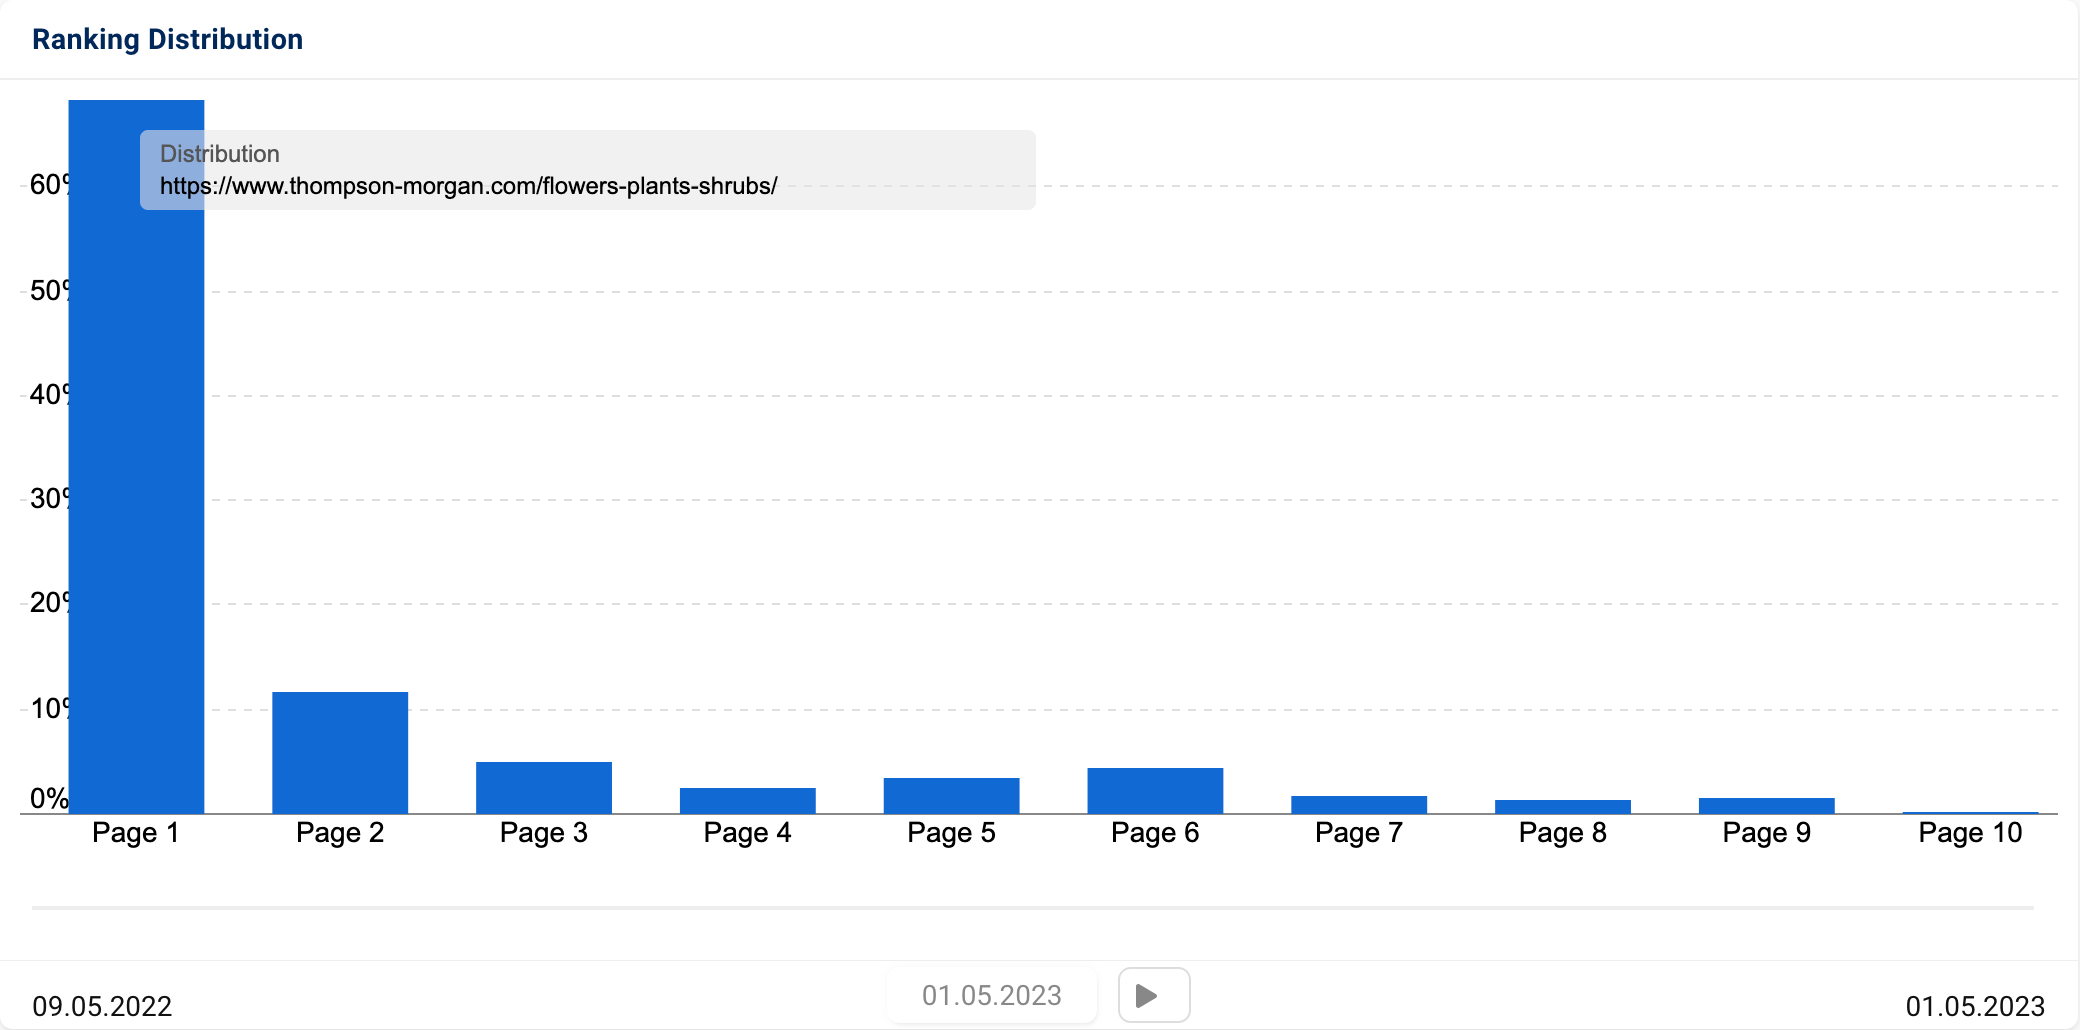
Not only does thompson-morgan.com manage to achieve over 68% of the rankings on the first Google results page and have very few “low hanging fruits” – the absolute volume of keywords is also much higher. There are around 320 rankings in the top 10, compared to only around 100 for gardeningknowhow.com.
This sort of information could be useful in assessing potential customers for an SEO agency, or for pitching new projects.
In separate tutorials, you will find out more about competitor analysis and how you can find new keywords based on your competitors.
View the development of a domain during an SEO project
It’s easy to see SEO success when it’s presented in a simple form. The animated graphical development of a domain during an SEO project is something customers may find useful to see how ranking increase over time.
The GIF below shows a steady improvement in absolute values over a 4-month period, for example.
Tip: Use a capture tool, such as LICEcap, to record the playback into a shareable GIF.
The truth doesn’t always lie on the surface
When analysing a domain, please always consider which different types of content belong to the domain – such as news, events, forums, shops or guides. These different formats may have different distribution graphs.
Therefore, it makes sense to analyse the different types individually (in a directory-level analysis, for example). Only then can a larger domain be analysed in a meaningful way.