

With the Social-Signals module in the Toolbox, we have now surpassed the threshold of 100 billion evaluated social signals. This is a good opportunity for a deeper analysis of the data. We monitor interactions on the following networks: Twitter, Facebook, Google+, LinkedIn, and Pinterest. Let’s start with the analysis of the share that these networks actually have of the sum of all measured socials signals:
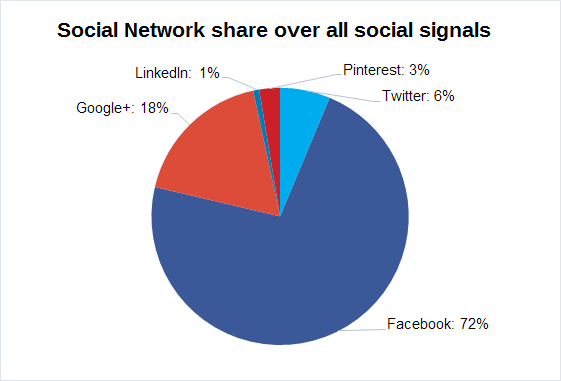
Unsurprisingly Facebook has a huge lead. Almost three quarters of all signals found have been for Facebook. This is a remarkable market share, especially in light of the background that, in our experience, Facebook is especially adept at rapidly removing fake likes, comments, and shares. Google+ follows in second place with 18%. Even though, at first glance, these numbers do not match the regular reports of the ghost town that Google+ is supposed to be, there is an explanation for this: while the other networks only measure actual interactions of the user with a URL, Google is apparently a bit more relaxed on the subject and considers everything that could even slightly be interpreted as “showing an interest” to be a +1. This is especially noticeable for homepages. Spiegel Online only has 54,885 likes for the homepage, but 542,418 Google+ interactions – starkly disproportionate to all other interactions, as can also be seen in the following chart. In third place we have Twitter with 6% of all interactions, followed by Pinterest with 3% and LinkedIn with 1%.
In the following analysis, I looked at the percentage of social signals that went to sub-pages of a domain and those directed at the domain’s homepage:
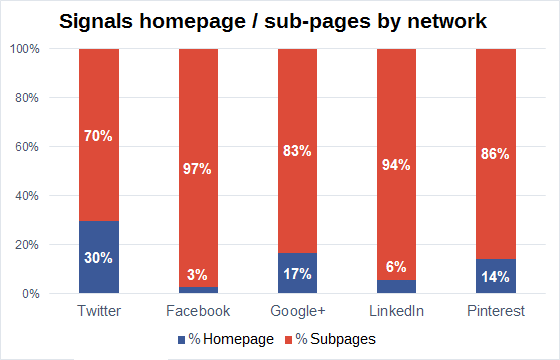
We can quickly make out a dichotomy here: both Facebook, as the biggest, and LinkedIn, as the smallest network in numbers, show a strong use of sub-pages. I could imagine that this reflects how real humans interact with content: the interesting, share-worthy content is normally a rare find on the domain’s homepage. With Pinterest, Google+, and especially Twitter, the numbers strongly differ from this assumption. Especially on Twitter we can see that tweets which are obviously created by bot-networks are included in the official tweet figures of a URL, without being filtered out, and that there is no effective quality control.
In the next table, I will have a look at the usage of the networks in five large European countries. I decided to show the information in table form, as a diagram can quickly become confusing when it uses such a large amount of data:
| FR | IT | DE | UK | ES | |
|---|---|---|---|---|---|
| 88,0% | 87,4% | 87,1% | 66,9% | 65,3% | |
| Google+ | 7,5% | 9,9% | 9,6% | 18,1% | 24,4% |
| 3,3% | 2,2% | 2,4% | 12,3% | 9,3% | |
| 0,5% | 0,3% | 0,6% | 0,5% | 0,4% | |
| 0,8% | 0,3% | 0,2% | 2,2% | 0,6% |
France, Italy, and Germany are Facebook countries: an almost identical Facebook share in these three countries stands against a far less frequent Facebook use in the United Kingdom and Spain, where Twitter and Google+ are a lot more represented.
Seeing how the official German labour standards only allow for a maximum of three data filled pieces of information at temperatures above 35°C, I will have to stop for now and show you the rest of the data tomorrow. Then, we will talk about domains and the data that stood out the most.