Search Engine Optimisation
The Gold Standard of SEO Success Measurements
Since 2008 the SISTRIX Visibility Index has been the standard for measuring SEO results. We analyse many millions of Google search results on a daily basis and prepare easy-to-understand data in Europe’s biggest database.
From the inventor of the Visibility Index – SEO results made transparent
The SISTRIX Visibility Index is your ever-reliable yardstick for SEO success. In 2008 we invented the Visibility Index to bring transparency to the black box of Google rankings.
Built in a base of 100 million data points, we recalculate how successfully a page ranks in Google, every single day – for more than 100 million domains and in 34 countries.
Differences exposed through comparison – are you better than your competitor?
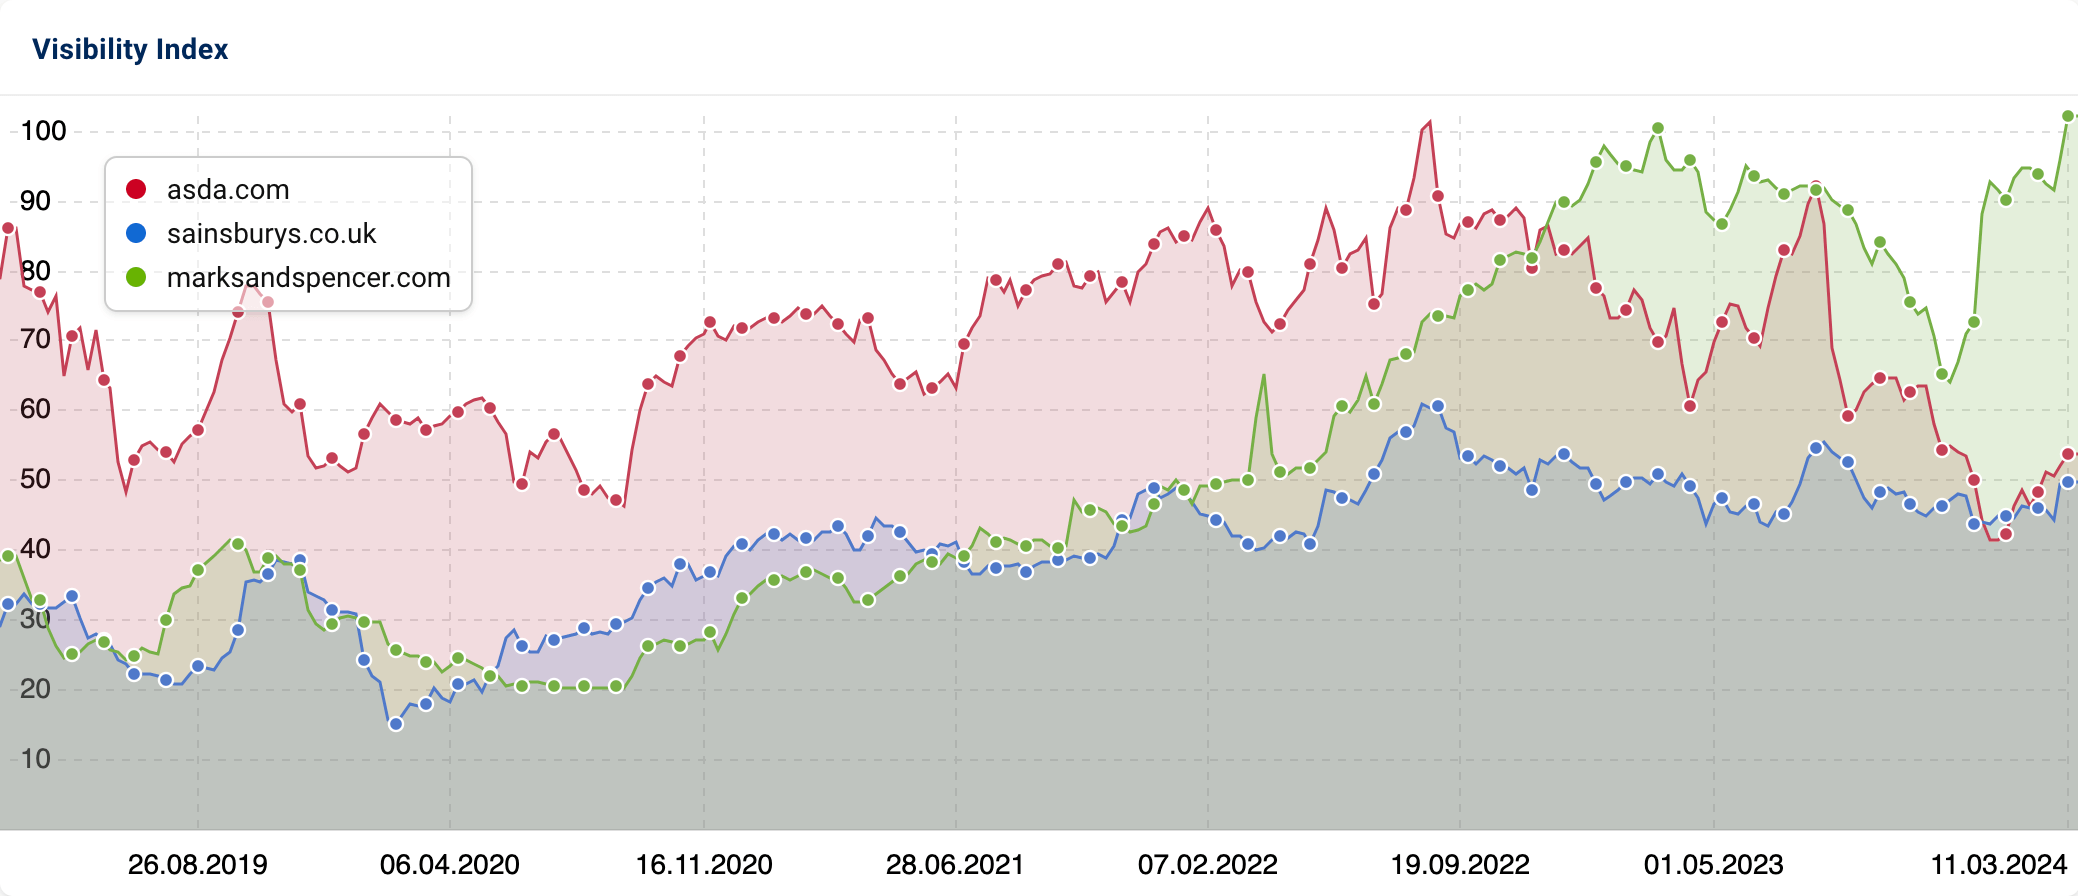
It’s patently obvious in the Google search results – your biggest competitor is just a click away. With the Visibility Index, you can assess how successful your competitor is at the push of a button.
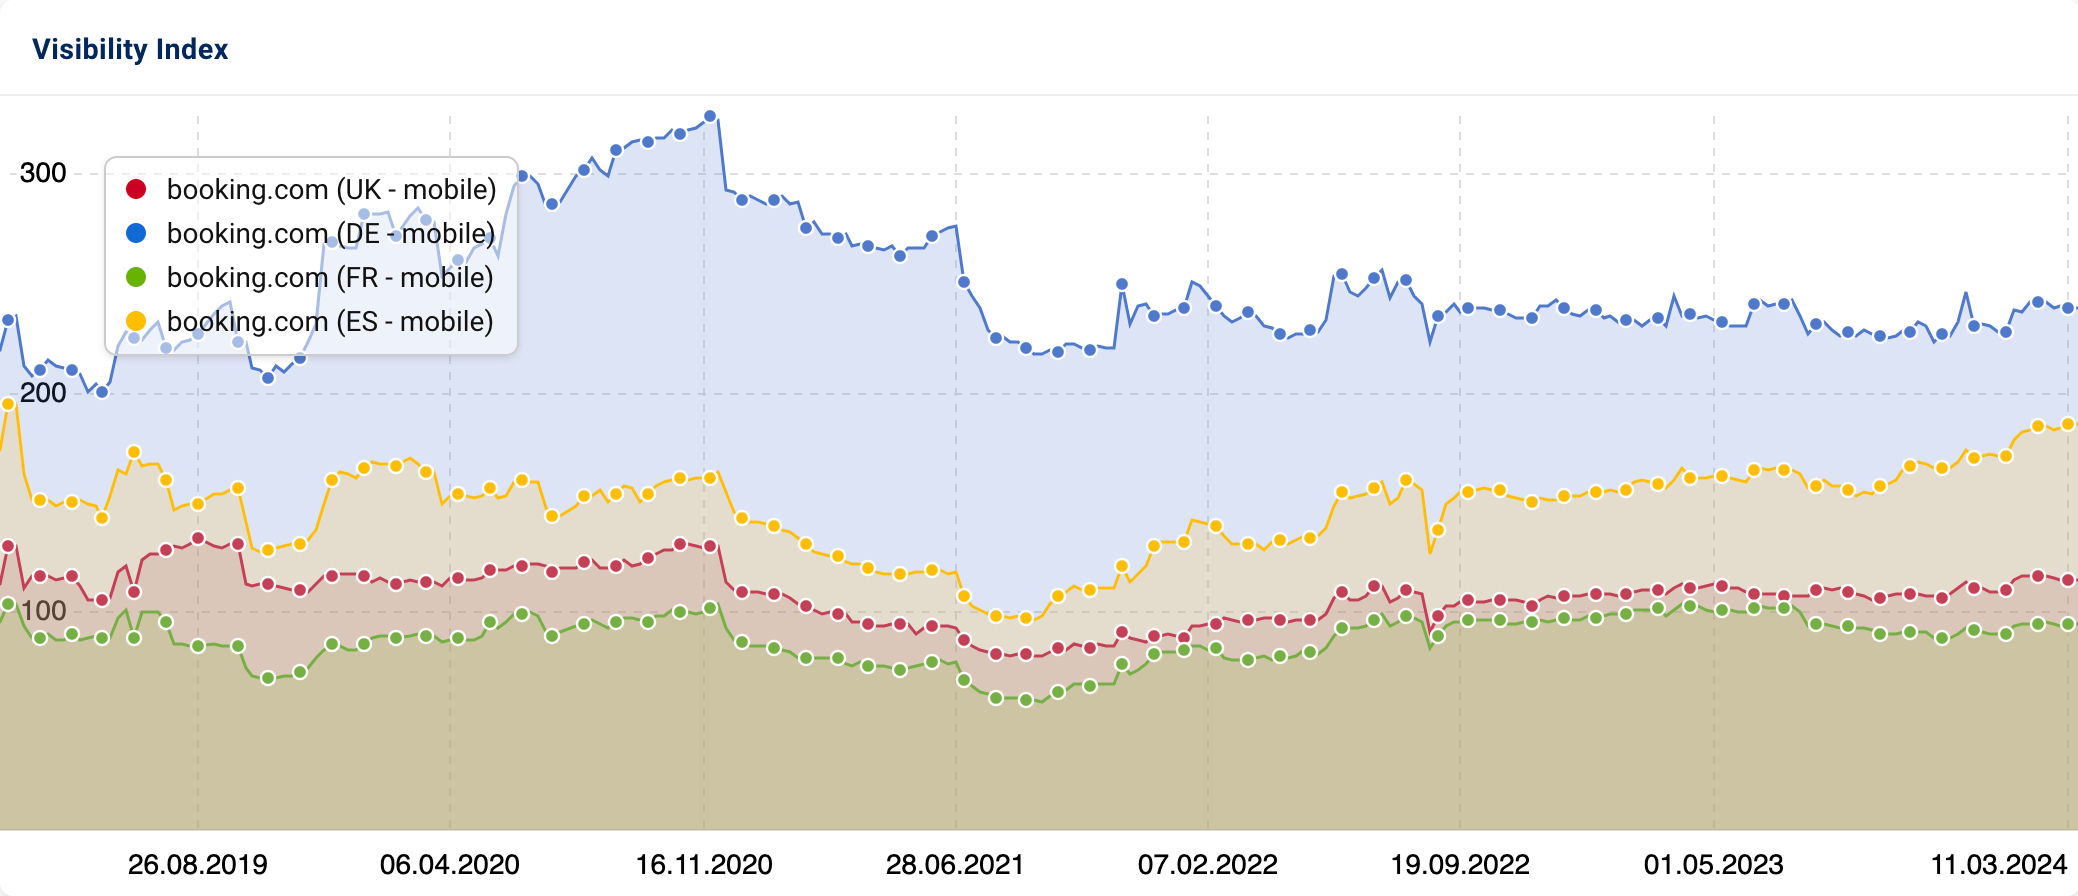
- Graphically compare up to 6 domains
- Cross country and language borders
- Historical data for all domains
When last week isn’t good enough – Your daily Visibility Index
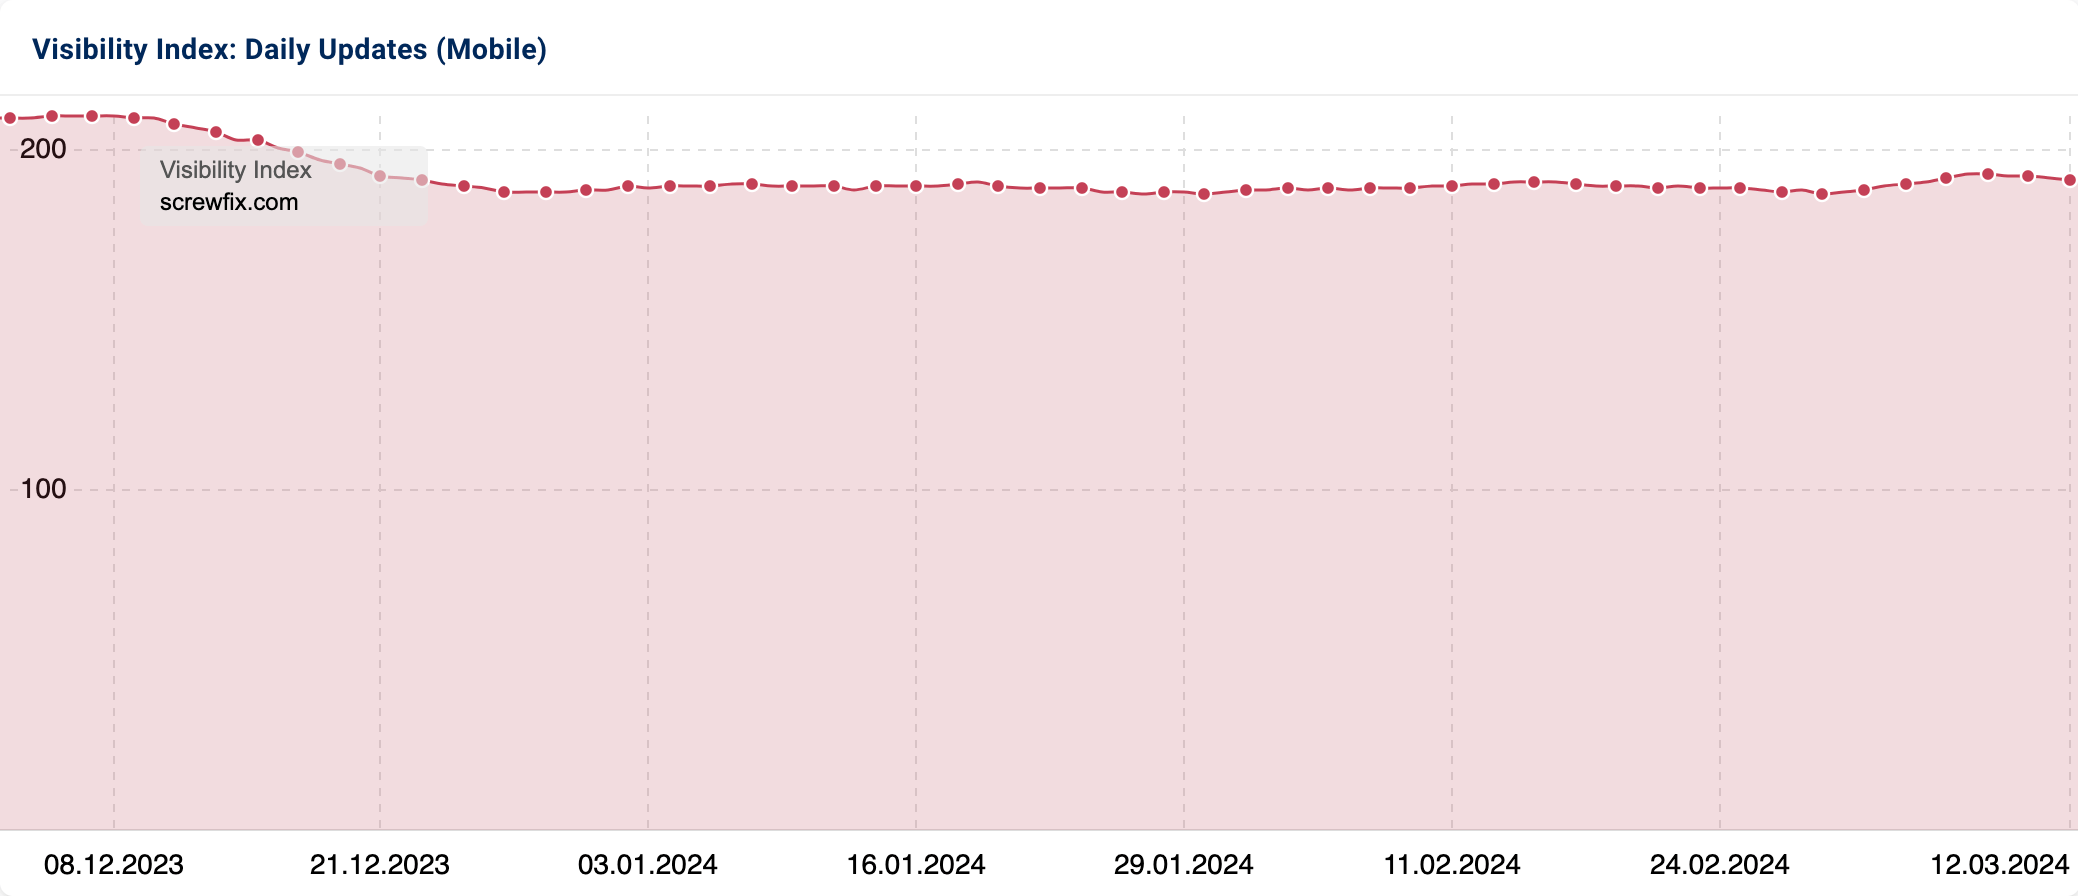
Only available from SISTRIX – with the daily Visibility Index you are always up-to-date. There’s no longer any need to wait until the following week to see the effects of Google updates.
- Visibility Index updated daily
- Spot important changes immediately
- Available for mobile and desktop search results
From domain to URL –
Visibility in detail
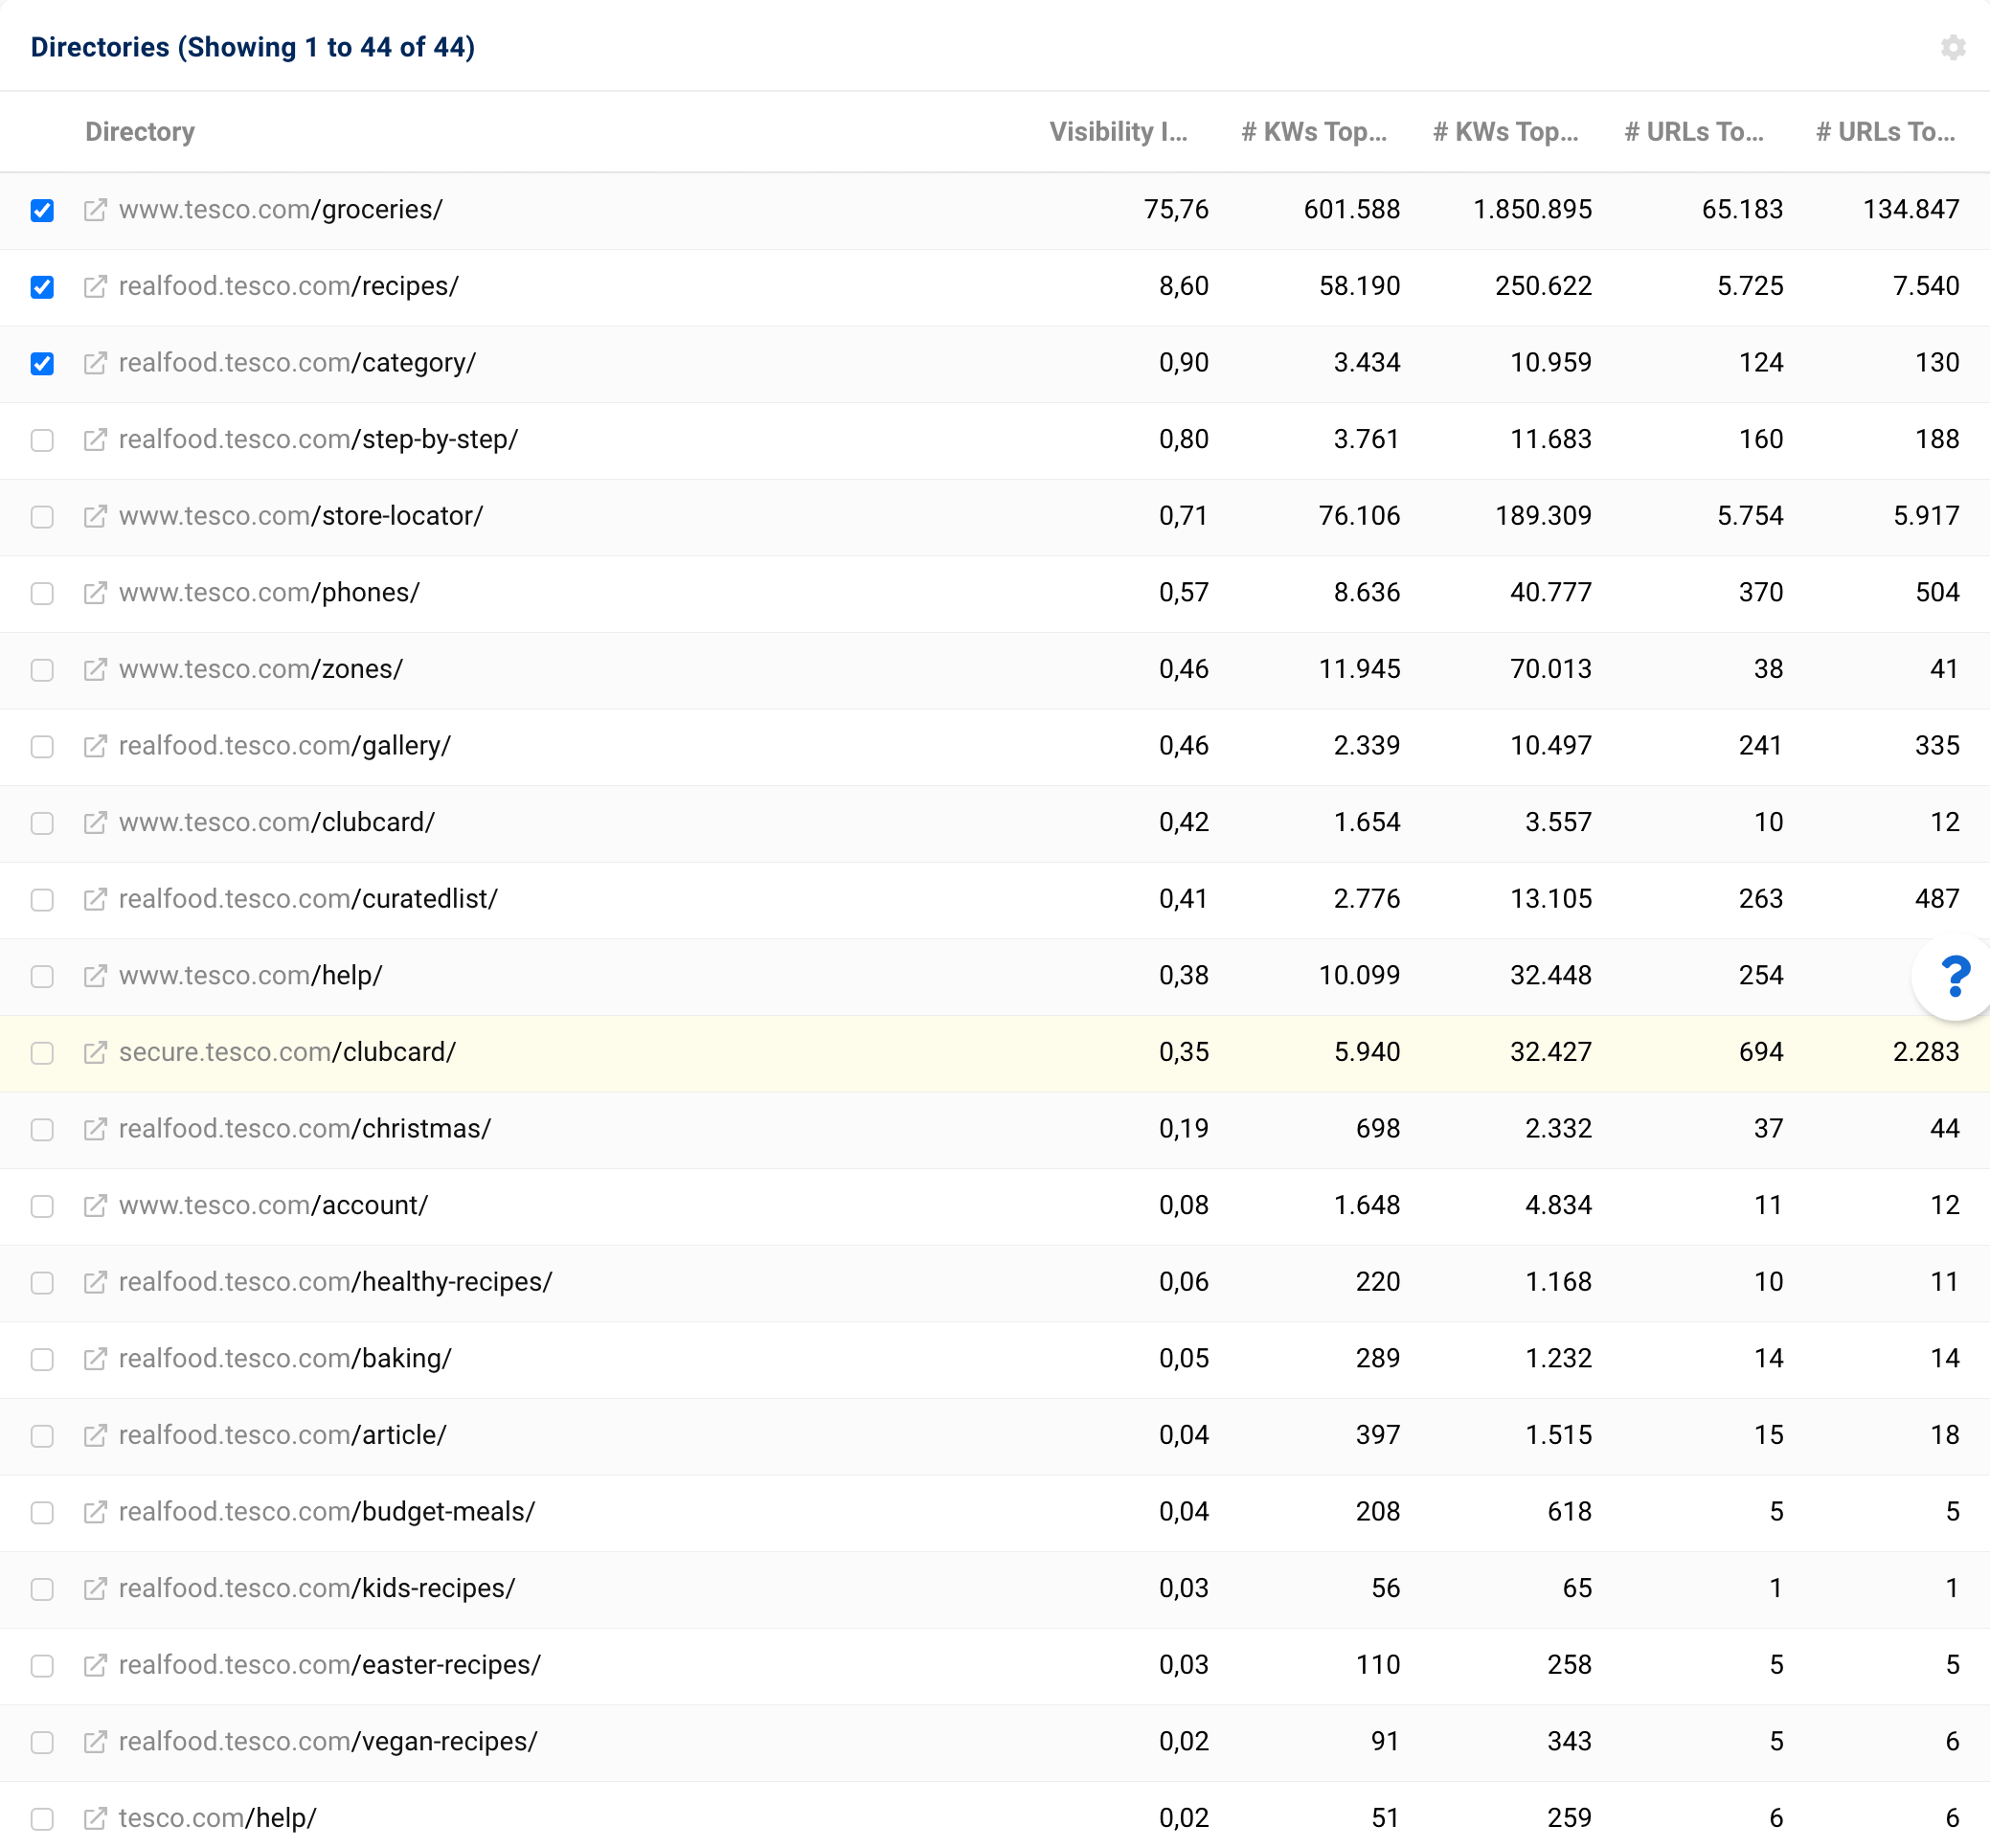
With SISTRIX you can not only analyse the visibility of an entire domain, you can also drill-down into as much detail as you want, from the domain to the individual host names (subdomains) and directories to specific URLs.
Mobile first – We’re ready for the mobile future
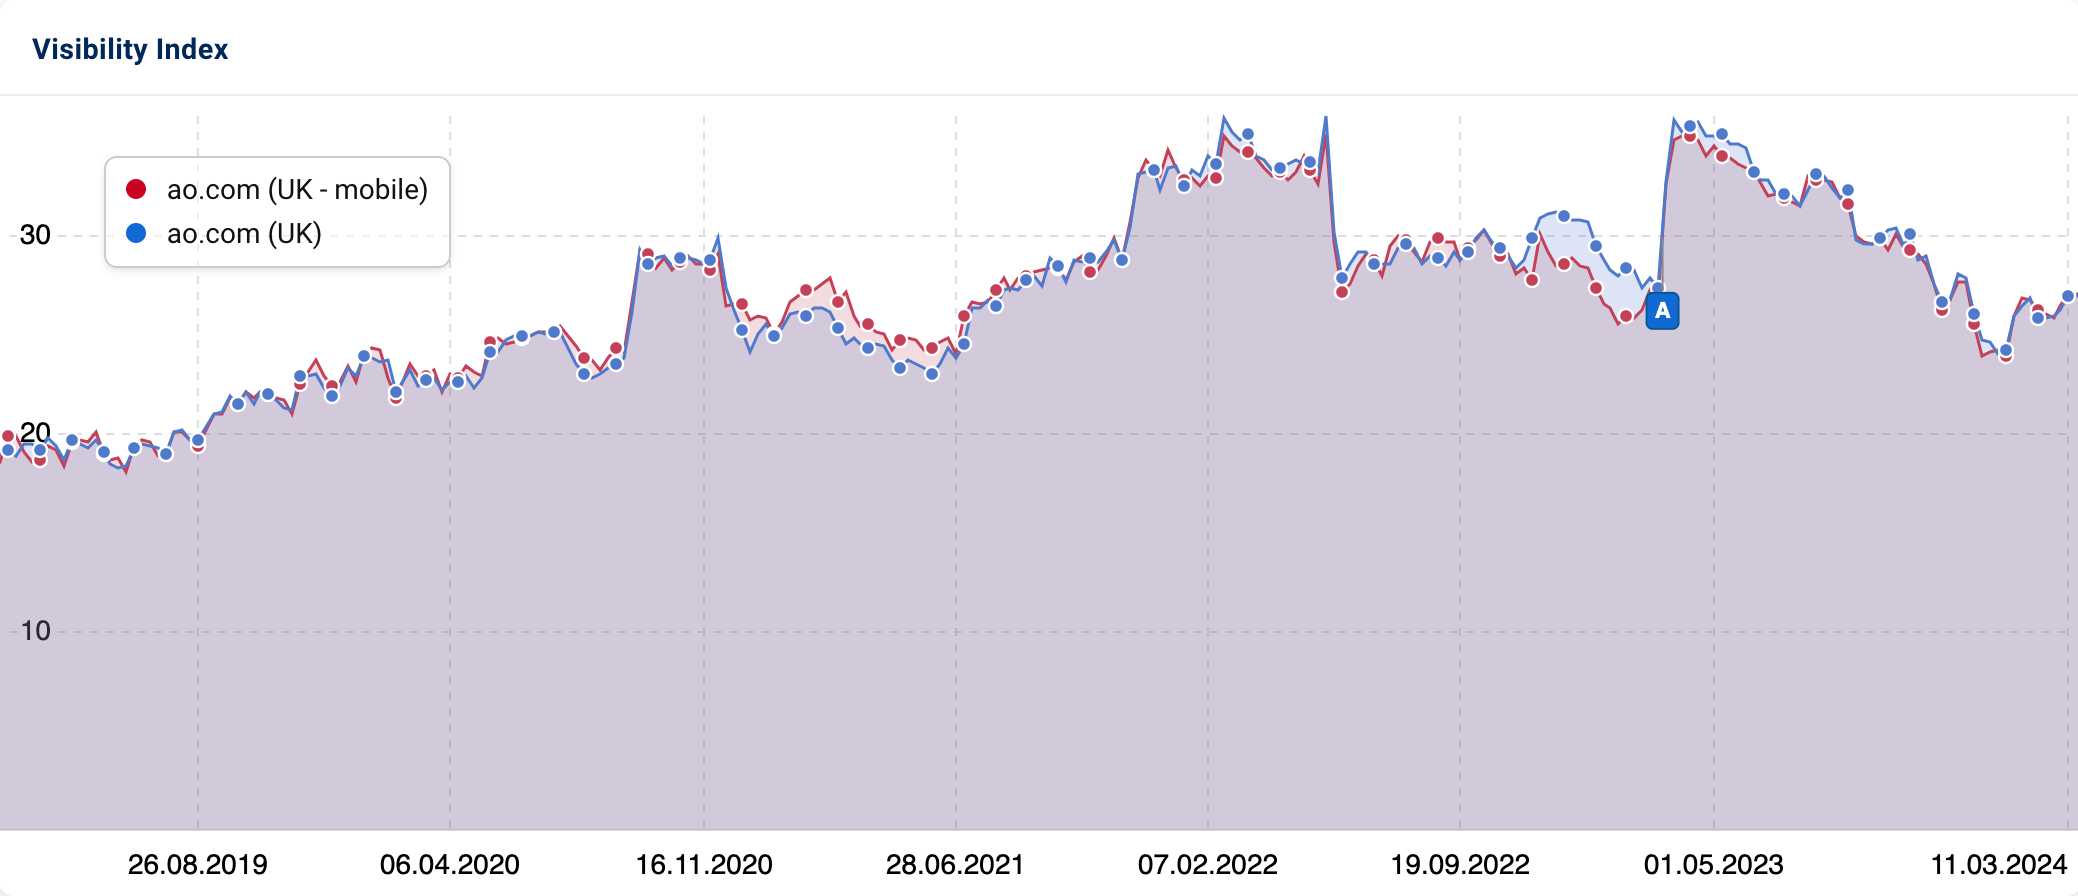
The future belongs to mobile search. With SISTRIX you are with the right partner because we have been building desktop and mobile Visibility Indexes in parallel since 2015. You can immediately compare your desktop with your mobile performance.
Google Updates – See important ranking updates at a glance
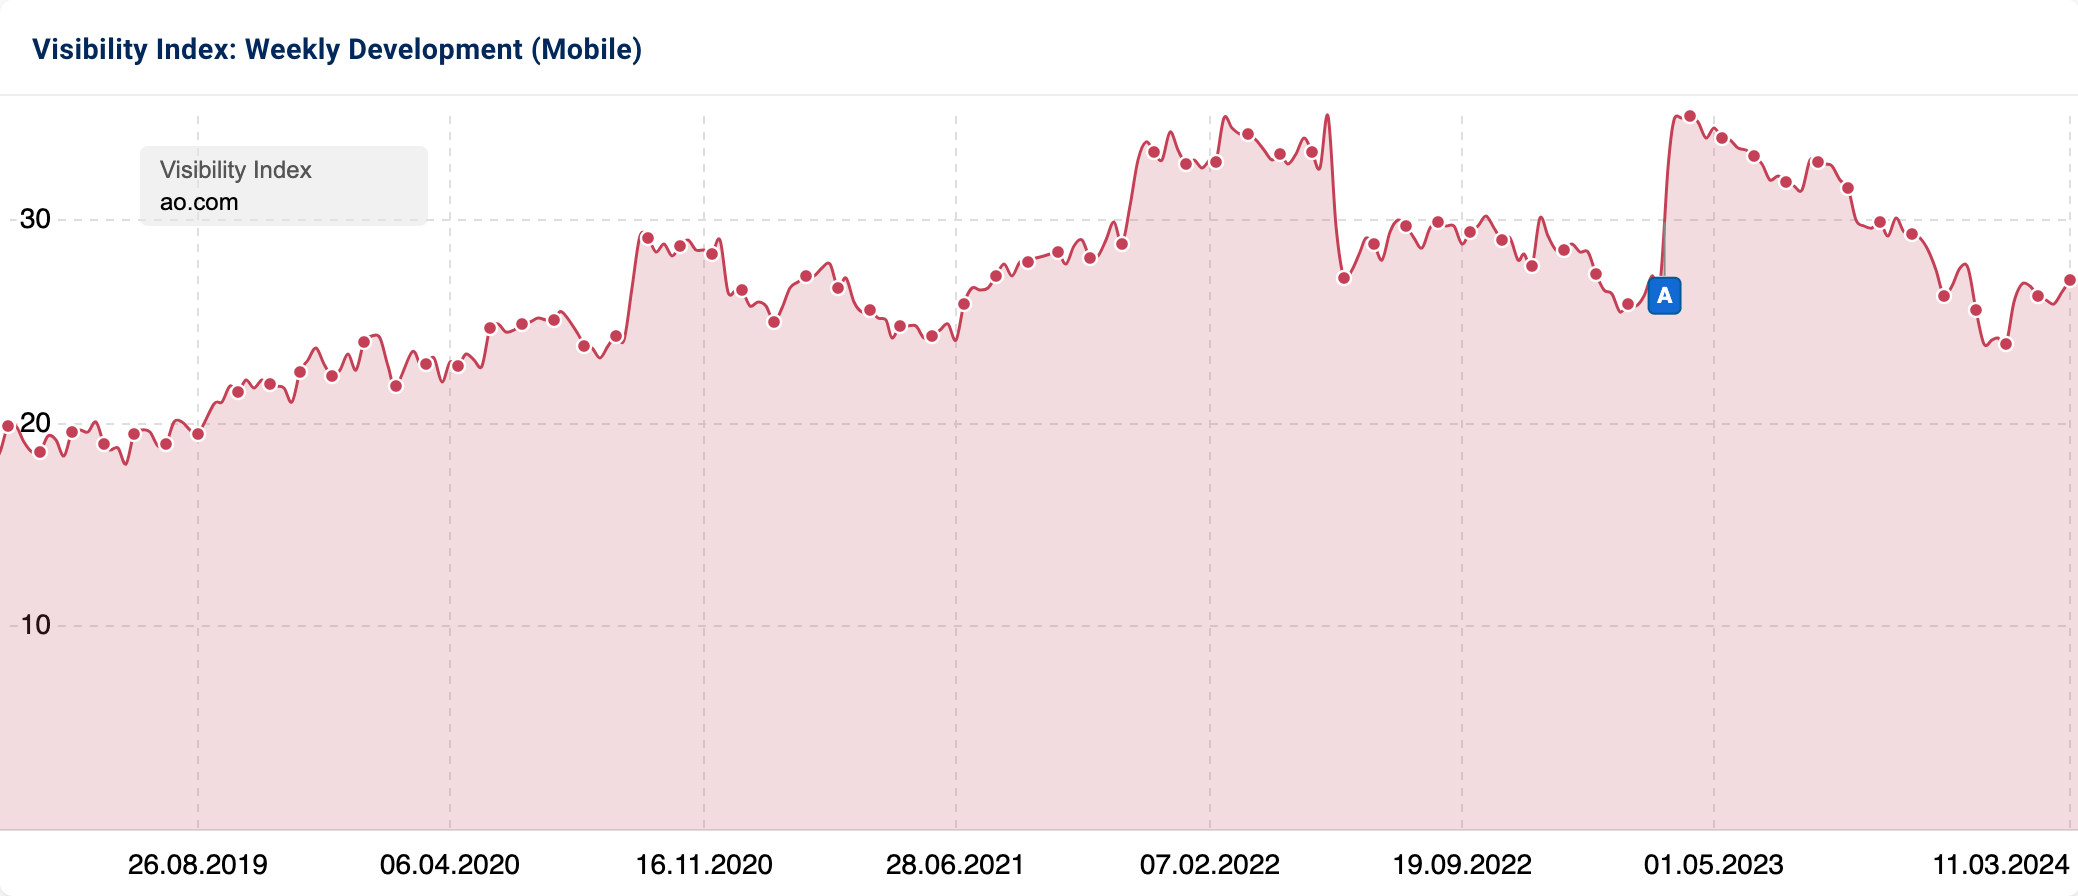
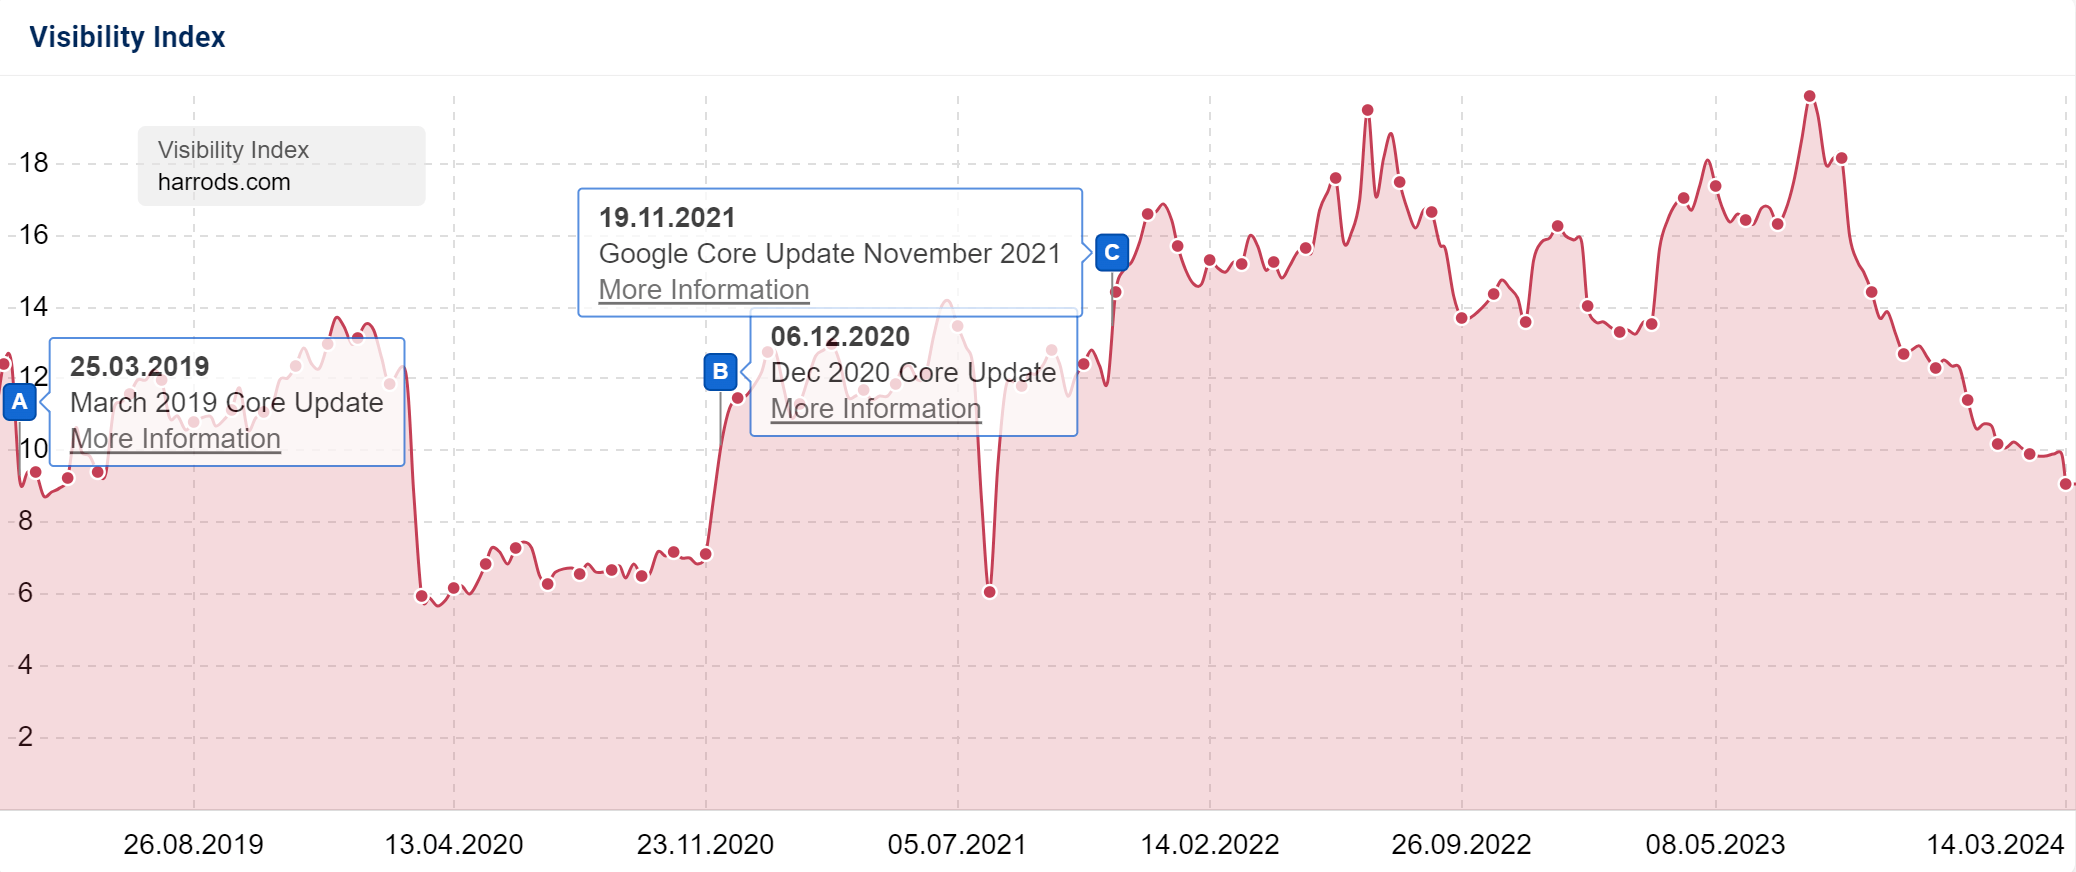
Google Ranking Updates always stir up the search results. Whether it’s the current core updates or the Penguin & Panda updates of the past, with the event pins in the toolbox, important Google updates can be identified and analysed at a glance.
Compare visibility across countries – 40 countries available
We calculate the Visibility Index for 40 countries. You can compare the values of all countries and identify SEO success across borders.
Supported: United Kingdom, Germany, France, Spain, Italy, Holland, Austria, USA, Brazil, Ireland, Portugal, Denmark, Norway, Finland, Greece, Hungary, Slovakia, Czech Republic , Romania, Slovenia, Croatia, Bulgaria, Canada, Australia, Mexico, Peru, Argentina, Colombia, Russia, Japan, Thailand, Vietnam, Indonesia, India, South Africa.
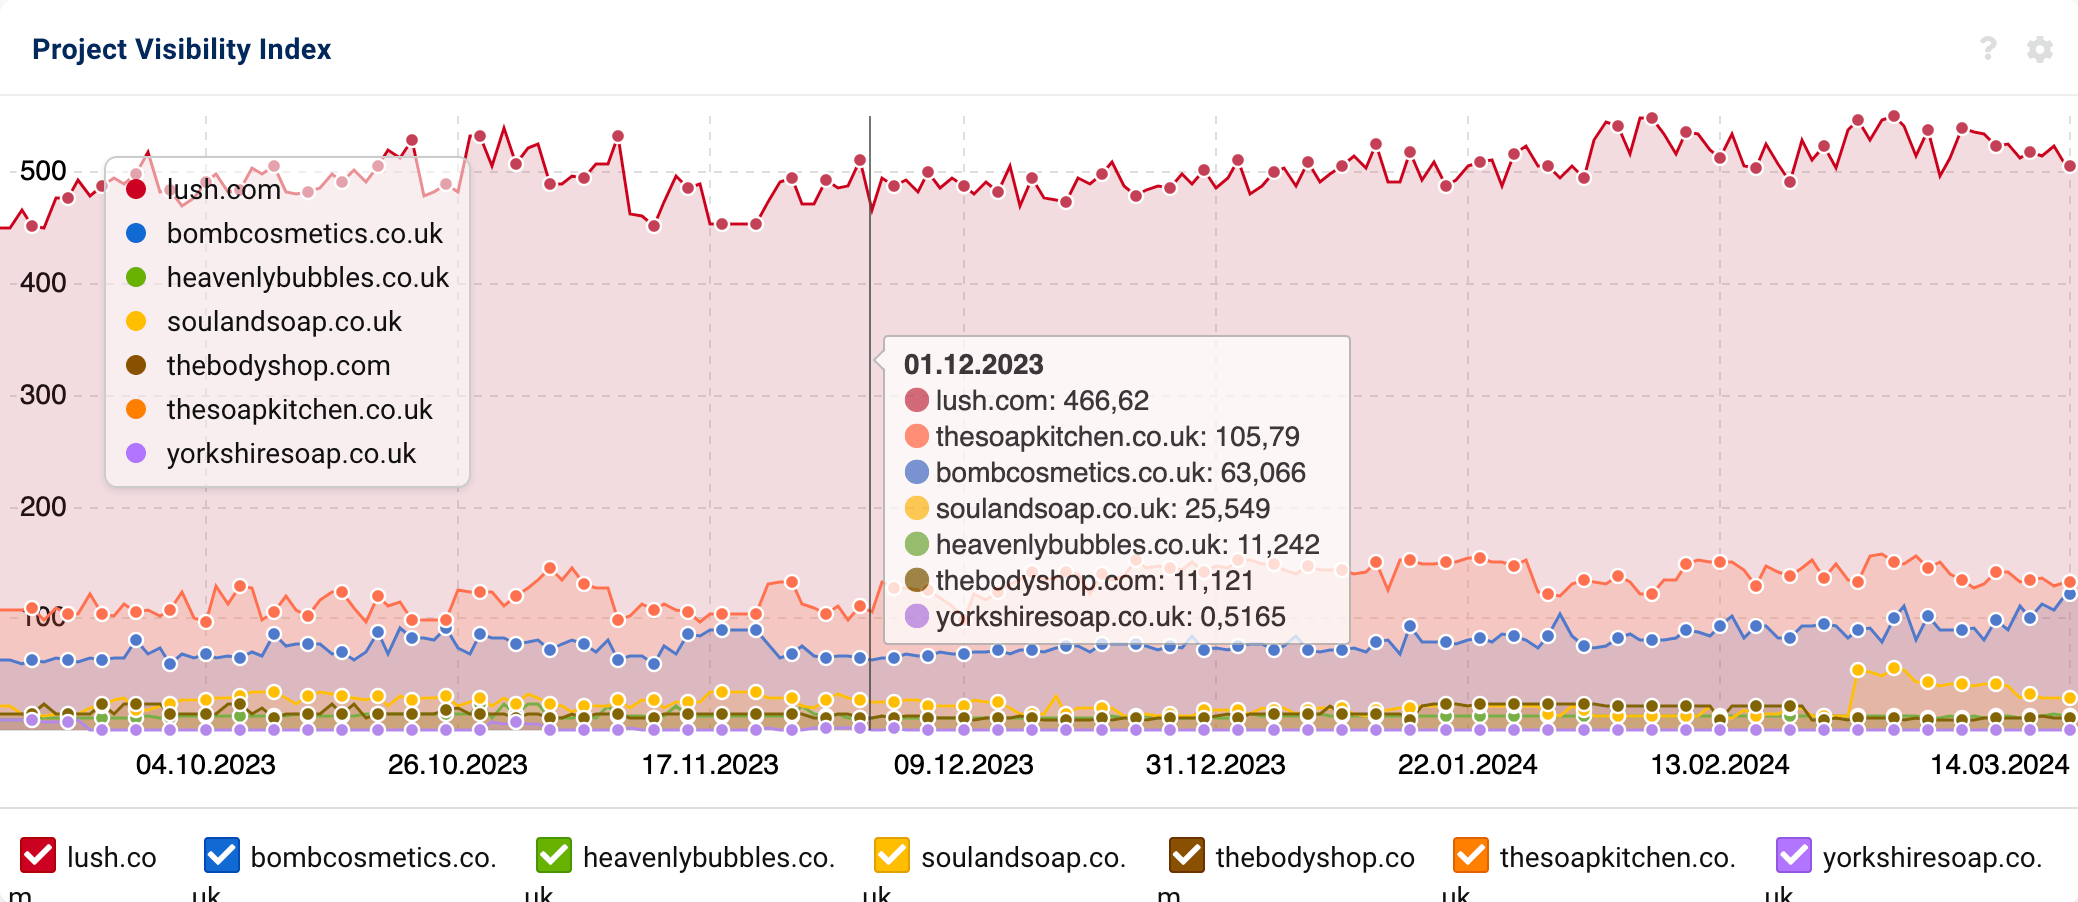
Your own Visibility Index – Create a project with your own keywords
To determine the visibility for very small niches and special topics, you can create your own project Visibility Index based on keywords that you have selected. Updated daily for more than 200 countries and languages.
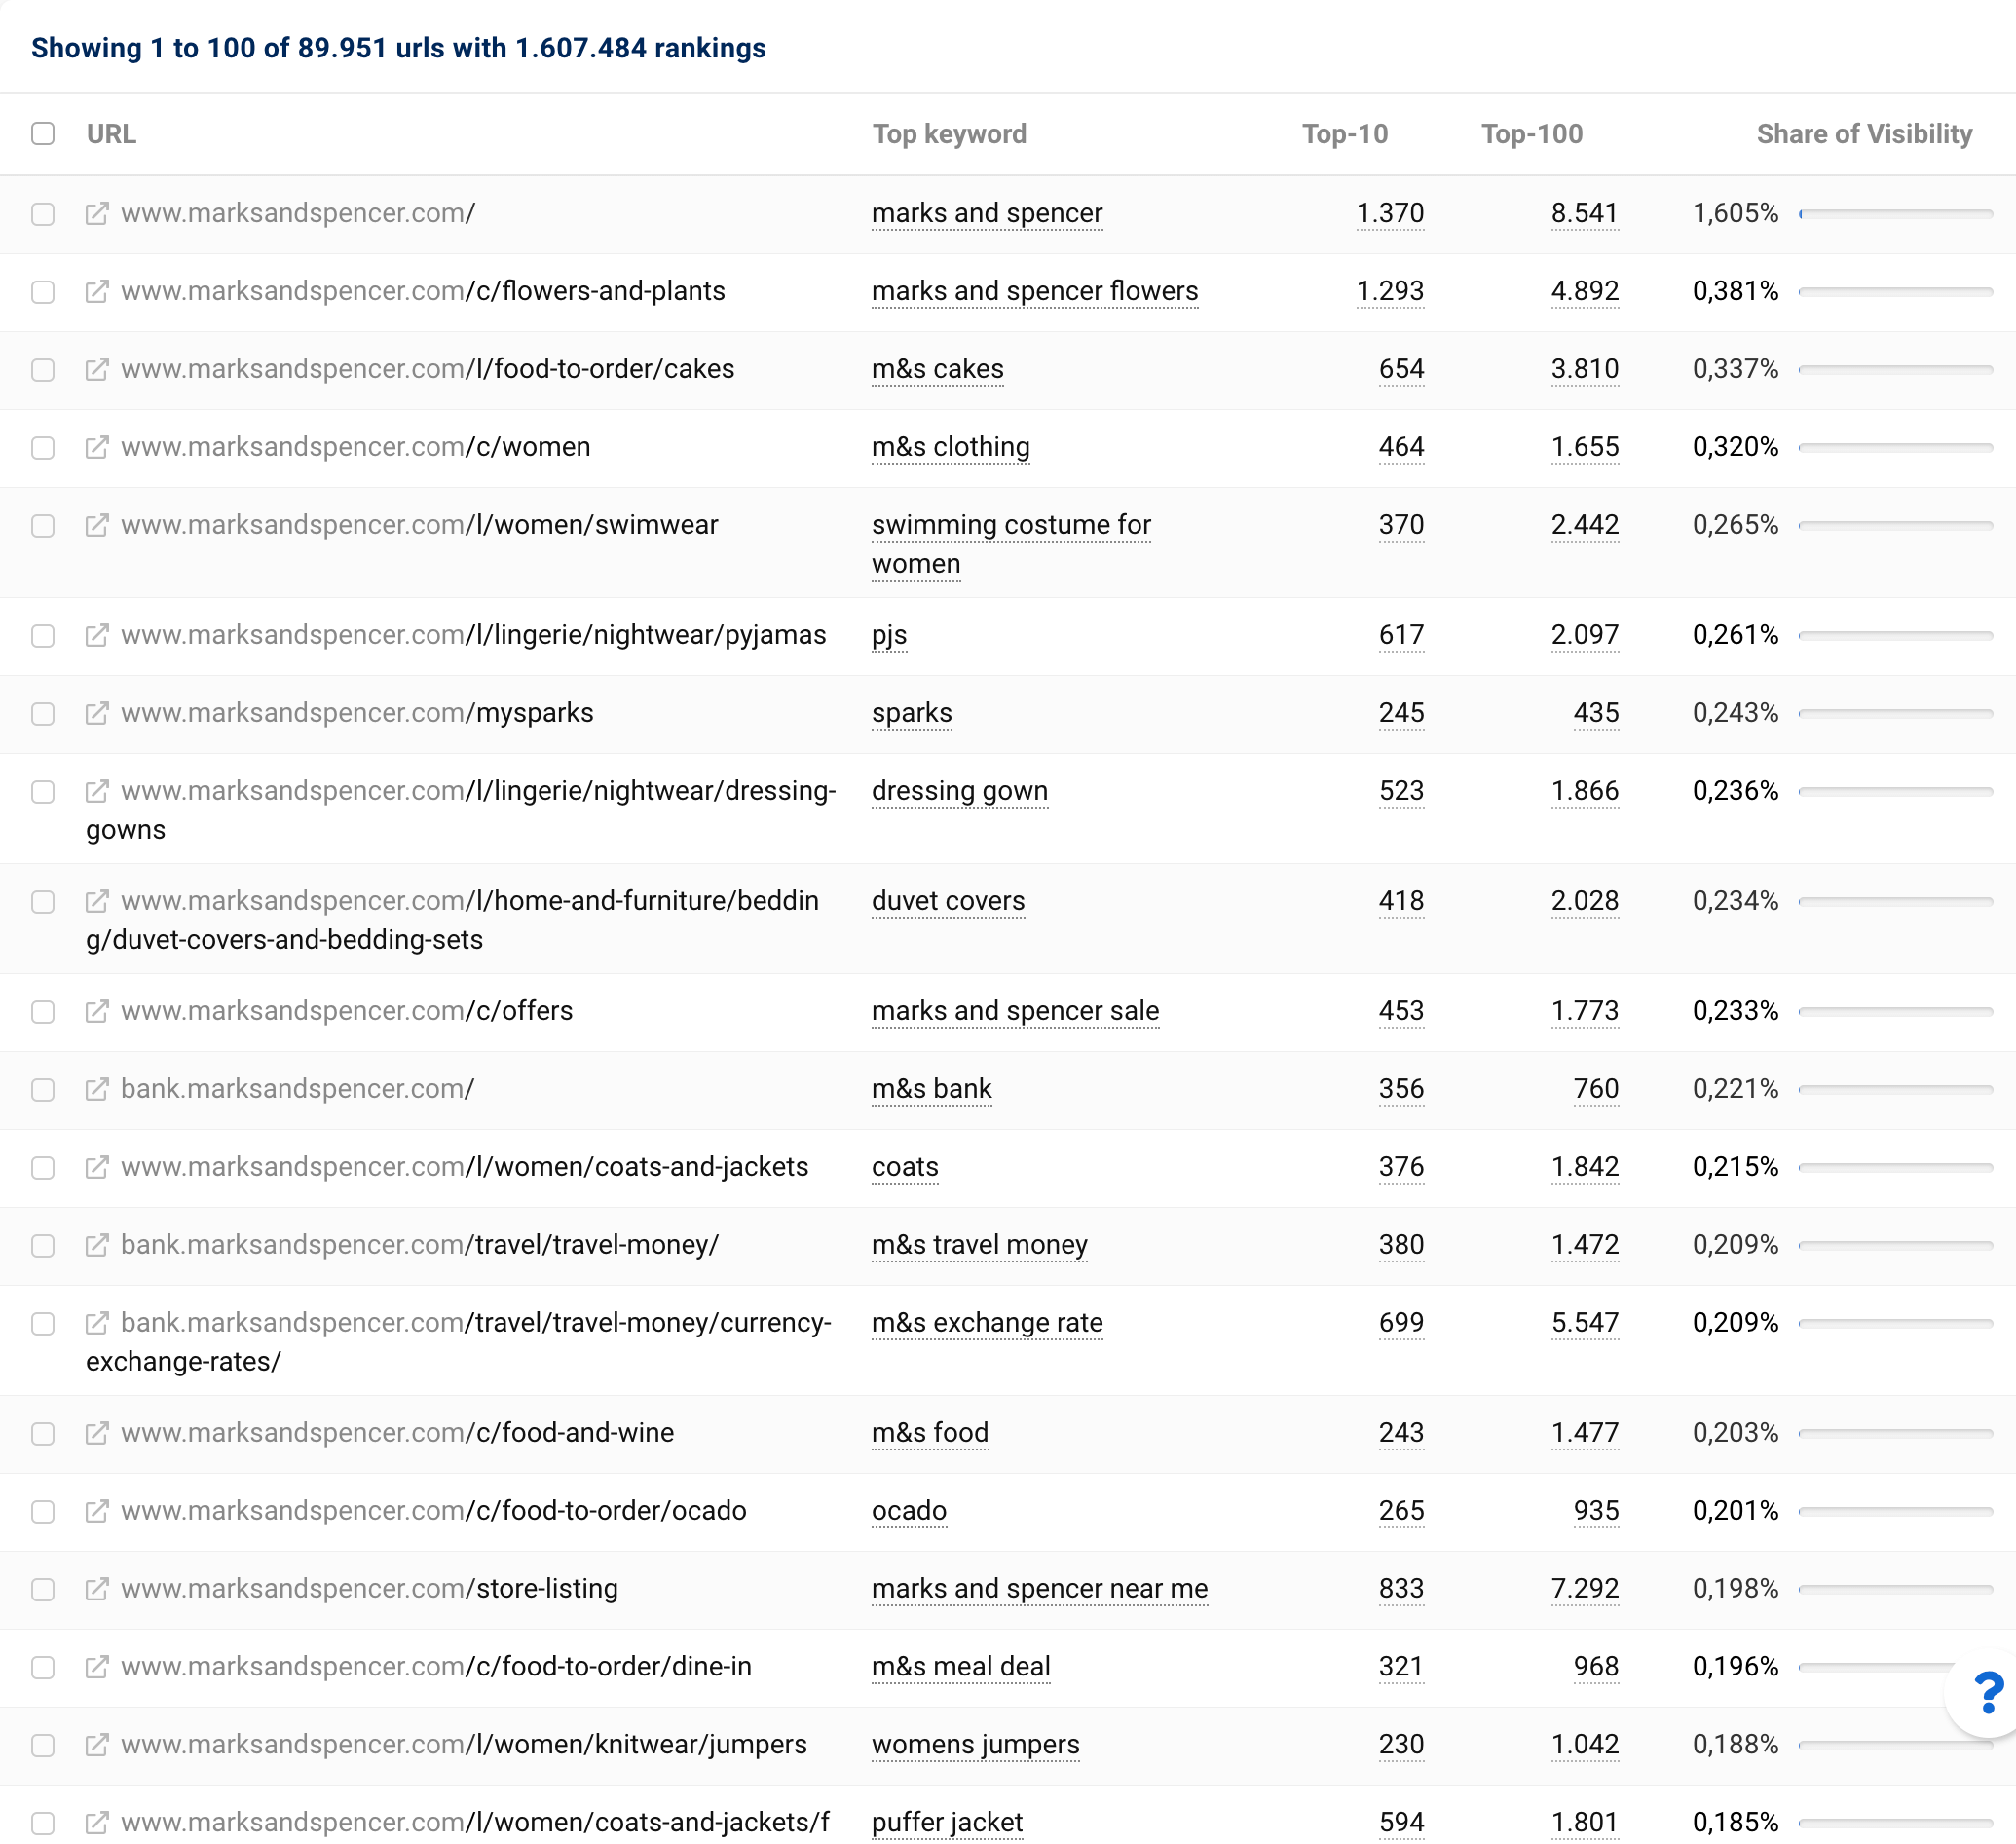
Not all content is equally successful – Discover content highlights
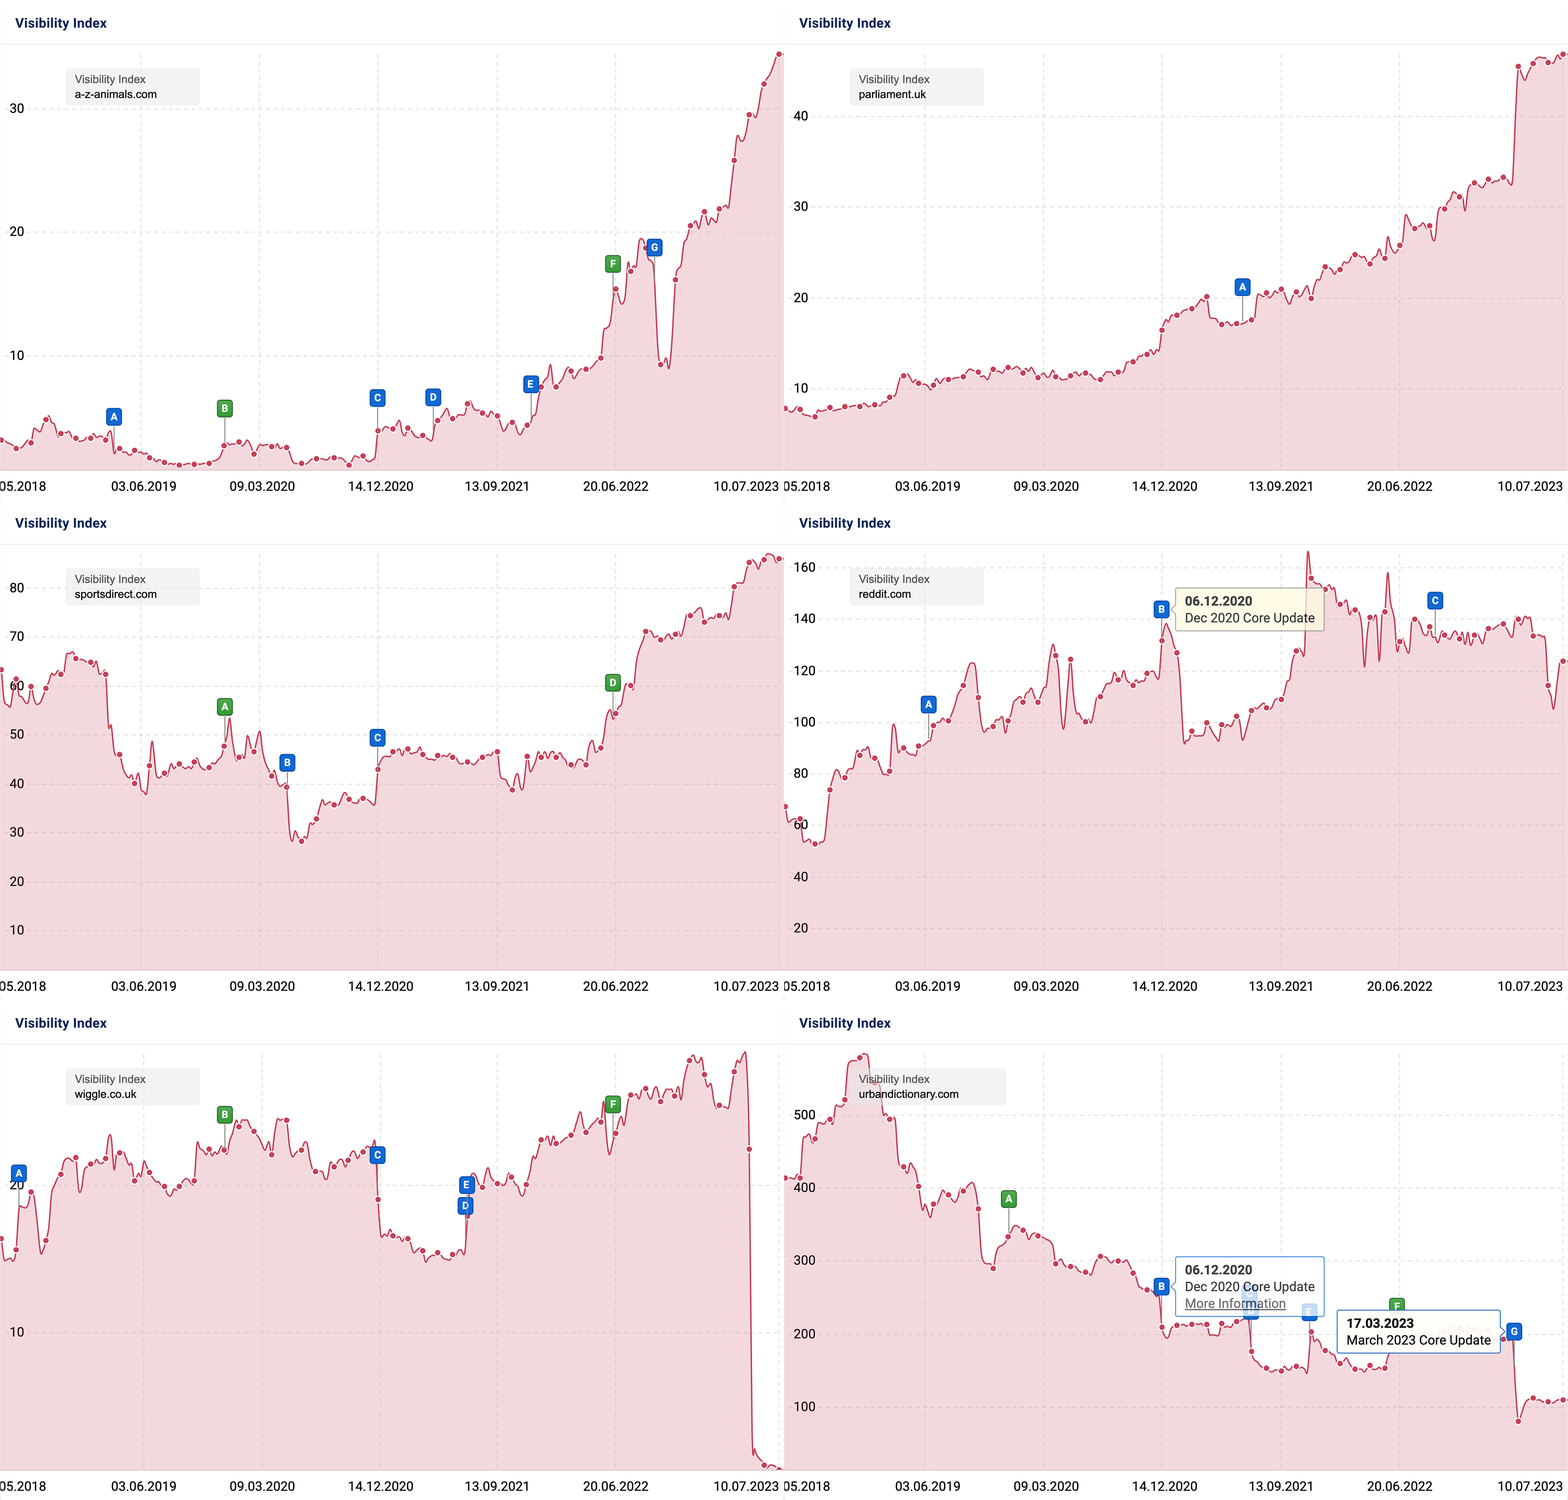
Of the many thousands of content on a website, there are often only a few that are exceptionally successful. Based on the Visibility Index, you can identify this content with just one click.
Test SISTRIX for free
Start improving your rankings today.
- Free test account for 14 days
- Non-binding, no cancellation necessary
- Personal on-boarding by experts
Common Questions and Answers
Seller and Brand Visibility analysis. Seller (Merchant) VisibilityWith the Marketplace module, you can analyse the so-called seller visibility for every merchant on Amazon. In the blue navigation just select "Seller" and enter any dealer name you want to examine.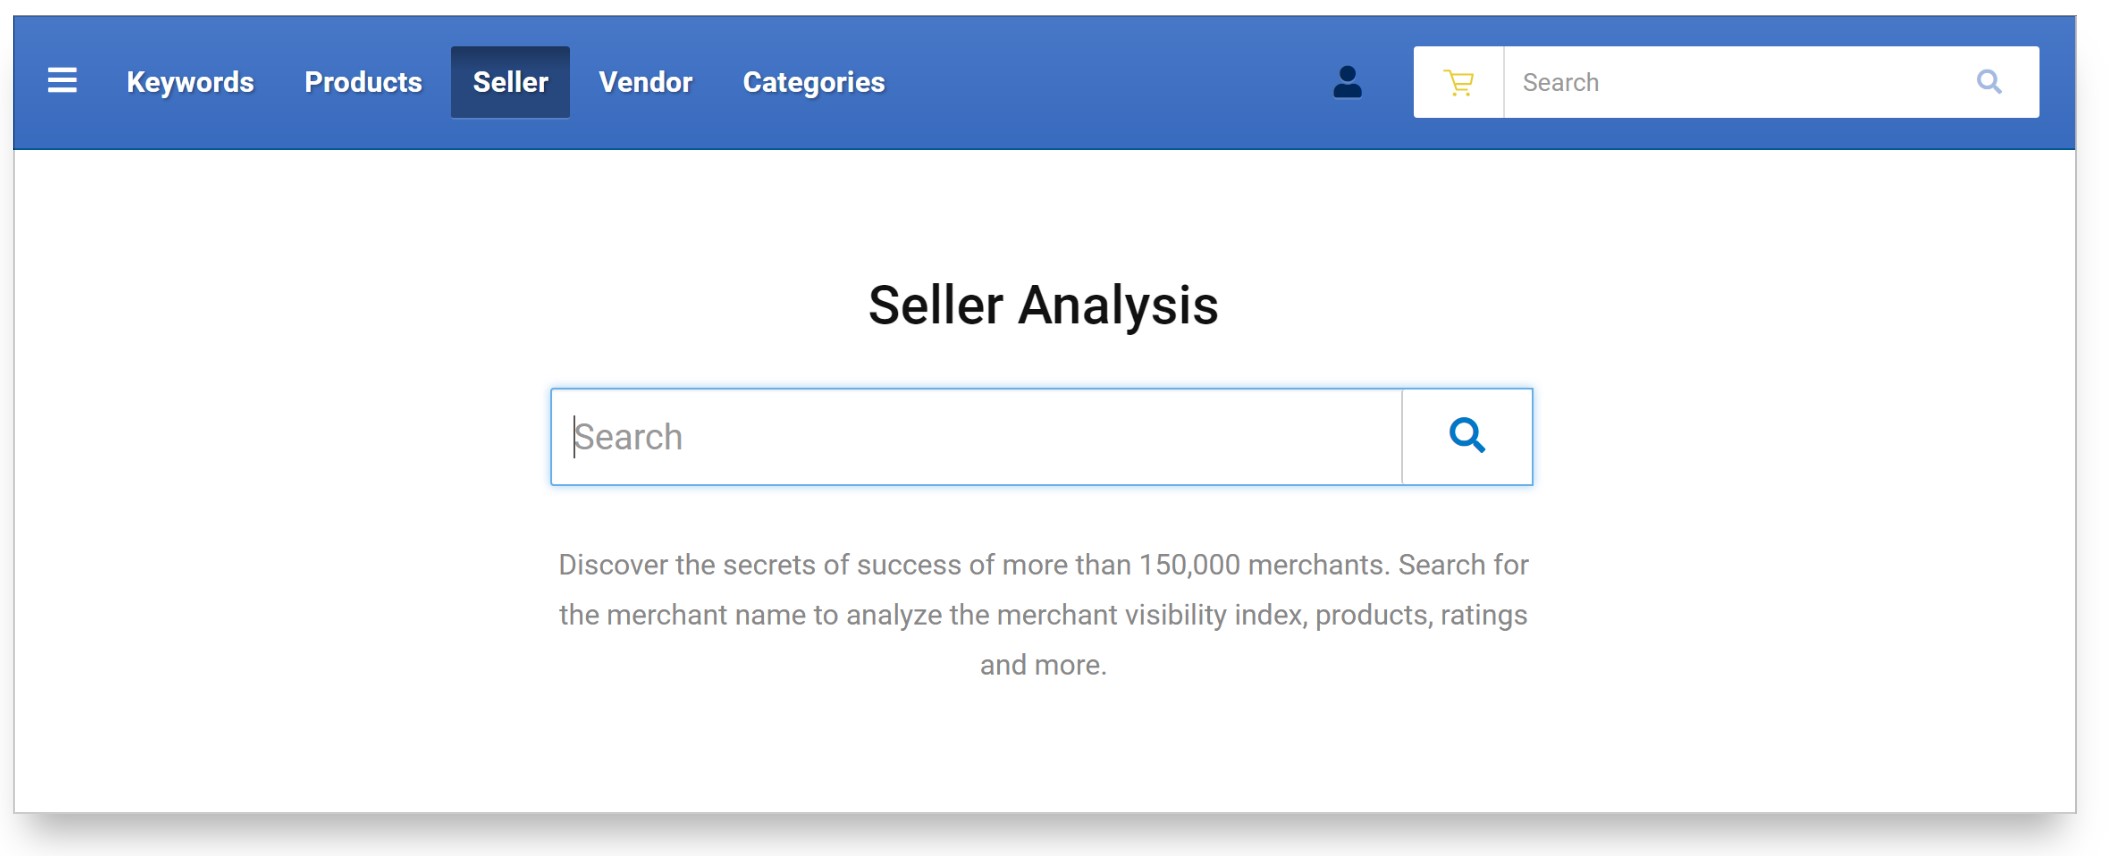 The Seller Visibility Index is based on many millions of relevant Amazon keywords that we periodically query. Once you've entered a merchant, you'll find a wealth of information about that particular seller along with the Visibility Index graph. The Seller Visibility Index is based on many millions of relevant Amazon keywords that we periodically query. Once you've entered a merchant, you'll find a wealth of information about that particular seller along with the Visibility Index graph. 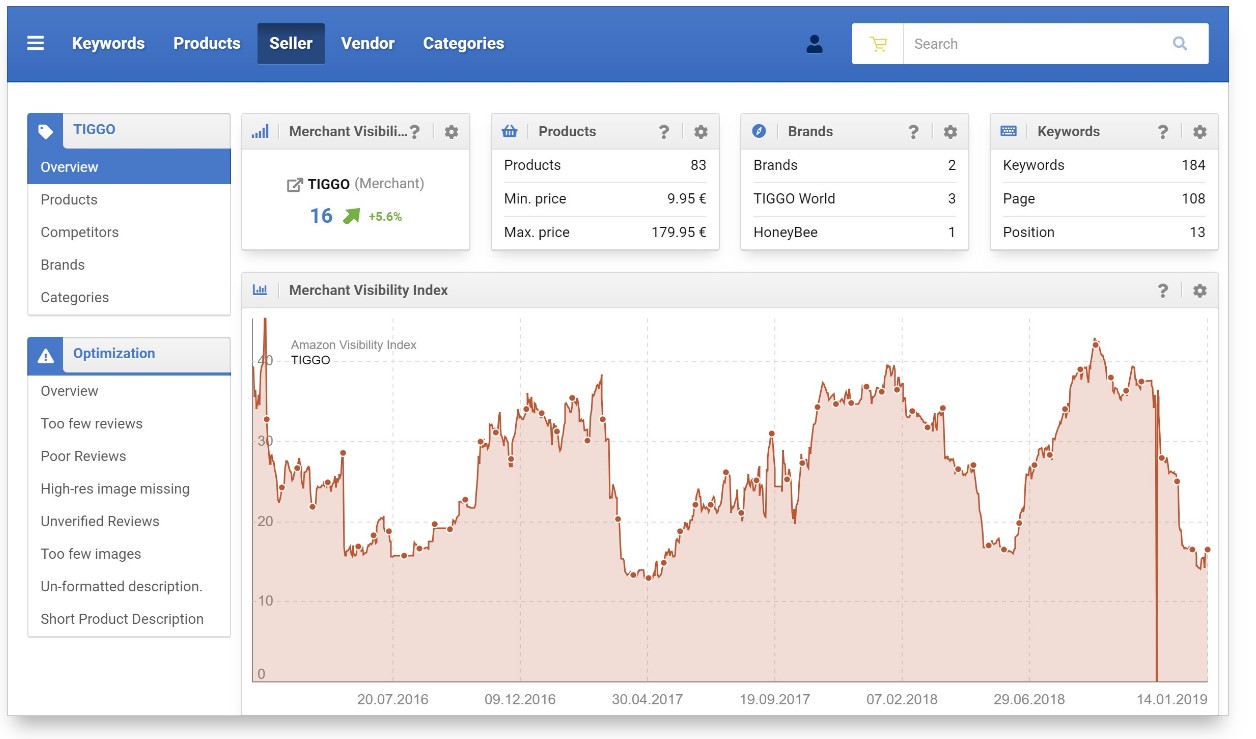 Vendor AnalysisIf you want to analyse a brand (vendor) on Amazon and check its visibility, you can also enter the desired brand via the "Vendor" tab.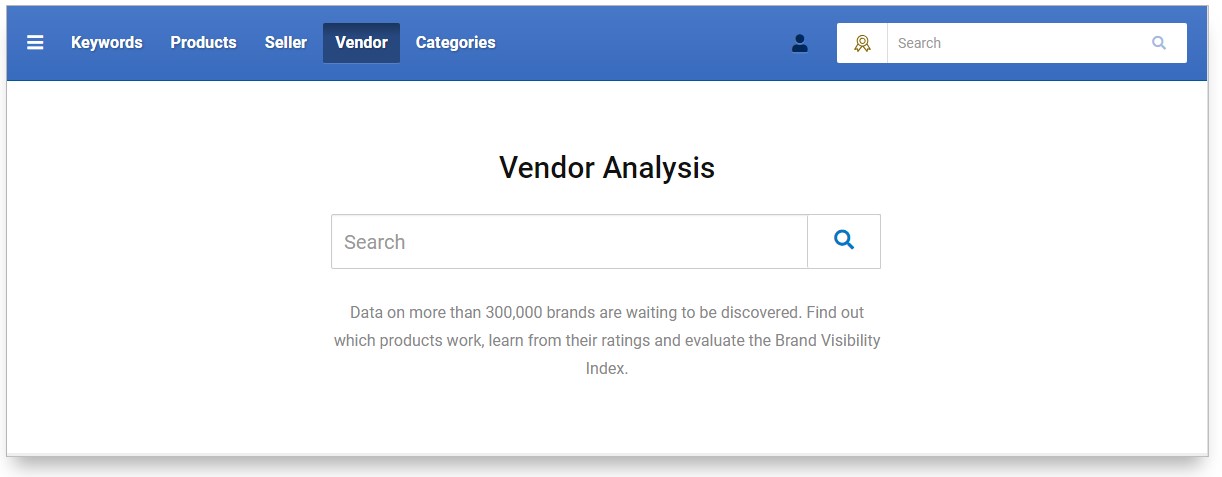 For the desired brand, the Marketplace overview page opens with the visibility history, distributors who distribute the brand, as well as relevant keywords and a price overview. For the desired brand, the Marketplace overview page opens with the visibility history, distributors who distribute the brand, as well as relevant keywords and a price overview. 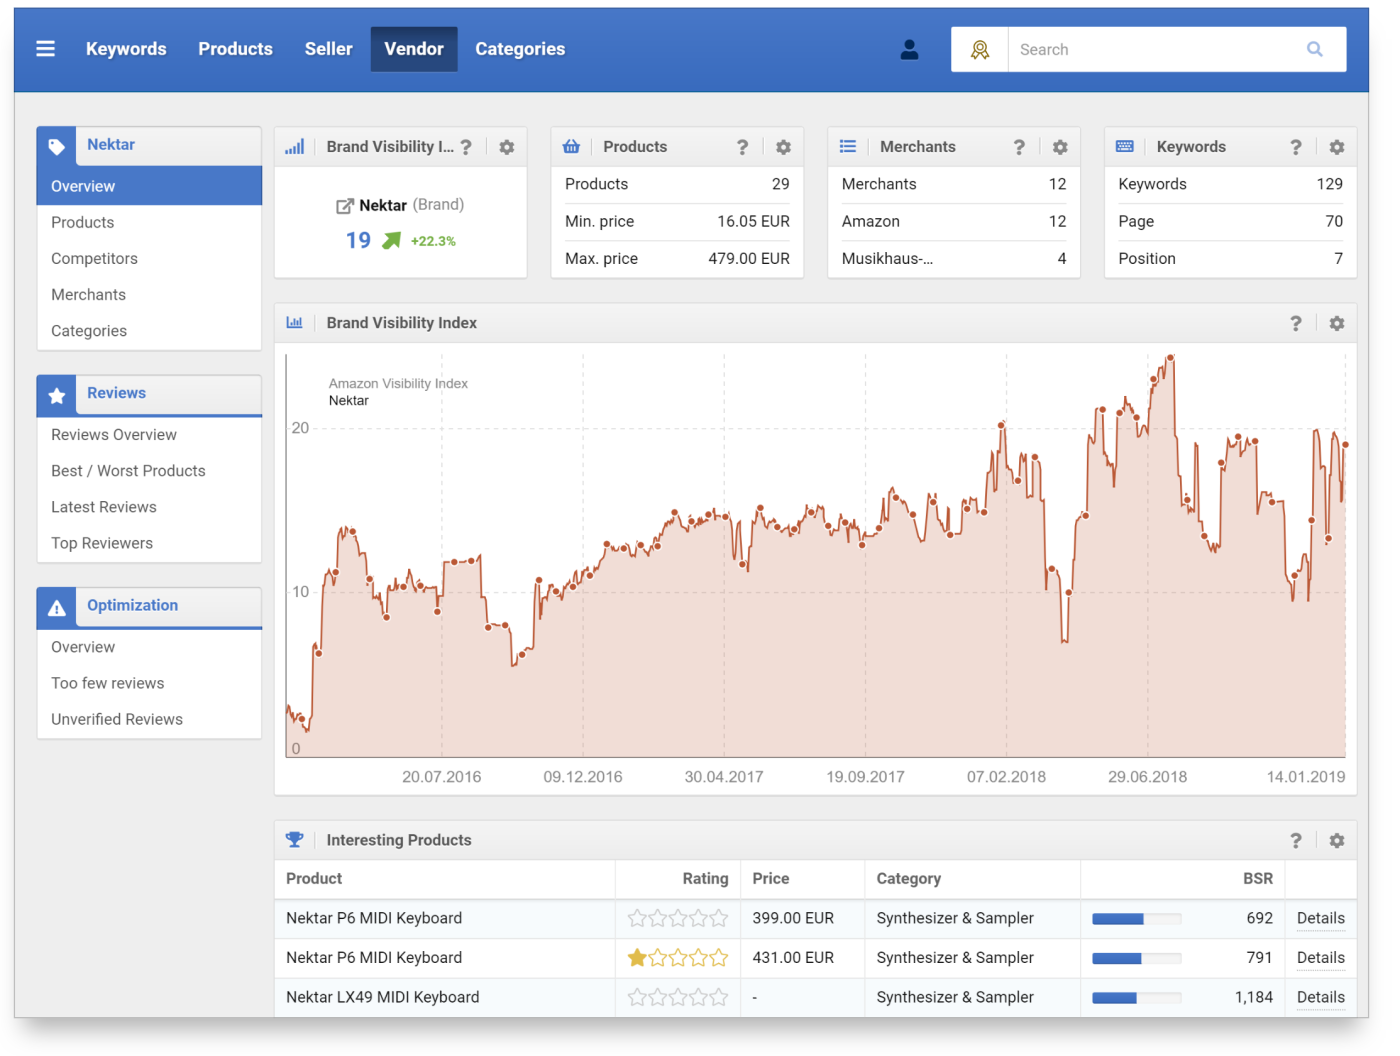 In the left navigation bar, you can do more analysis for the brand. Discover other brand products and re-sellers, categories used, or sort reviews of all products of this brand by various criteria. In the left navigation bar, you can do more analysis for the brand. Discover other brand products and re-sellers, categories used, or sort reviews of all products of this brand by various criteria. |
How can I improve my Visibility Index? It’s not that an improvement in Visibility Index value leads to better rankings in Google, but that an improvement in rankings in Google leads to an improved Visibility Index value. Your goal is higher rankings for more keywords. The best way to do this is through competitor analysis. Based on the successful formats of your competitors, you develop your own SEO strategy. The implementation then leads to more and better rankings and thus to a measurably better Visibility Index. |
Is it possible to compare the Visibility Index history of multiple domains? One of the most flexible and useful ways to compare the history of two or more domains is to use the comparison feature. Compare changes (when you suspect that a competitor or Google might be affecting your domains visibility) or compare mobile vs desktop views. You are able to display the Visibility Index history for up to 4 domains (or hosts/directories/URLs) together in one graph. Please type the first domain into the search slot and press enter. Note: The UK index has historical data since 2010. USA index since 2011. Other countries vary. You will be shown the overview page for this domain, complete with the Visibility Index history for the domain. Click on the cogwheel in the upper right corner of the chart and select “Overlay Data”. 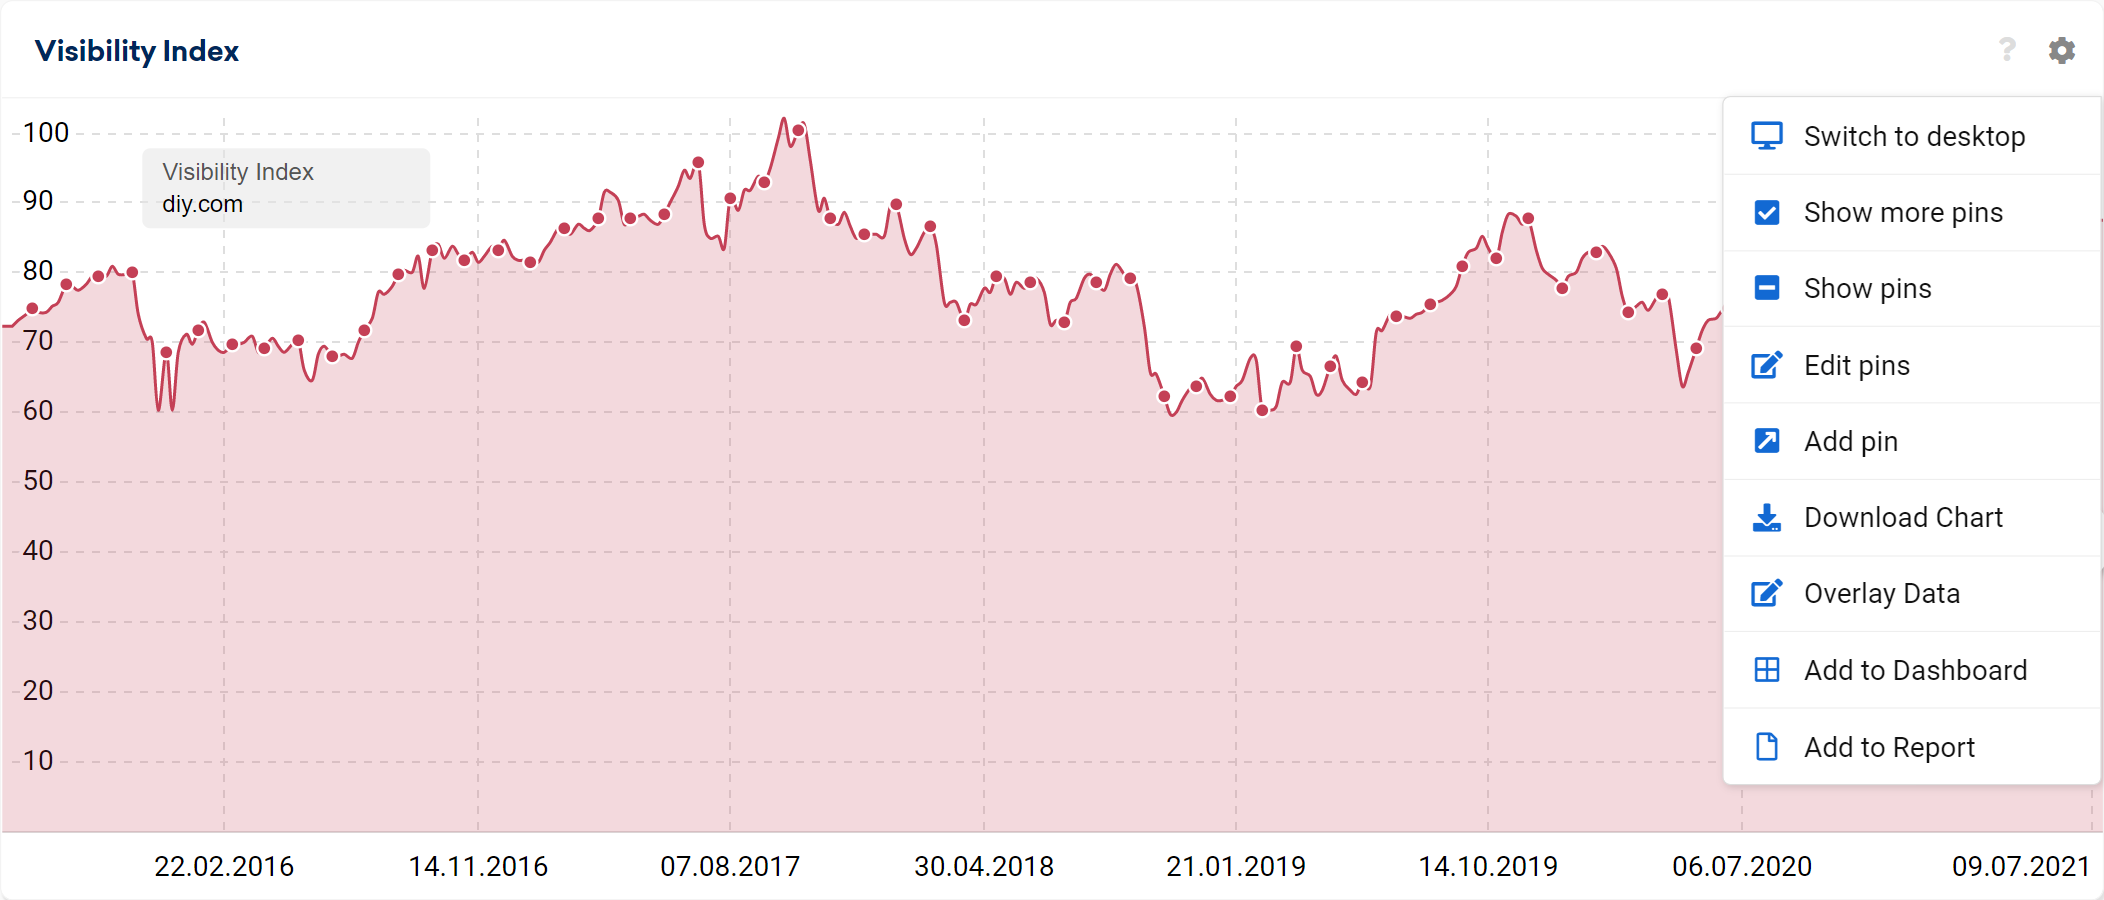 At this point, you can enter up to six domains/hosts/directories/URLs whose Visibility Index history you want to superimpose. You can choose any domain and any country including the mobile views. 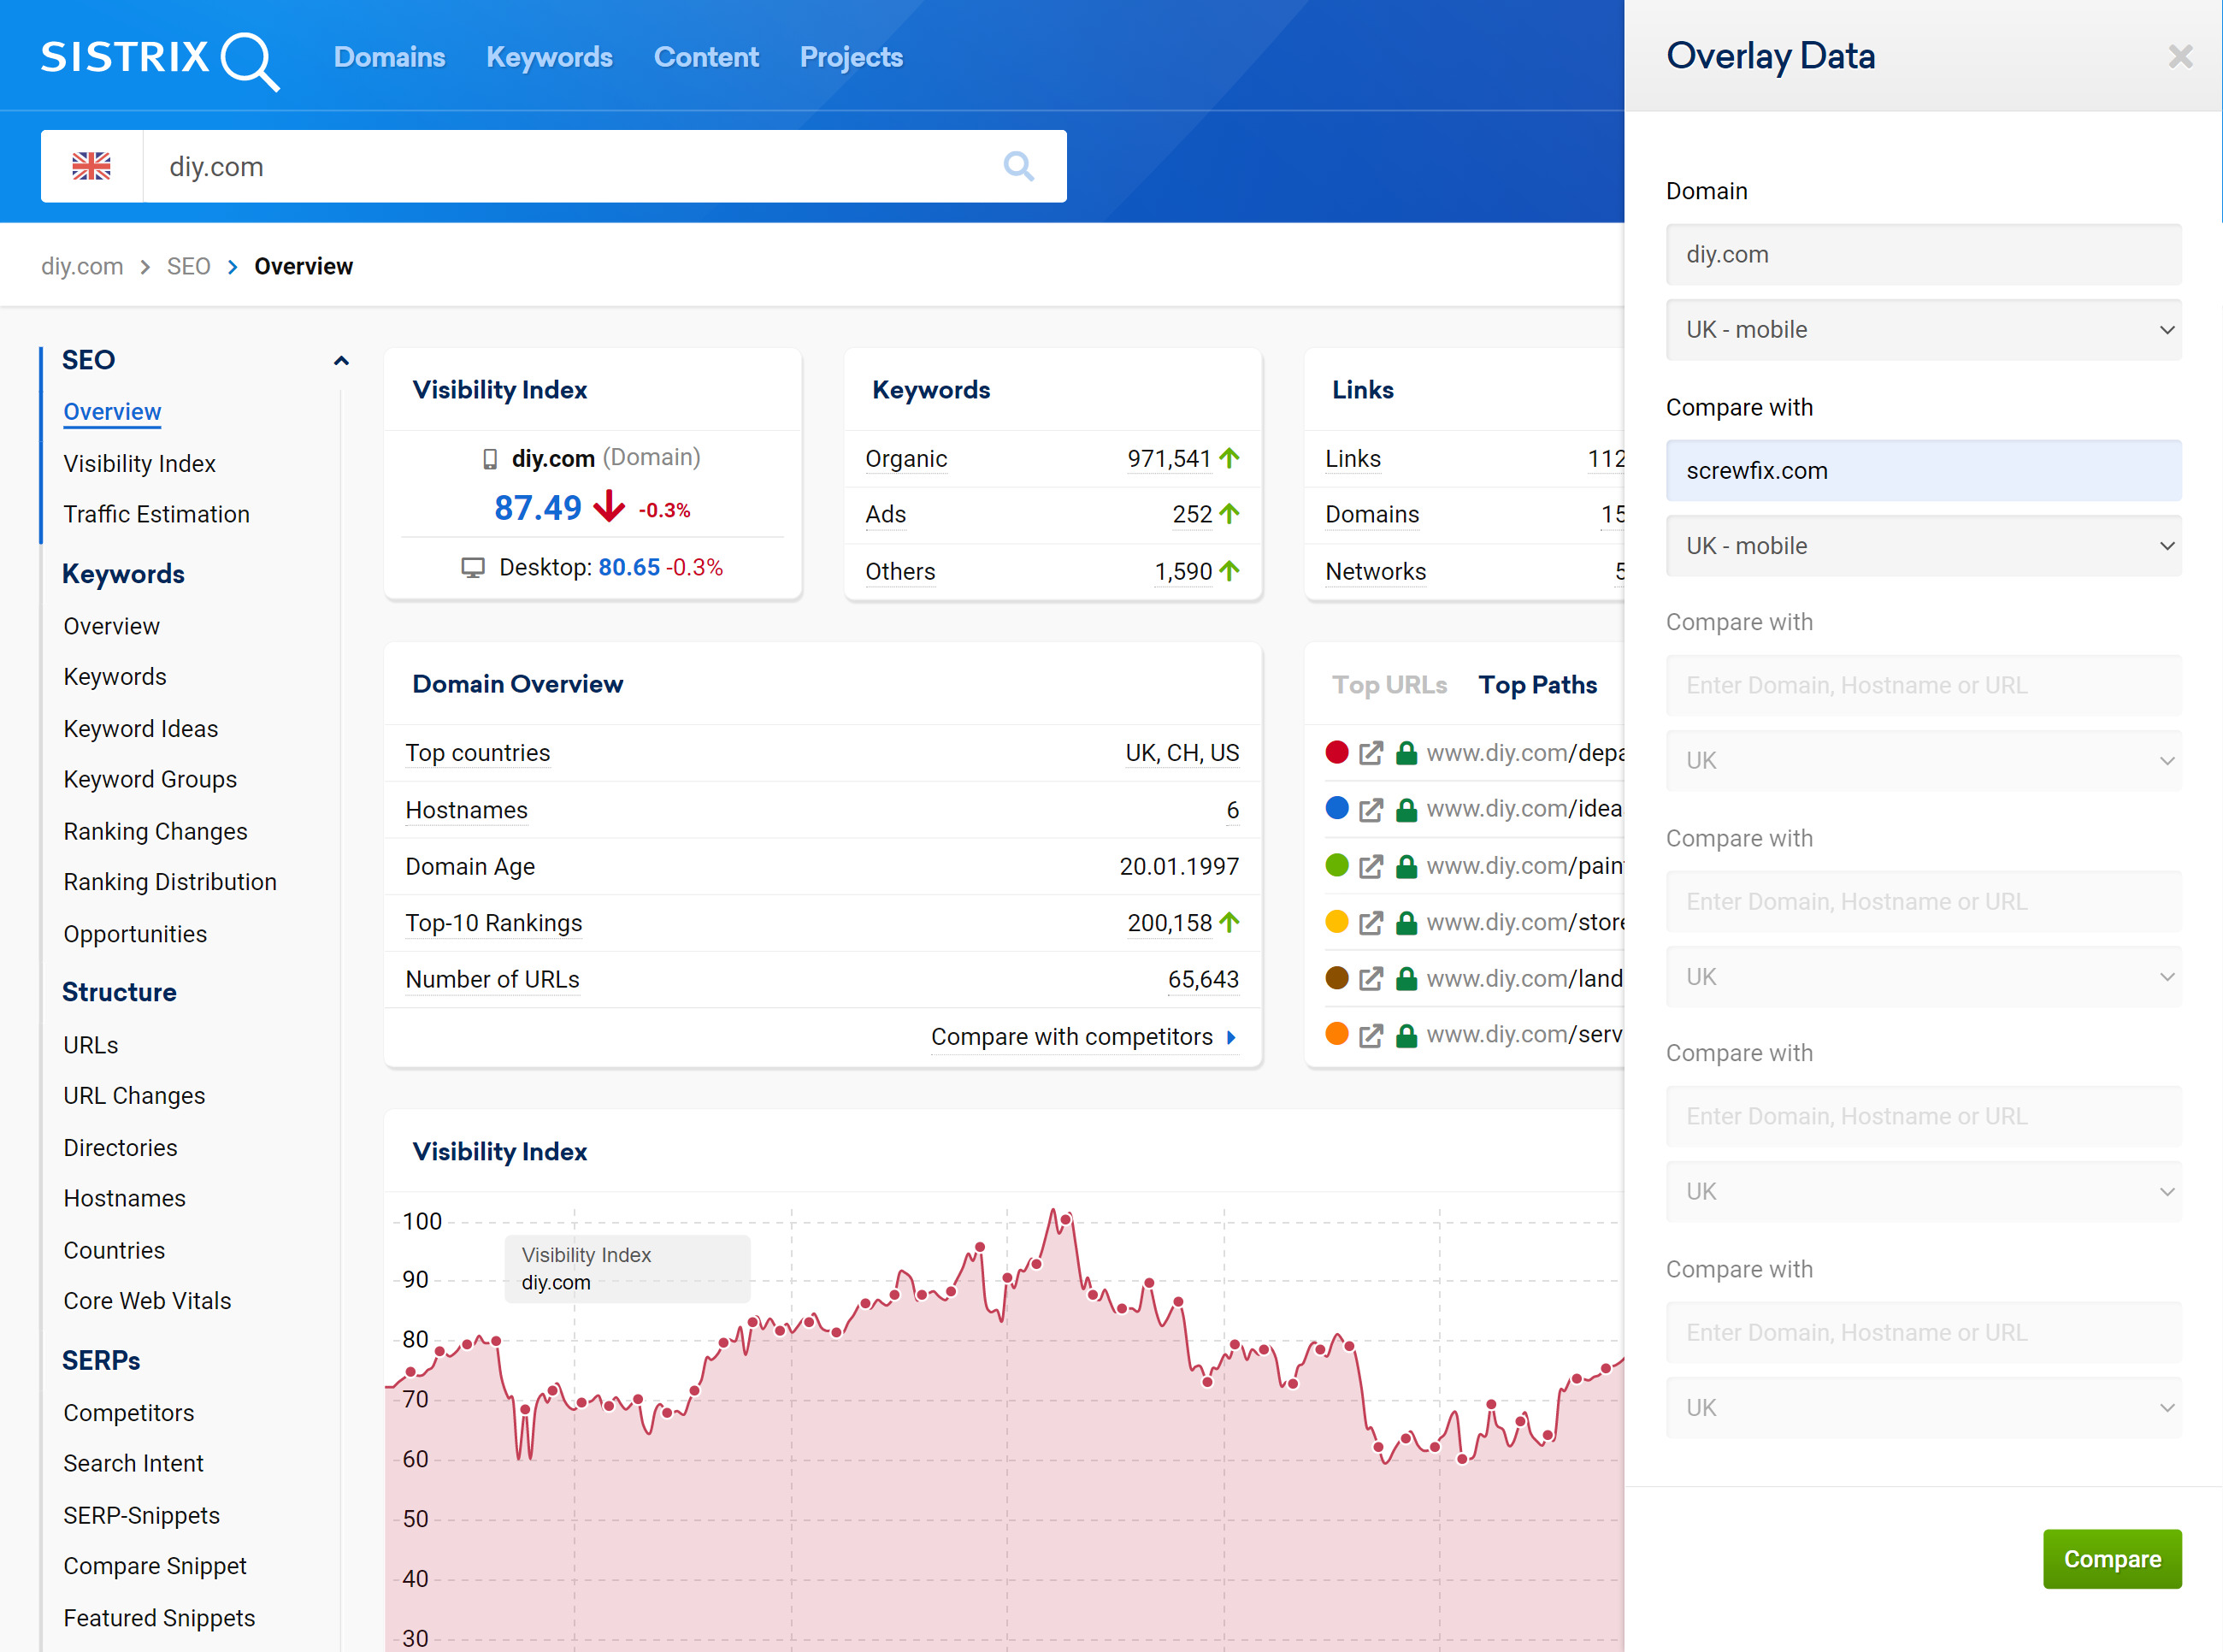 Please keep in mind the format for the entry of hosts, directories and URLs. You can find these in our FAQ called “Which requests can I start via the search bar?” (Tip: URLS must end with the slash or they will be treated as directories.) You can zoom into the data as on all the graphs. Left-click your mouse button, drag to the right and then release to zoom. |
How can I display the Visibility Index history of more than the top 3 results under SEO host names/directories? In the “SEO > Hostnames” and “SEO > Directories” evaluations, you will always see the top 3 most powerful hosts/directories in a graphic, showing their history. You are not able to select another host/directory outside of the displayed three. If you want to check the Visibility Index history for other hosts/directories, you can do the following: Select the first of the hosts/directories you want to compare by clicking on their result in the list with your mouse cursor. The overview page for that specific host/directory will then be displayed. On this page you can also find the Visibility Index history for that host/directory. Click on the cogwheel in the upper right corner of the chart and select “Compare chart”. At this point, you can enter up to four hosts/directories whose Visibility Index history you want to superimpose. Please keep in mind the format for the entry of hosts, directories and URLs. You can find these in our FAQ called “Which requests can I start via the search bar?” |
Can I set up a daily project Visibility Index? Yes, you are able to change the project Visibility Index, which is calculated using only the keywords you track for this project, to show daily updates. In order to do so, you will need to have at least one keyword in this project on a daily crawl-frequency and we must have monitored this keyword for at least one week. Once these two prerequisites have been met, you can navigate to "Settings > Project" and choose "Daily" in the "Visibility Index" drop-down menu. |
