
The loading speed of a website is a ranking factor. To check it, you have several options at your disposal. Read on for an overview of the most important tools, the metrics that they use and their advantages and disadvantages.
The free SISTRIX PageSpeed tool
With our free PageSpeed tool, you can check the loading time of your website immediately. The information provided by the SISTRIX PageSpeed Tool is based on real user data and provides you with valuable insights.
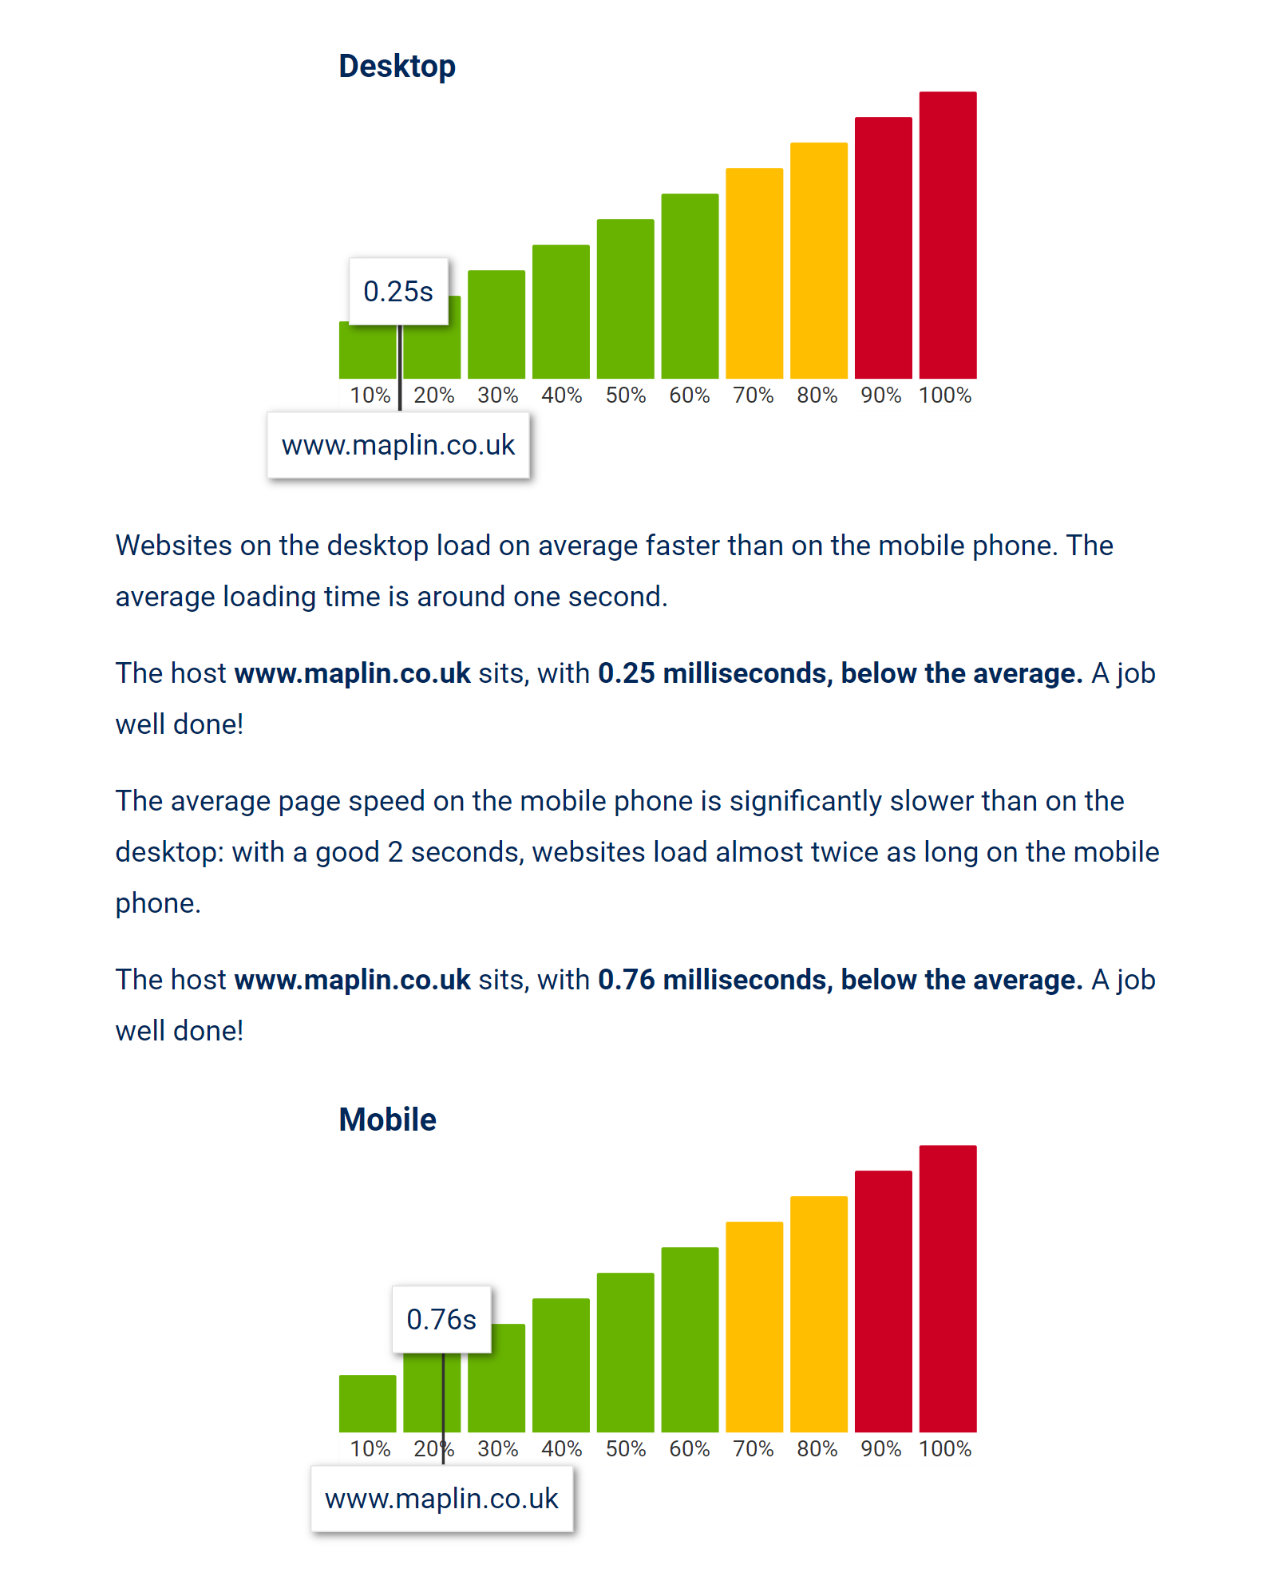
How does it work? Google provides a public dataset of load times as part of the Chrome User Experience Report. We build on this data, summarise it and put it into an easy-to-interpret context.
Google PageSpeed Insights
The Google PageSpeed Insights tool provided by Google can be used to determine the loading time of a website in the form of the PageSpeed Score, a rating scale consisting of 0 – 100 points. In this article, we have summarised what exactly PageSpeed Insights measures and how the PageSpeed Score is calculated.
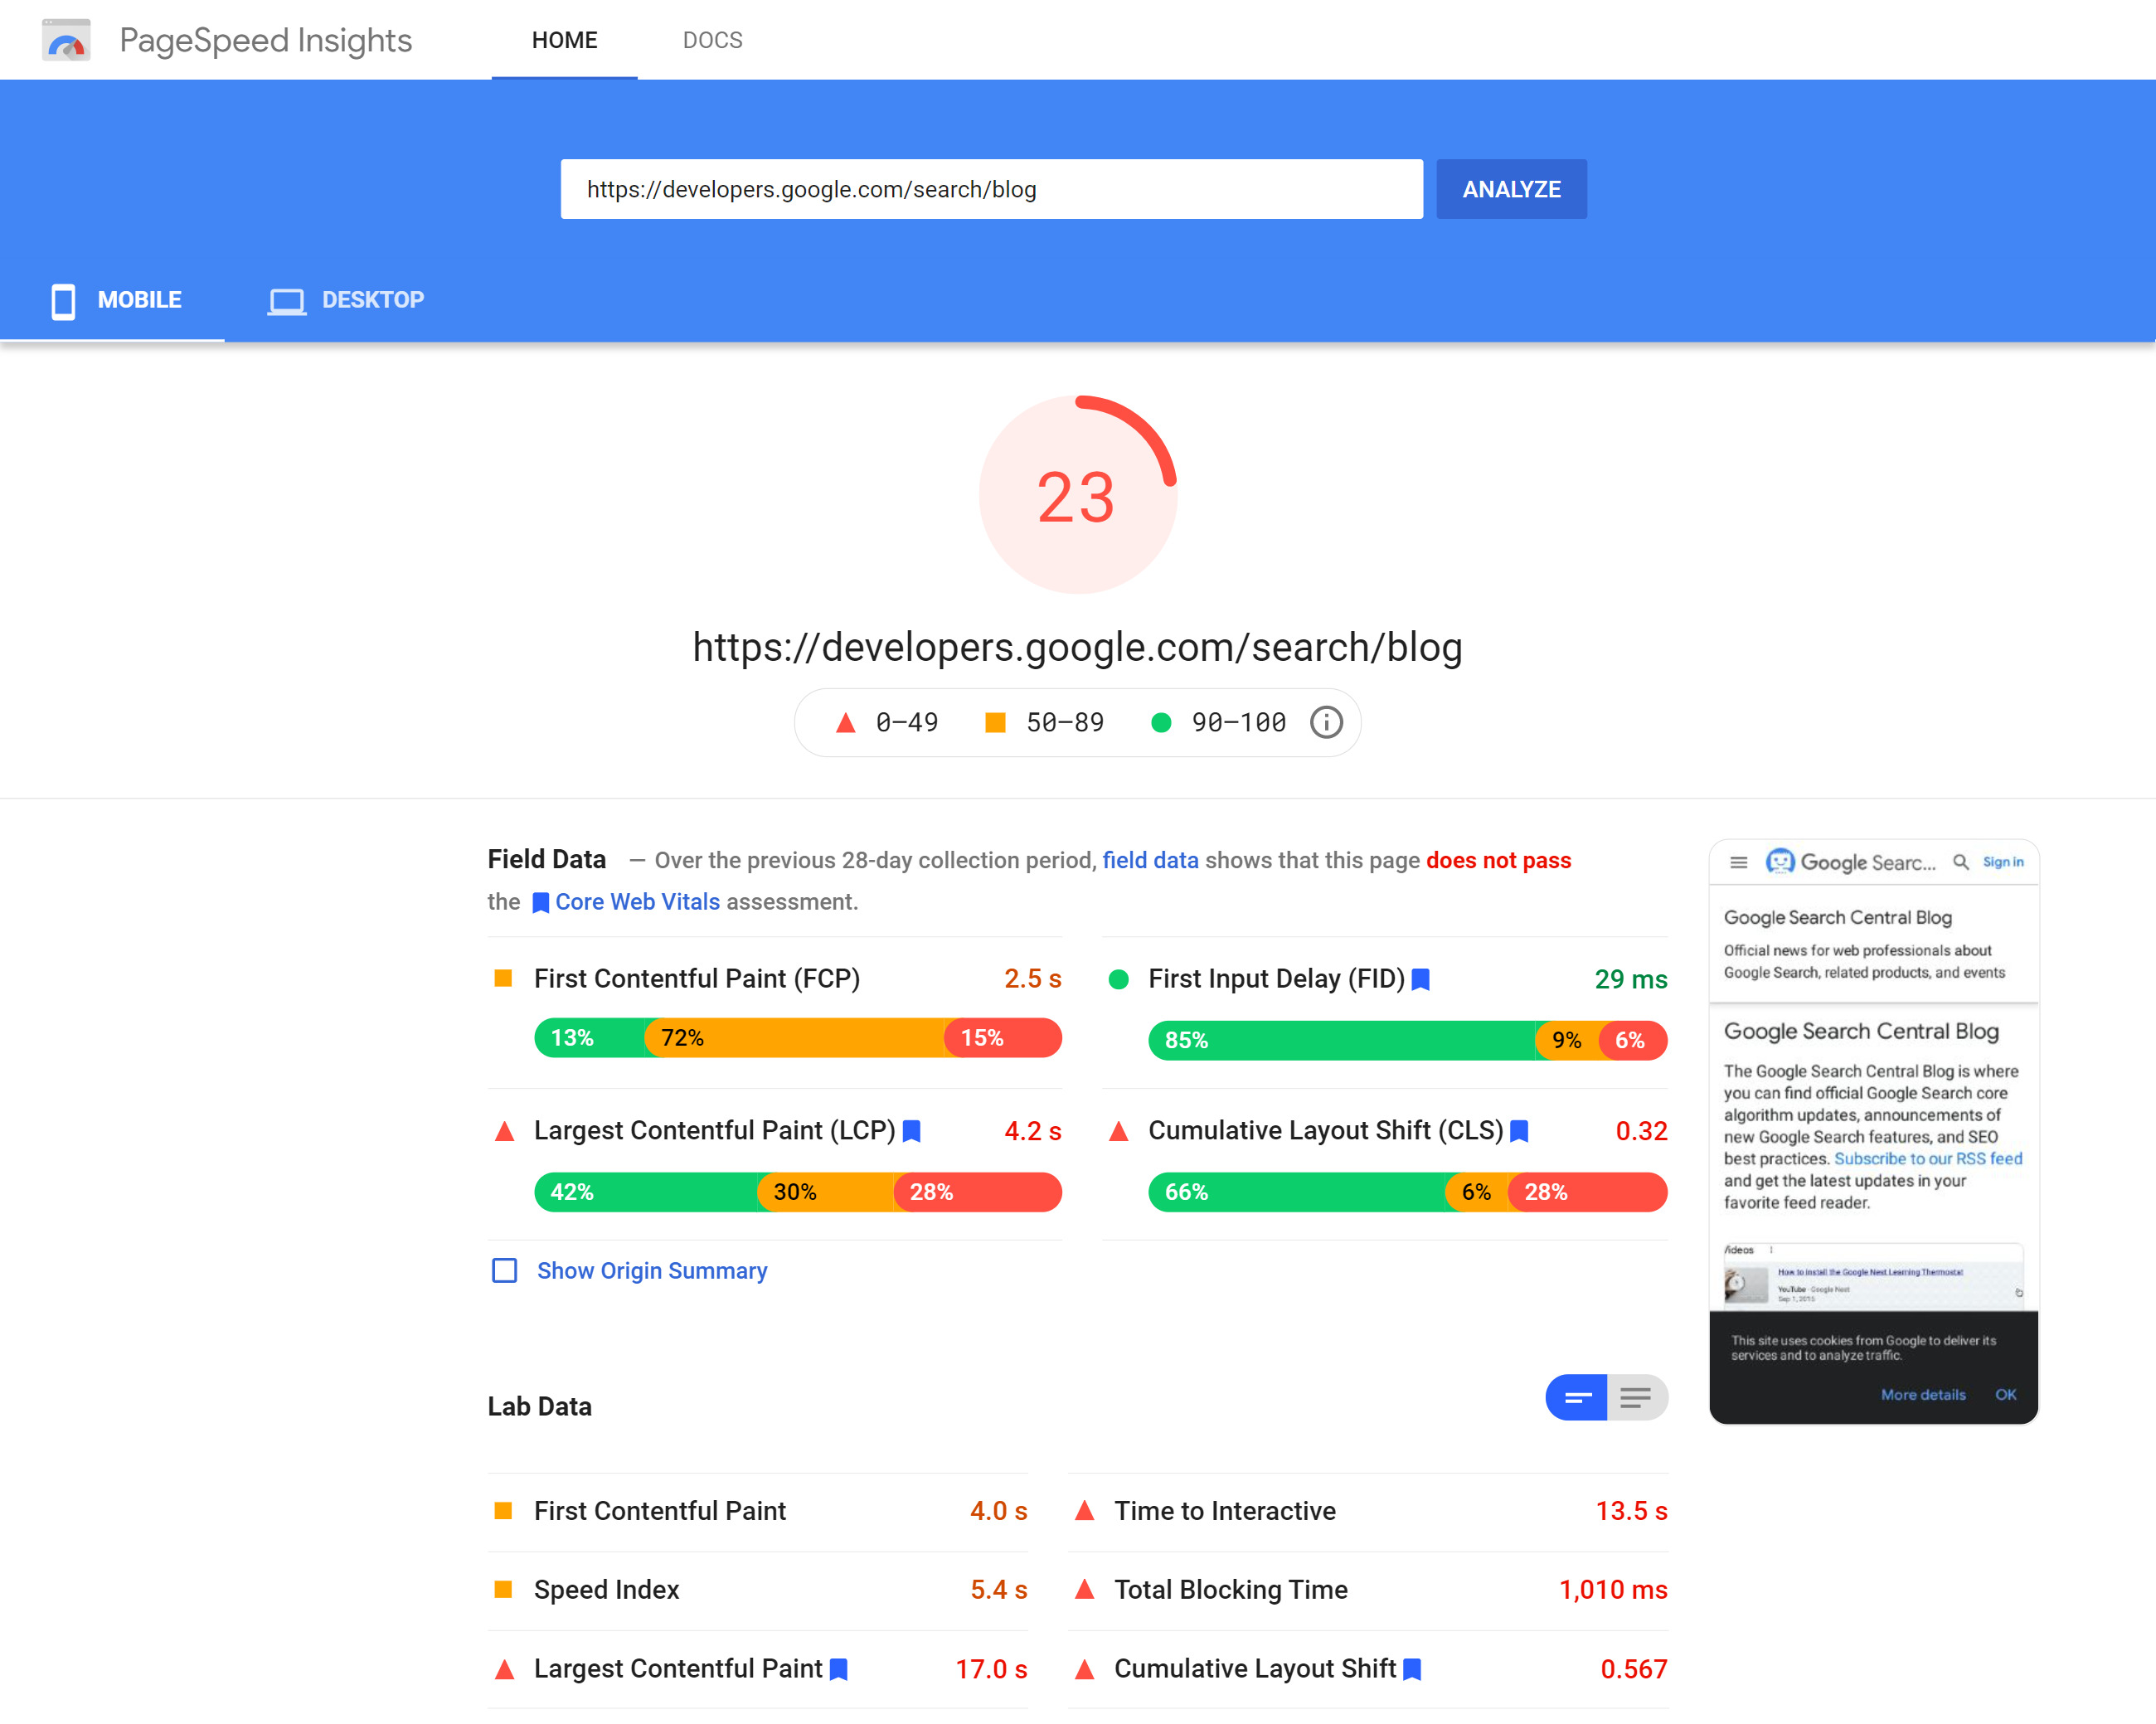
The data from the benchmark test carried out for mobile and desktop are available separately as metrics in the “Lab data” section. These datasets can be compared with one another, as each PageSpeed Insights test is carried out under relatively constant conditions. The tool is provided directly by Google.
For most domains, the so-called field data from the CrUX reports are also displayed.
If a website is analysed with PageSpeed Insights, specific recommendations for improving the loading time are given in addition to the calculated score. This list contains suggestions for improvement ranked by potential savings, as well as links to explanations and further information.
Although the PageSpeed Insights tool is essentially based on the Lighthouse test, debugging is unfortunately not possible in the PageSpeed Insights. Furthermore, the field data is only updated after a long delay. For your own website, you should therefore always use the Core Web Vitals report of the Google Search Console.
Google Lighthouse
Another tool from Google is available by default in the Chrome browser: Lighthouse. This is a series of automated tests that are given to a website and are intended to make a website faster and more efficient.
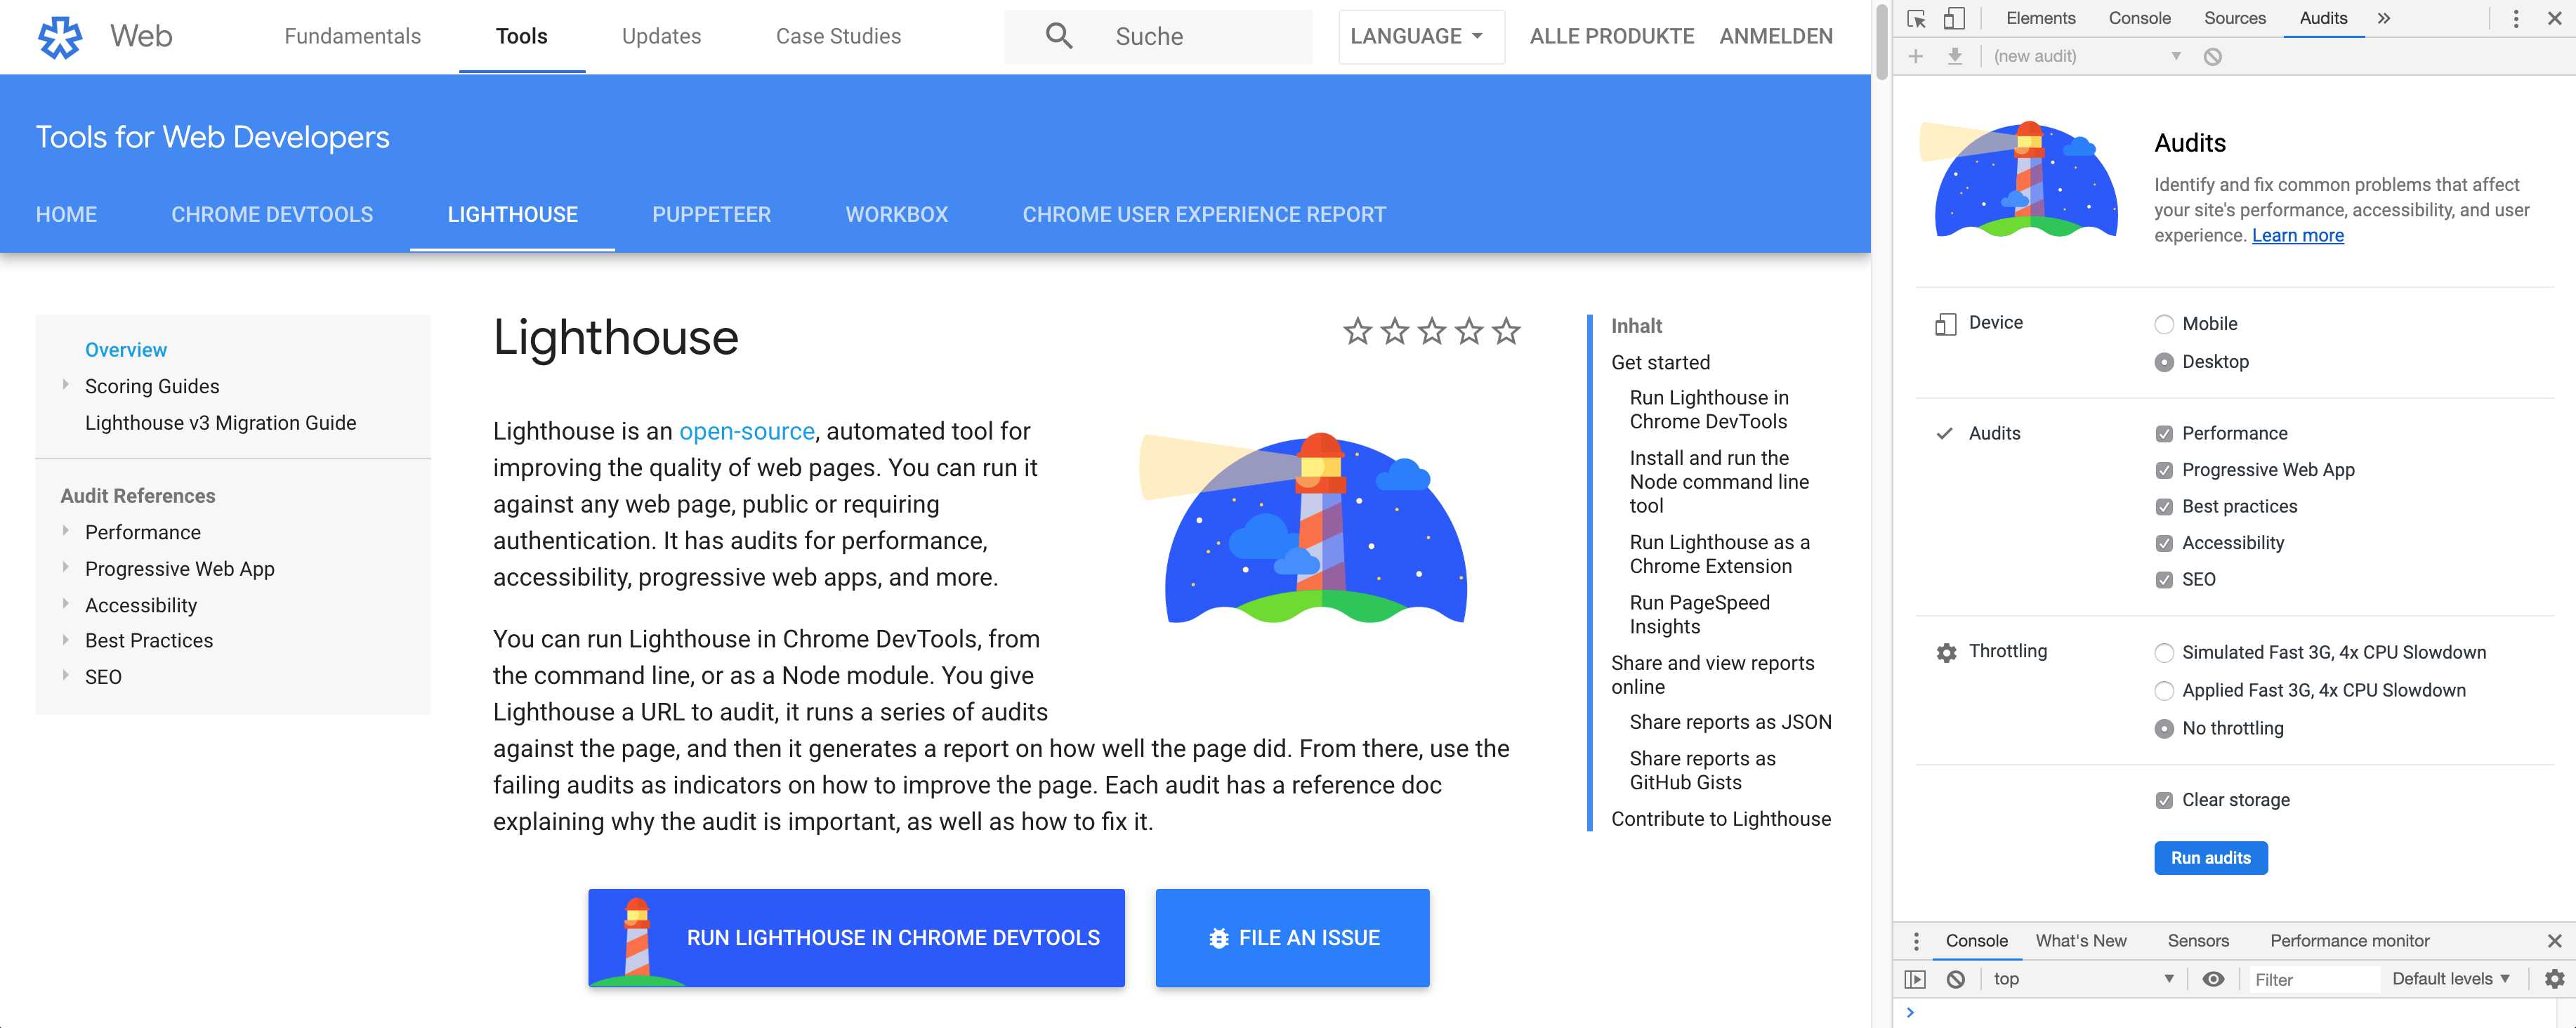
To access the Lighthouse Audits in Chrome, simply right click on the website and click on “Investigate”. This opens the Developer Console – you can also go to Chrome Options and click on “More Tools > Developer Console” or use the keyboard shortcuts. In the Developer Console, select the “Audits” tab.
As with PageSpeed Insights, Lighthouse also displays specific instructions and suggestions for improvements, in addition to further information.
In addition to measuring page speed, Lighthouse reviews a few best practices. In the area of trust and security, for example, the use of encrypted connections via HTTPS is checked. In the area of user experience, for example, images are examined to see if they are displayed in the correct aspect ratio. A few browser compatibilities checks (correctly defined character set, etc.) and general tests regarding code errors or the use of outdated APIs round off this area.
The suitability of the website as a so-called “Progressive Web App” is also checked. Progressive Web Apps (PWAs) are basically websites that are created with modern APIs and expanded with the functions of classic apps. A Progressive Web App feels like a native app on the device, regardless of the network: PWAs are available and usable offline.
Lighthouse testing can also be used to improve the accessibility of a web app. Of course, not all problems can be detected by automated tests, but the recommendations are a good start nonetheless.
Note: The integrated SEO check should not be taken too seriously; Google correctly points out that there are “additional factors that Lighthouse does not check that have an influence on the ranking”.
Google Analytics
The average loading time of a website and other speed metrics can be viewed in Google Analytics. The report can be found in the “Behaviour” category under “Website Speed”.
The average page load time is measured there. This is the average time (in seconds) that is required to load each page. In other words, the time between requesting the page (by clicking on a link) and the completion of the page loading process in the browser.
The average page load time in Google Analytics is therefore always made up of two components: the network and server time and the browser time.
When using the key figures from Google Analytics, it is important to note that only random samples of page views are taken into consideration when calculating the average page load time and that the redirect time is also taken into account. For this reason, the key figures may fluctuate or differ in comparison to other evaluations.
- Google Analytics
- Google Analytics information on website speed
Real-time measurement of core web vitals in Google Analytics
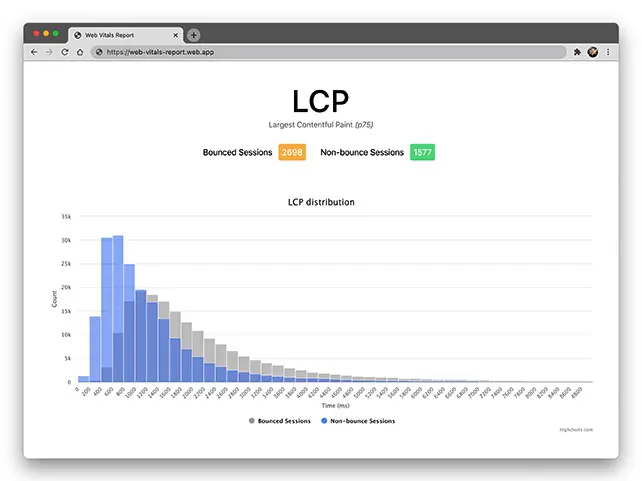
By integrating the web-vitals JavaScript library, the web-vitals metrics of real users can be measured in Google Analytics. This data corresponds to how it is measured by Chrome and reported to other Google tools.
If the core web vitals are recorded in Google Analytics, the open-source tool Web Vitals Report can be used to create very attractive reports. The tool requires permission to use Google Analytics data from the domain.
Search Console Core Web Vitals Report
Google Search Console’s Core Web Vitals Report contains ranking-relevant data on the performance of a website. This is based on the actual usage data (field data) from the Google Chrome User Experience Report.
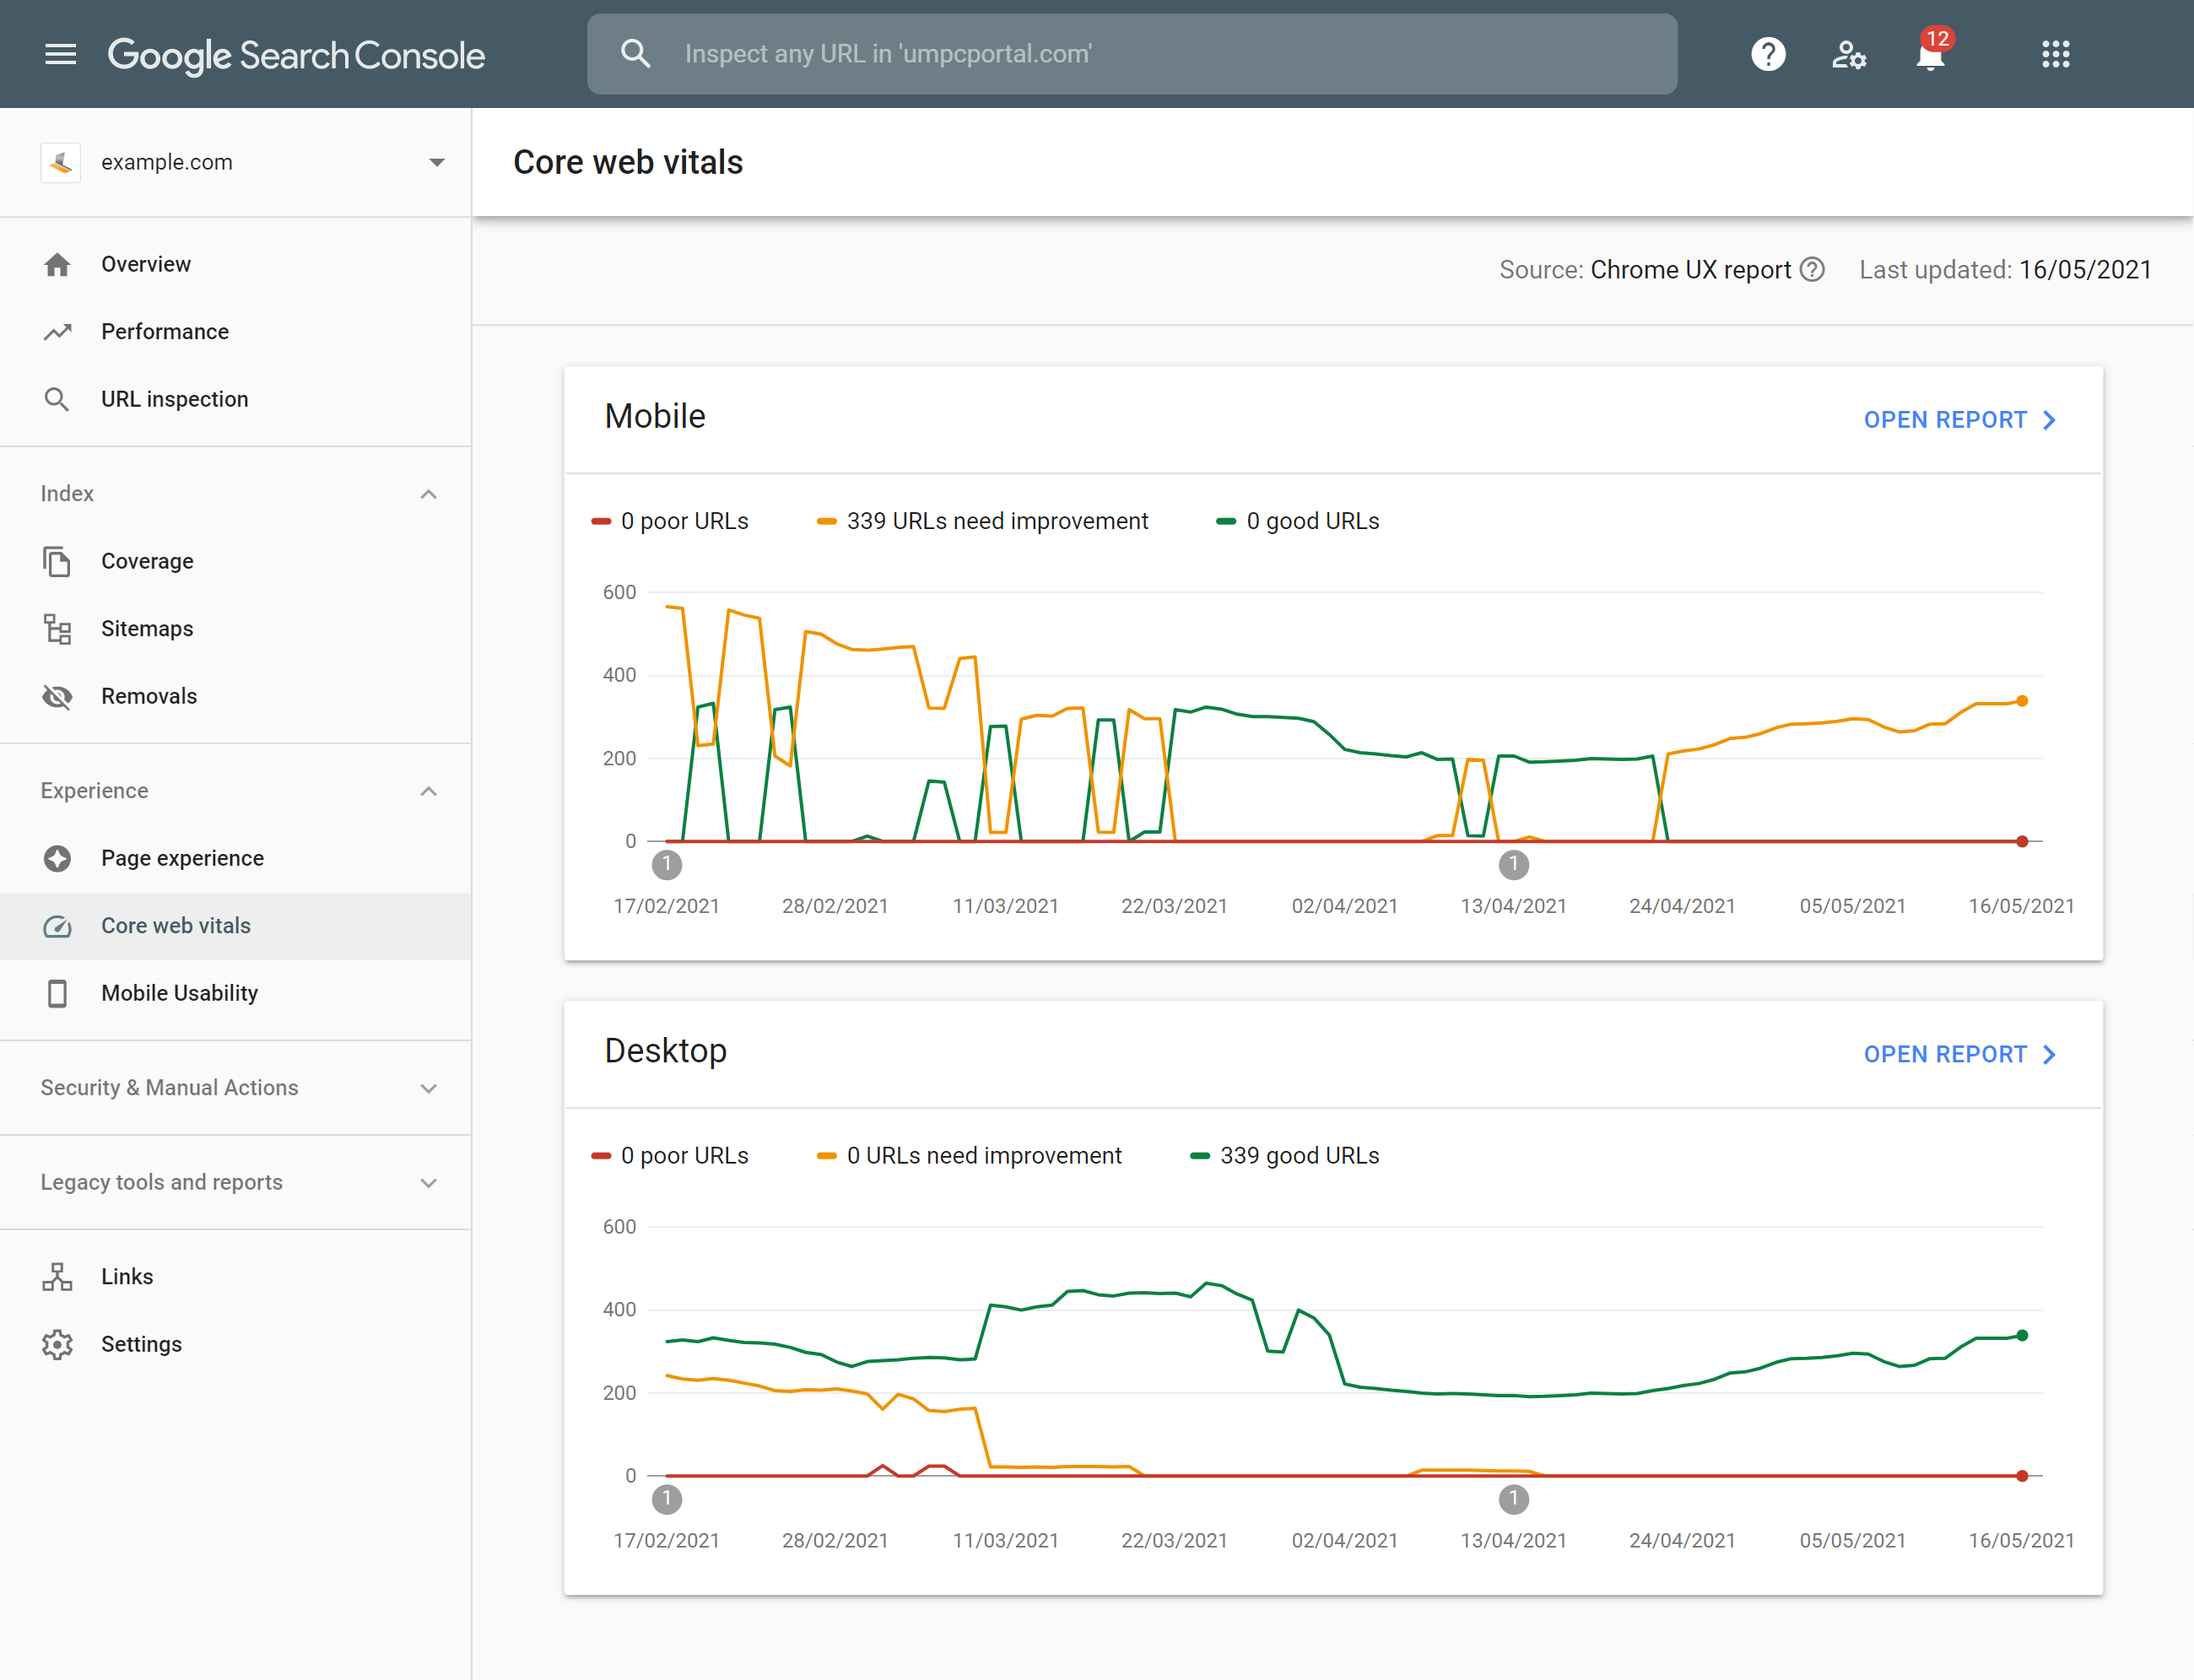
Unlike the CrUX report, you get very detailed data for almost every URL that is accessed by more than a few visitors per day. Problems and errors present in several URLs that can be traced back to the same cause are automatically grouped and displayed as URL clusters.
Unfortunately, no deeper debugging is possible, and the values enter Search Console after a delay of about 2-3 days.
If your website is not already connected, add it to Google Search Console using this guide.
WebPageTest
In addition to PageSpeed Insights, WebPageTest offers the most comprehensive analysis with regard to loading times, in addition to numerous evaluation and debugging functions.
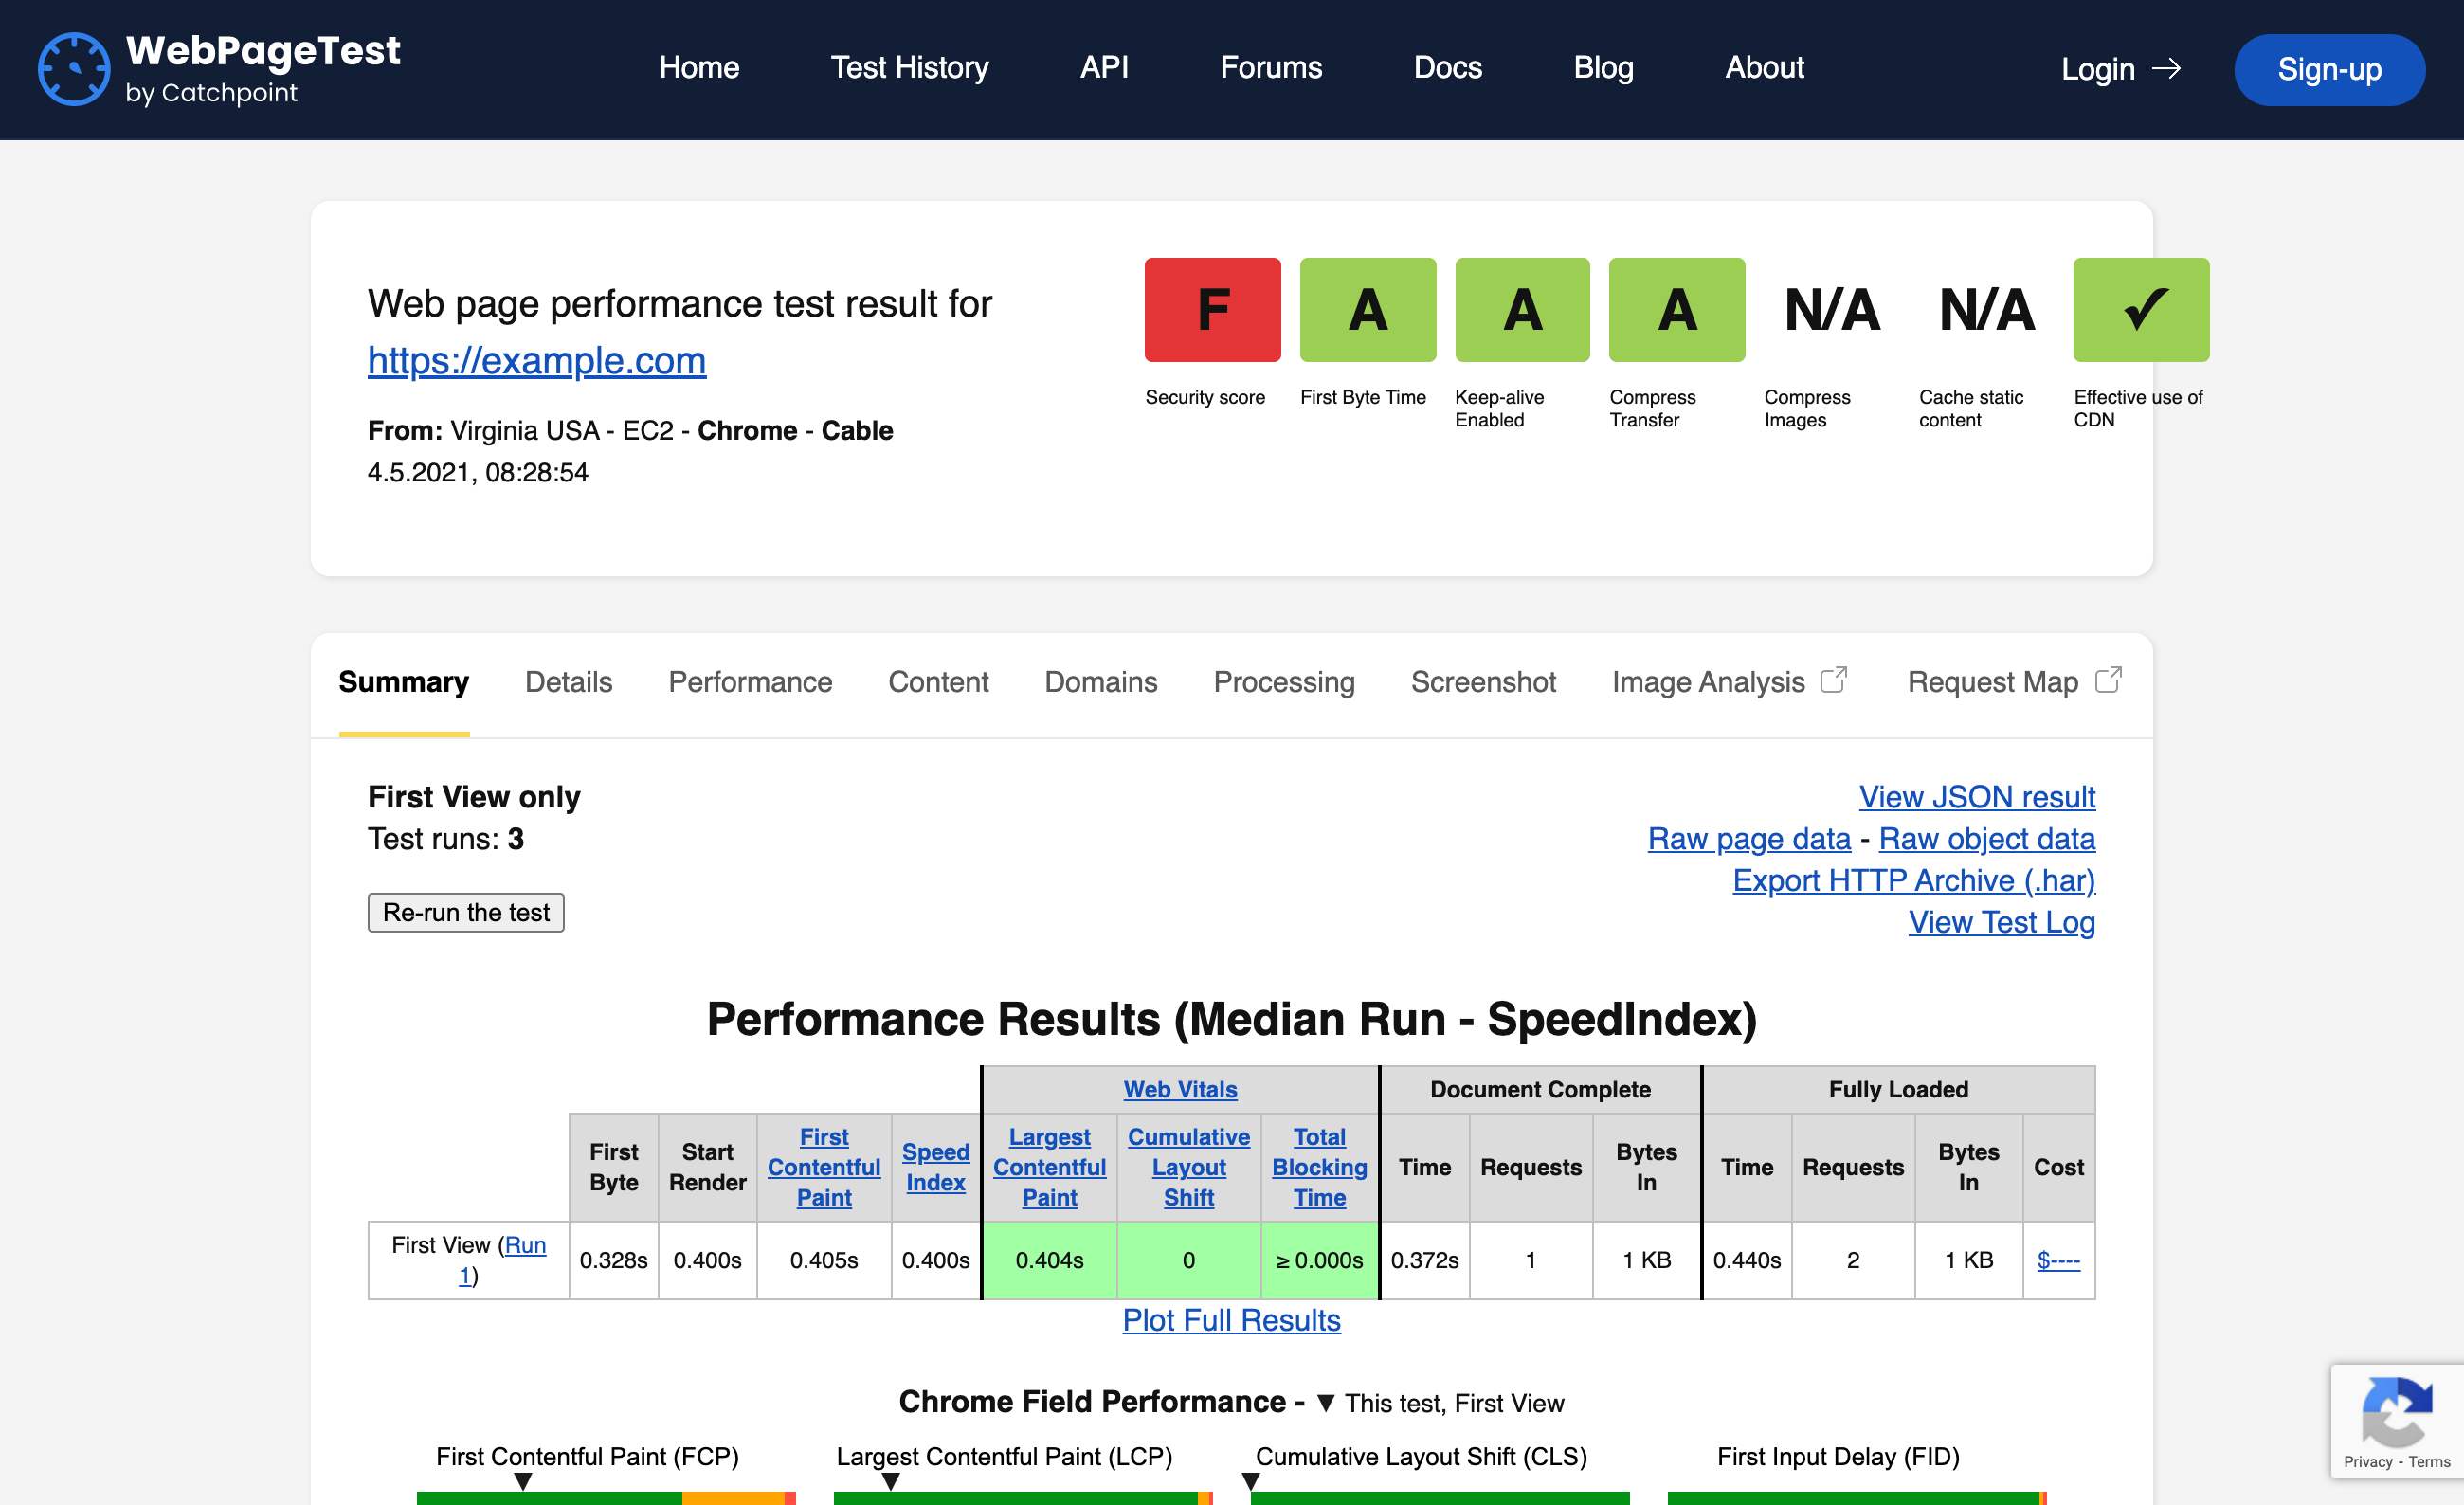
Lab data for desktop and mobile browsers can be requested in any resolution and from a wide range of locations. A simulation of poor connections or slow CPUs is also possible. The tests are run in the cloud and thus under relatively constant conditions.
Particularly interesting is the comparison of the loading time and the waterfall diagram of the various interactions of a returning visitor with a website. This makes it very easy to see whether the caching rules are working correctly and how much of a difference they make.
The field data from the CrUX reports are also displayed and evaluated in comparison to the current lab values:

The debugging for requests & resources and the videos and screenshots that are generated of the page structure make this tool an indispensable aid in optimising the loading time of a website.
SISTRIX Optimizer
For your projects in the Optimizer module, the start page of a project is monitored at intervals of every three hours by default, and you will receive detailed information about the loading time via the waterfall diagram.
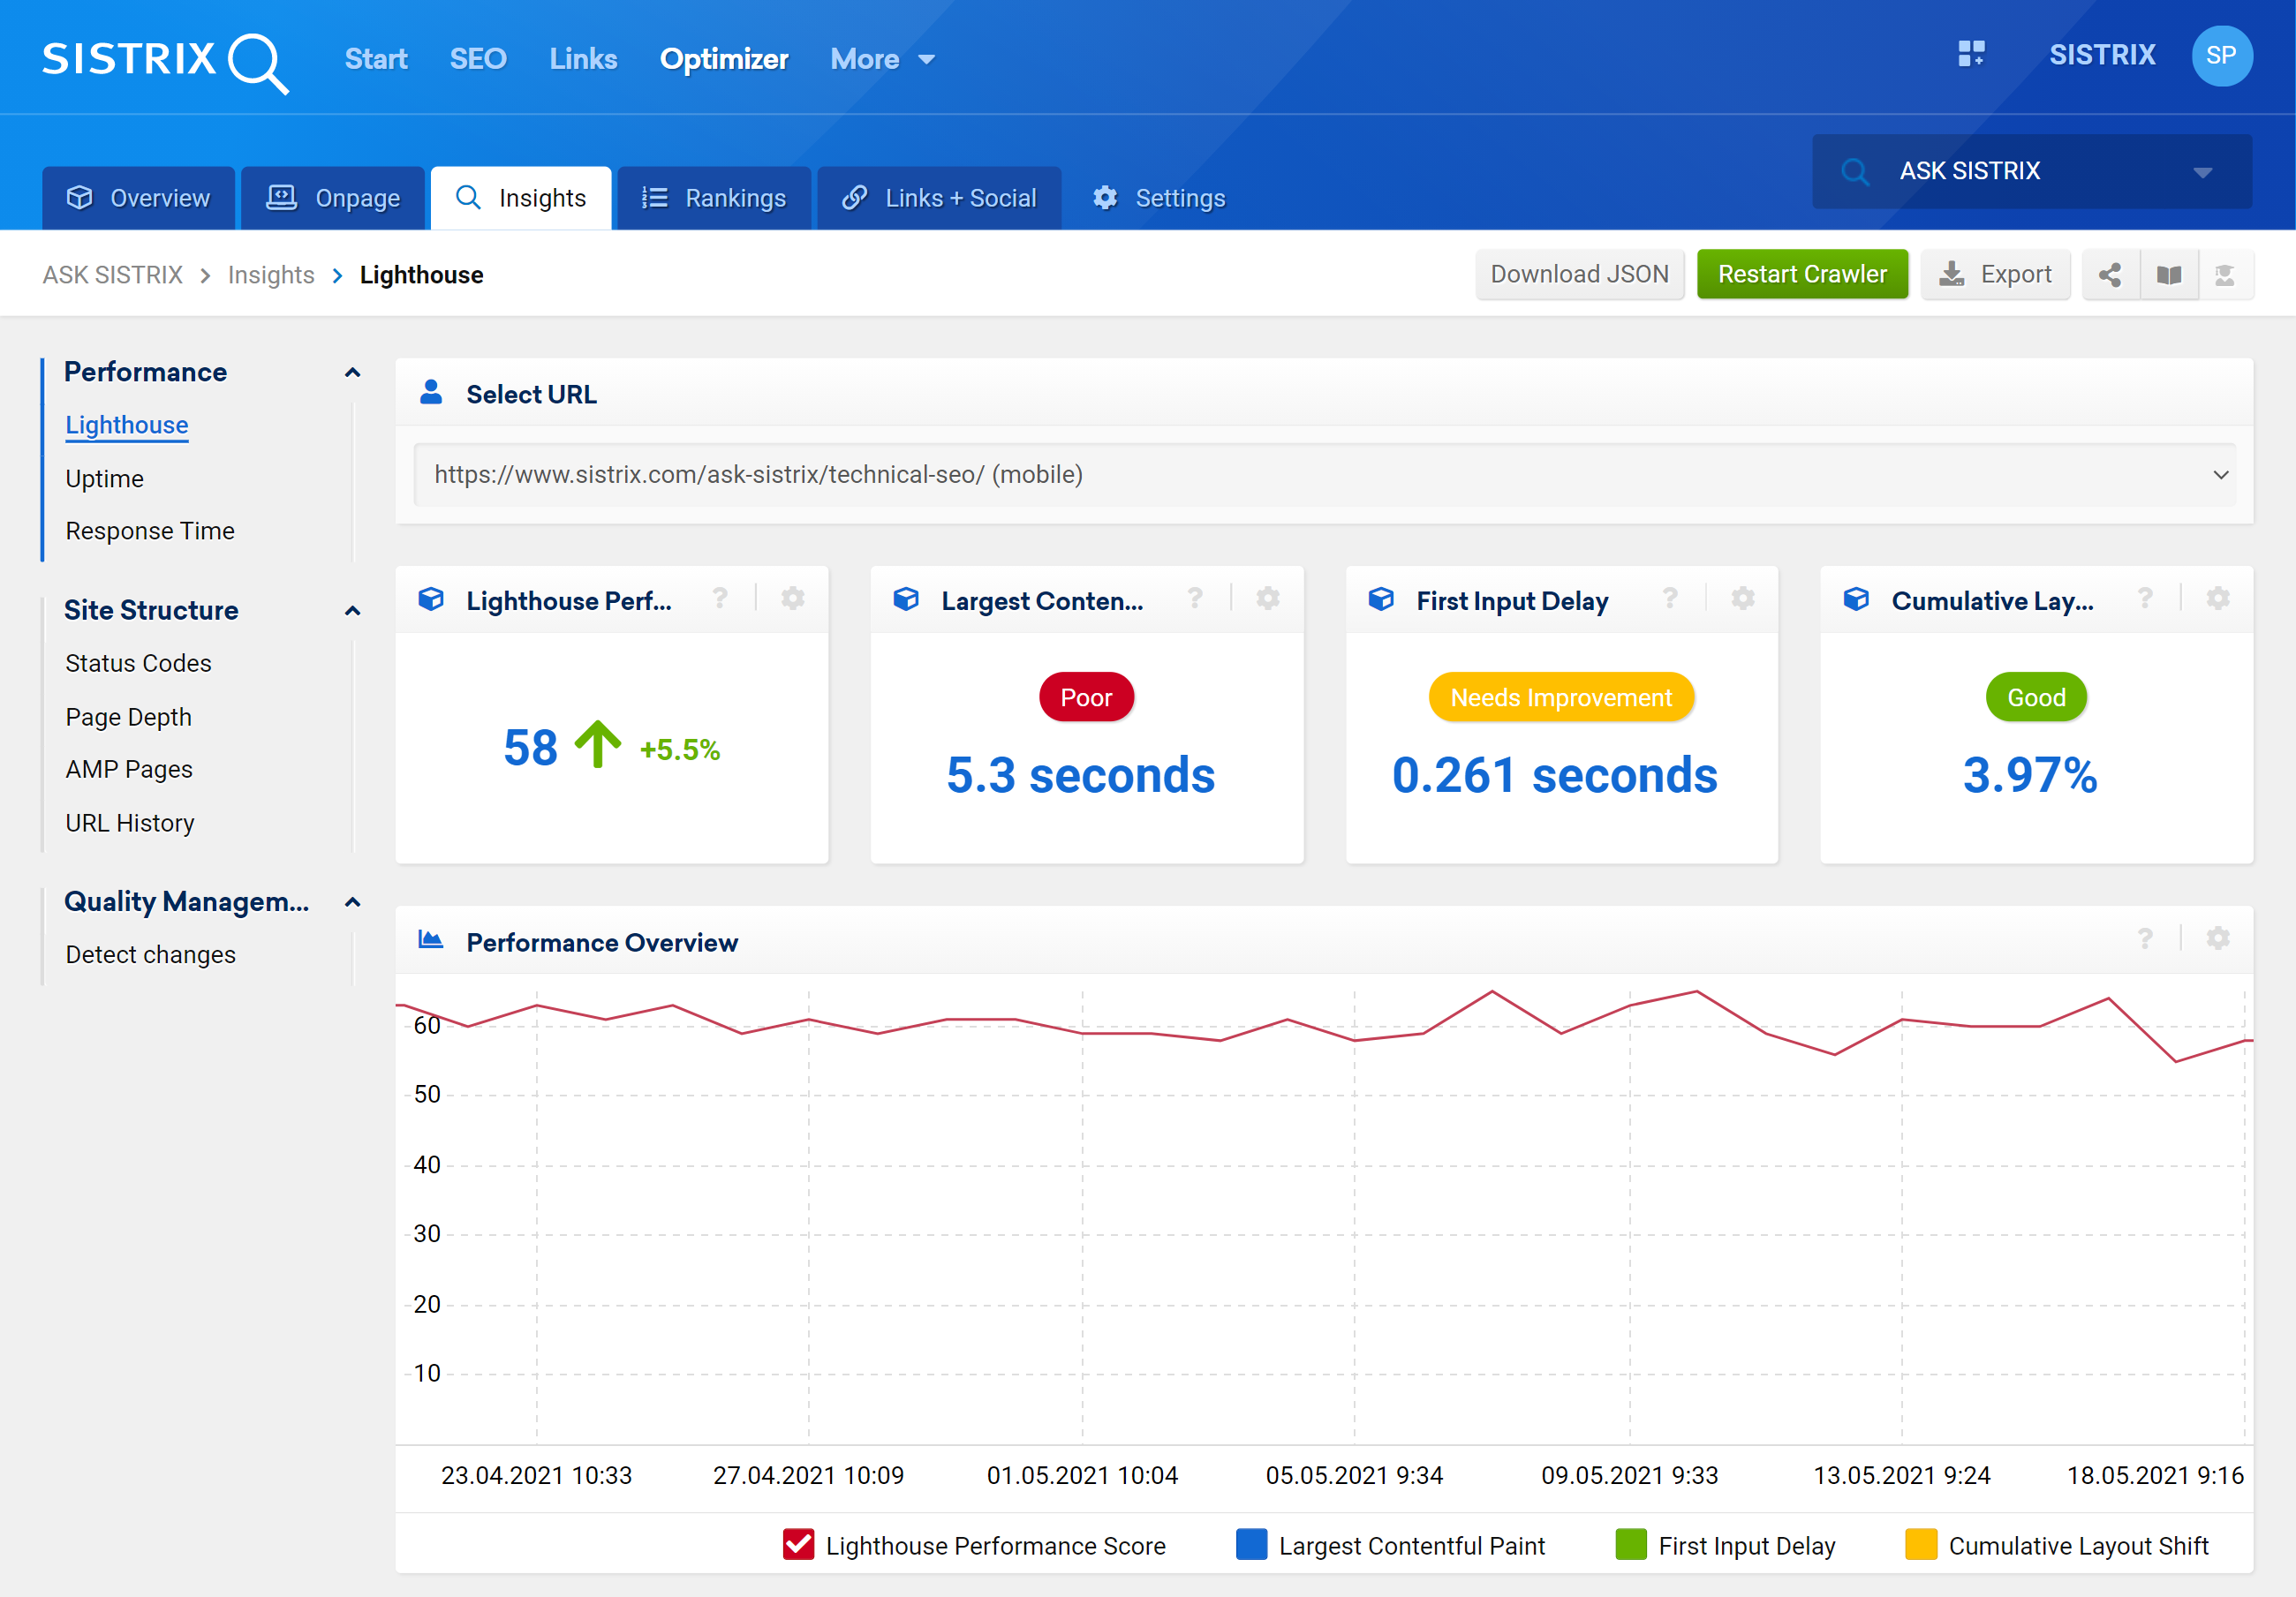
Load peaks or changes in the accessibility/load time of a website can be quickly identified using the optimiser and you can set the query for other subpages of your domain.