
PageSpeed Insights is a tool from Google that evaluates the loading speed and behaviour of a page on mobile and desktop devices and, depending on the results, provides concrete suggestions for improvement.
Discover how SISTRIX can be used to improve your search marketing. 14 day free, no-commitment trial with all data and tools: Test SISTRIX for free
What is Google PageSpeed Insights?
PageSpeed Insights is a Google tool that measures the loading time of a URL, calculates a score and analyses the website for potential improvements. The nice thing about it is that any URL can be entered and checked here.
What do Google PageSpeed Insights measure?
PageSpeed Insights combines the field data, i.e. the data gathered by Google’s Chrome User Experience Report (abbreviated CrUX), with the lab data about a page that is collected by Lighthouse. You can switch between the results for mobile and desktop views.
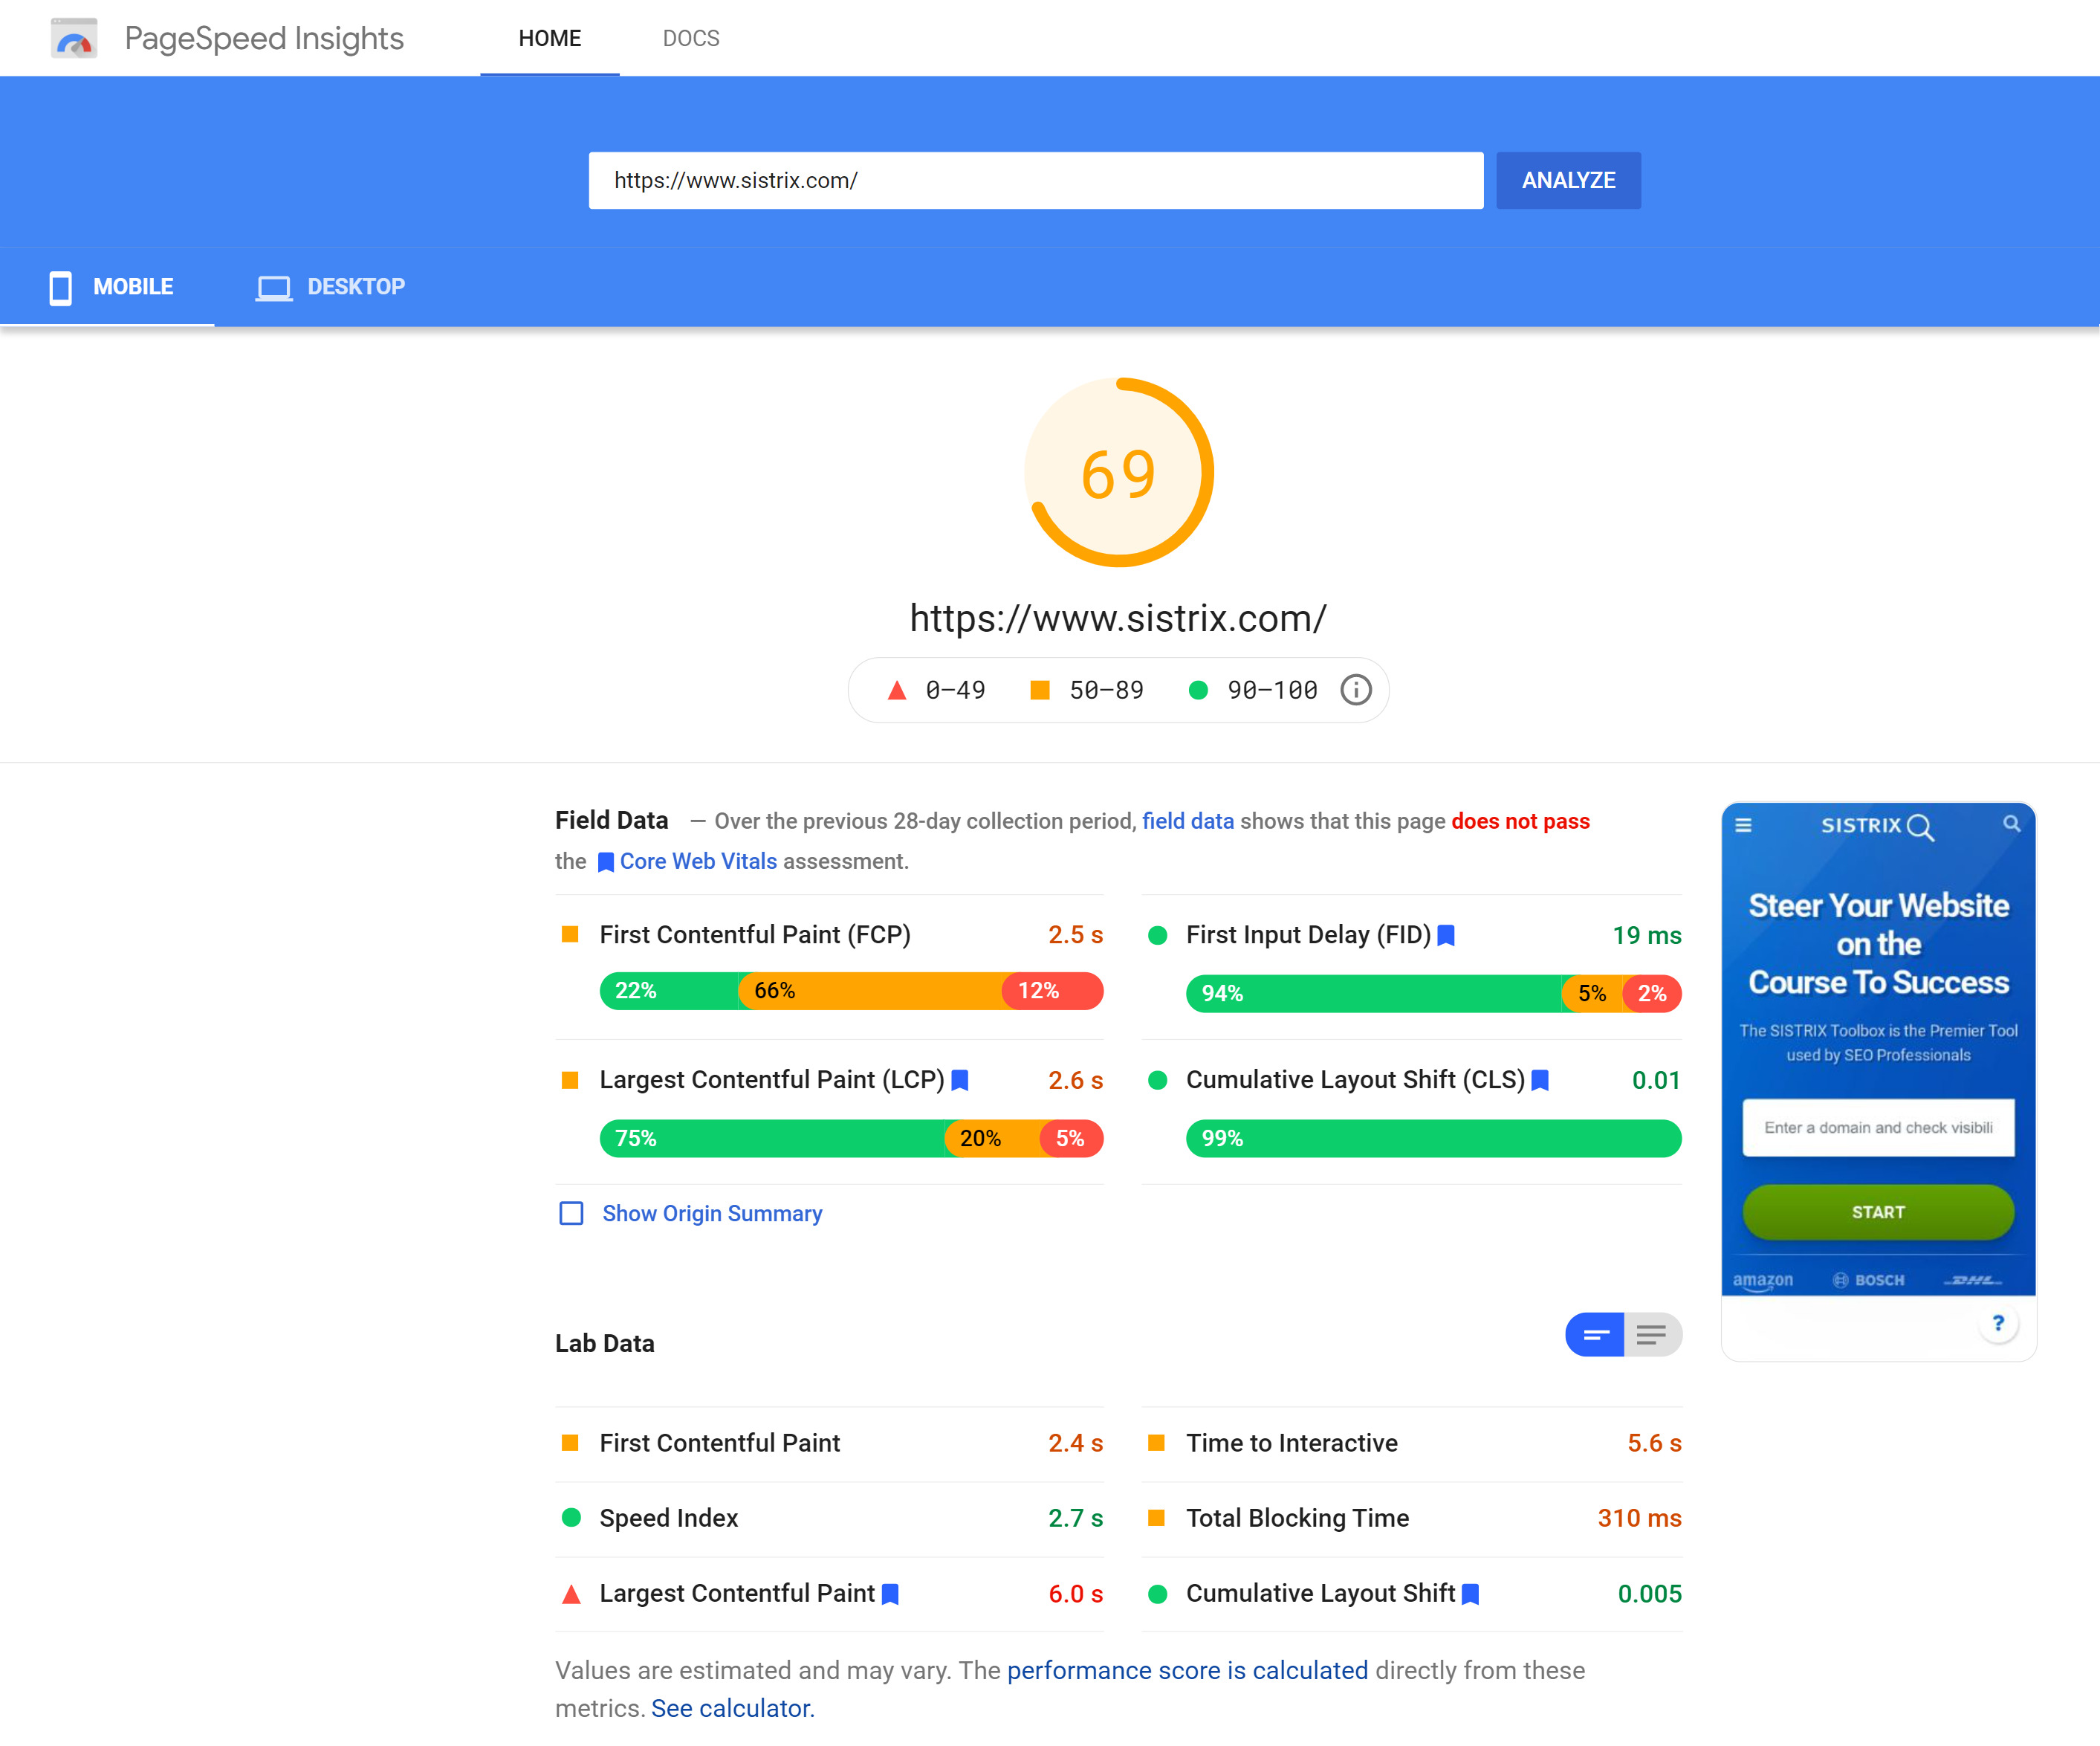
As soon as Google has carried out the evaluation, the PageSpeed score is displayed on a scale from 0 to 100. This should help provide a rough assessment of your page’s performance. This performance value is a weighted average of different metrics. This means that more heavily weighted metrics have a greater impact on the overall rating.
The individual weightings are not visible in the Lighthouse report but can be viewed in the so-called “Lighthouse Scoring Calculator“. This tool can be used to calculate the PageSpeed score for any data collected by the user.
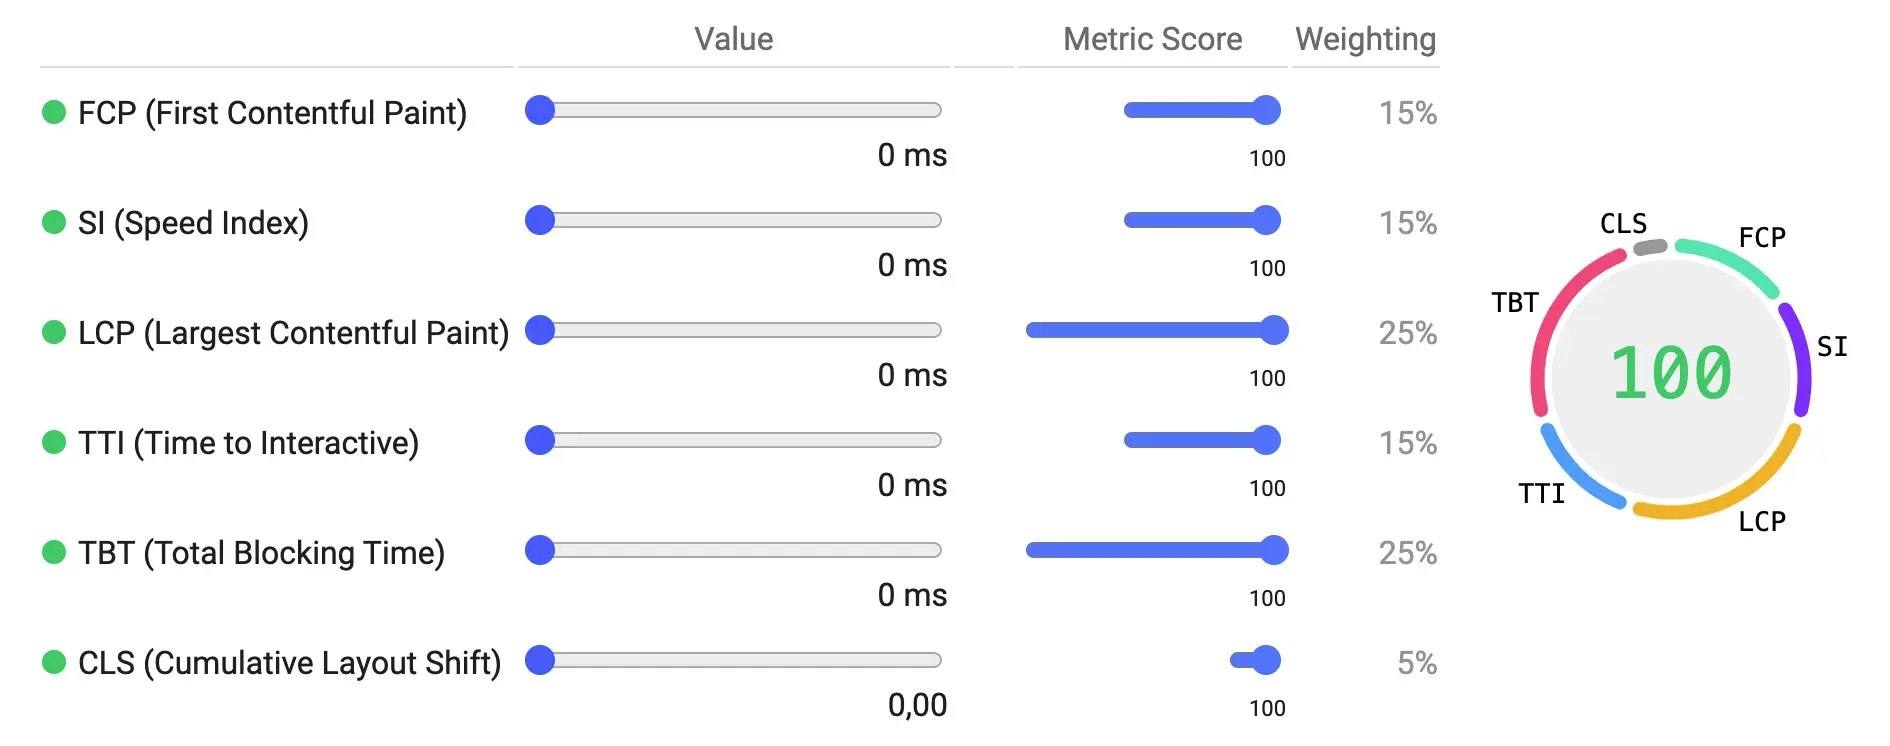
The weightings are chosen to provide a balanced representation of the user’s perception of performance. The weightings have changed over time as the Lighthouse team regularly conducts research and collects feedback to understand what has the greatest impact on user-perceived performance. The history of these changes can be viewed on GitHub.
Additionally, if you would like to find out how your site fares in comparison to other websites in terms of real user data, you can use our PageSpeed Test.
Page speed: field data from the Chrome User Experience Report
The first piece of information is the field data from the CrUX, if available. The evaluations refer to the values for “First Contentful Paint (FCP)”, “First Input Delay (FID)”, “Largest Contentful Paint (LCP)” and the “Cummulative Layout Shift (CLS)”.
These values are divided into three categories:
- Fast (green)
- FCP: lies between 0 and 1 second.
- FID: is between 0 and 0.1 seconds.
- LCP: is between 0 and 2.5 seconds.
- CLS: the change is between 0 and 10 per cent.
- Average (orange)
- FCP: lies between 1 and 3 seconds.
- FID: lies between 0.1 and 0.3 seconds.
- LCP: lies between 2.5 and 4 seconds.
- CLS: the change is between 10 and 25 per cent.
- Slow (red)
- FCP: is more than 3 seconds.
- FID: is more than 0.3 seconds.
- LCP: is more than 4 seconds.
- CLS: the change is more than 25 per cent.
The FCP measures the time it took for the browser to render the first text or load the first image, which can also be the background image or an SVG. This value should show approximately when the user could interact with the website for the first time.
The FID value is the time between a user’s first interaction with the page (by clicking on a link, button or other input) and when the browser can actually perform that interaction. This value is a measurement of how interactive and responsive users think the page is.
The LCP looks at when the largest element of the page has finished rendering. It can be assumed that this is the main content of the page and that users can use the actual content from this point on.
With CLS, Google looks at how much the content “jumps” during loading. This often happens when images are reloaded, or advertisements take longer to be displayed. The less the layout jumps around, the more pleasant it becomes for visitors to consume content.
Below the four data points there is the sub-item “Show Origin Summary“. By clicking here, the above values can be displayed at domain level instead of URL level.
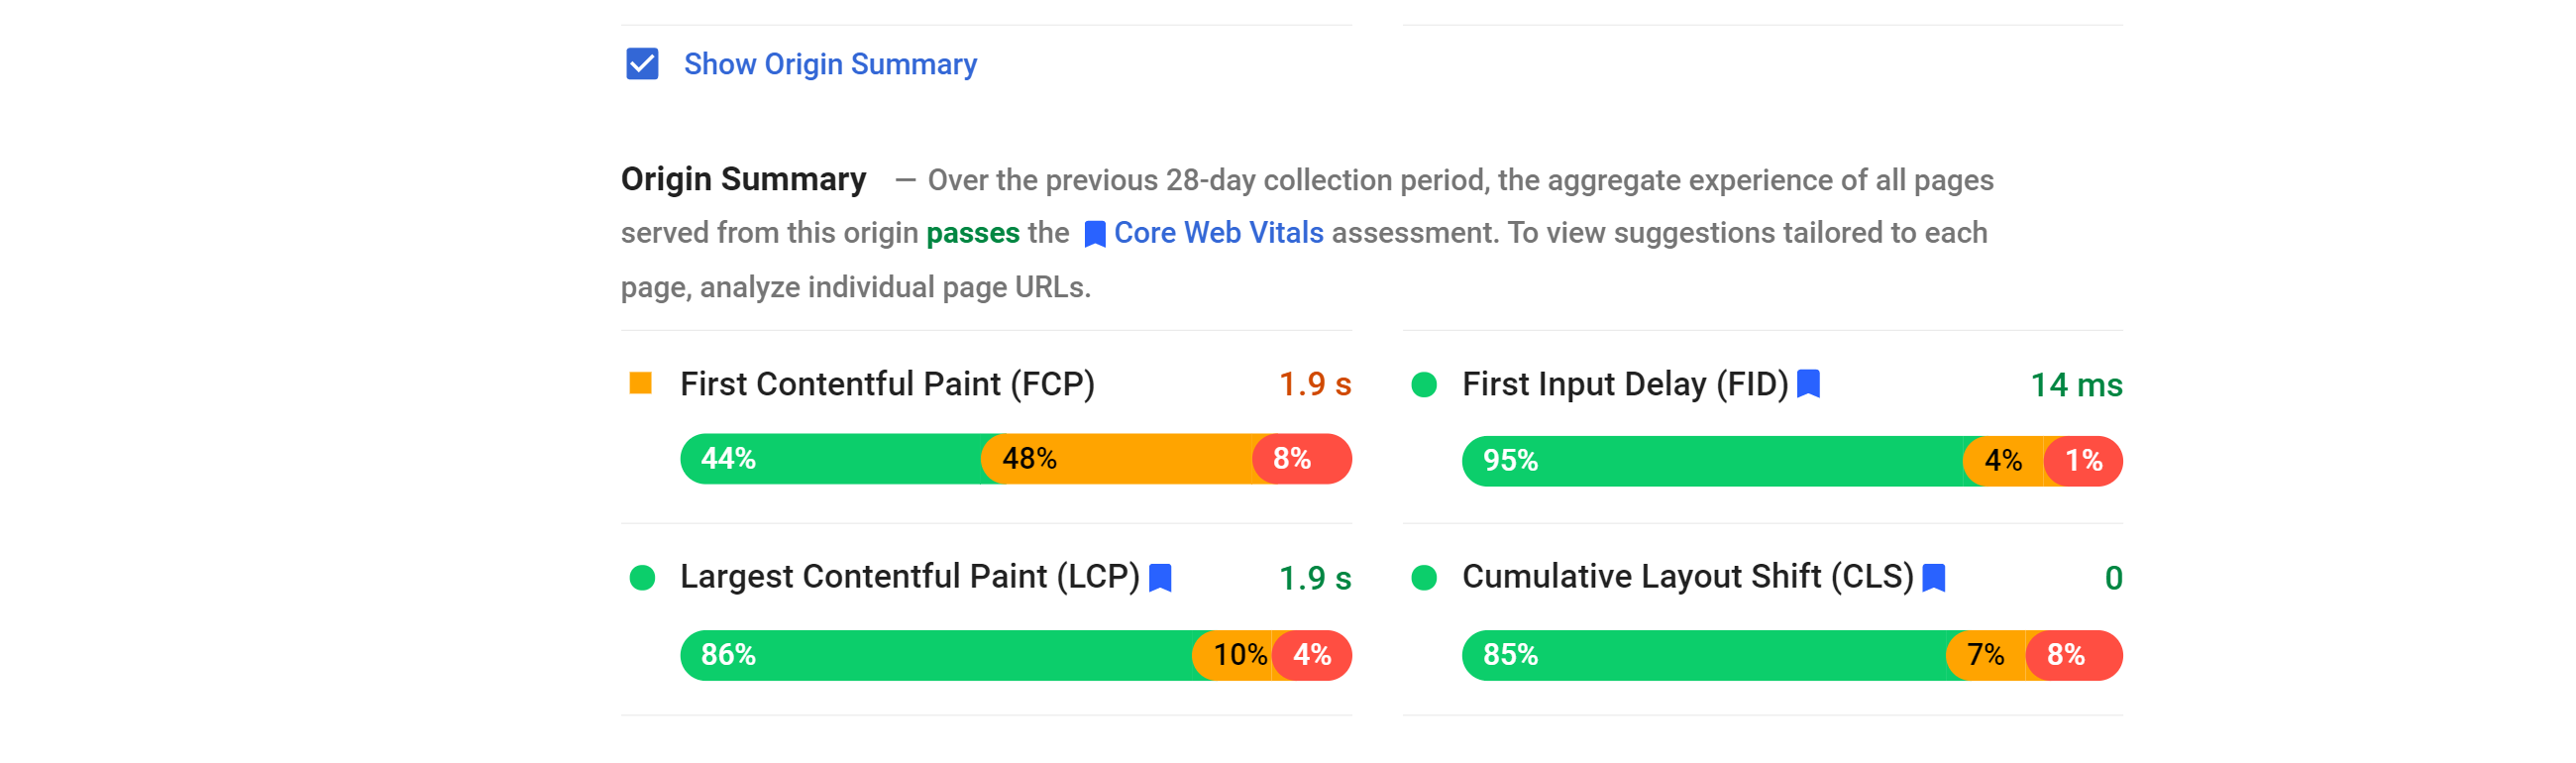
It may well be the case that there is not enough data in the CrUX data set for a specific URL. In this case, Google will indicate this in a note and show the “Origin Summary” data.
Optimisation potential: Lab data through Lighthouse
The values in the “Lab data” sub-item are about how well the URL performs in general performance best practices. For this purpose, Google crawls the URL with its Lighthouse test suite.
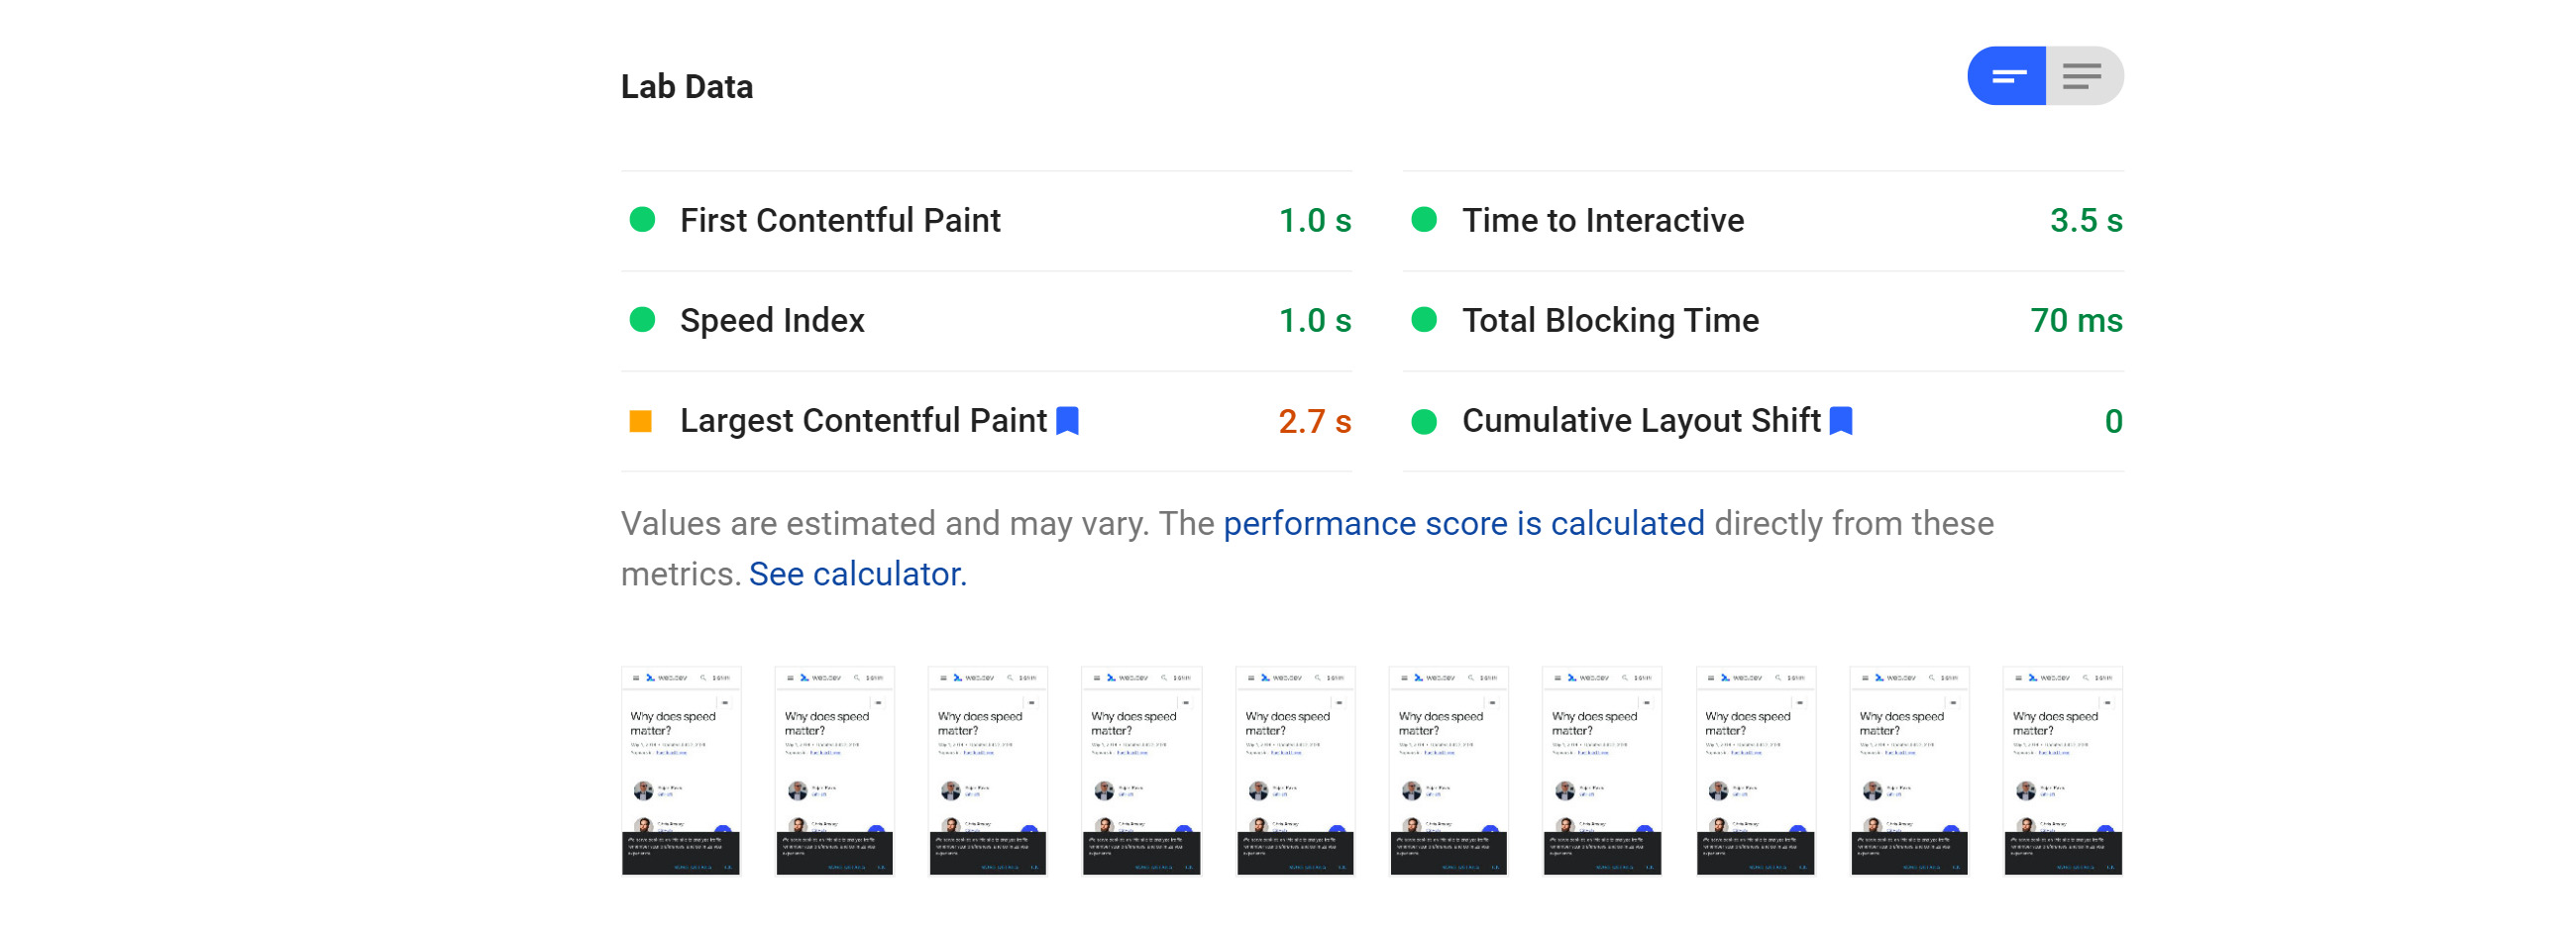
As with page speed, various metrics are also divided into Fast, Average and Slow for the lab data.
Here, too, there are evaluations of the First Contentful Paint (FCP), the Largest Contentful Paint (LCP) and the Cumulative Layout Shift (CLS). In addition, there is the Time to Interactivity (TTI), the Speed Index and the Total Time to Block (TBT).
Although FCP, LCP and CLS appear in the laboratory and field data, there are different thresholds for FCP and LCP.
- Fast (green)
- FCP: is between 0 and 2 seconds.
- Speed Index: lies between 0 and 4.3 seconds.
- LCP: lies between 0 and 2 seconds.
- TTI: lies between 0 and 3.8 seconds.
- TBT: lies between 0 and 0.3 seconds.
- CLS: the change is between 0 and 10 percent.
- Average (orange)
- FCP: lies between 2 and 4 seconds.
- Speed Index: lies between 4.4 and 5.8 seconds.
- LCP: lies between 2 and 4 seconds.
- TTI: is between 3.9 and 7.3 seconds.
- TBT: lies between 0.3 and 0.6 seconds.
- CLS: the change is between 10 and 25 per cent.
- Slow (red)
- FCP: is more than 4 seconds.
- Speed Index: is more than 5.8 seconds.
- LCP: is more than 4 seconds.
- TTI: is more than 7.3 seconds.
- TBT: is more than 0.6 seconds.
- CLS: the change is more than 25 percent.
The evaluation also shows screenshots of the course of the page construction, a practical feature from Lighthouse. In this view, however, the time information of the screenshots that are available in the Lighthouse audit is not provided.
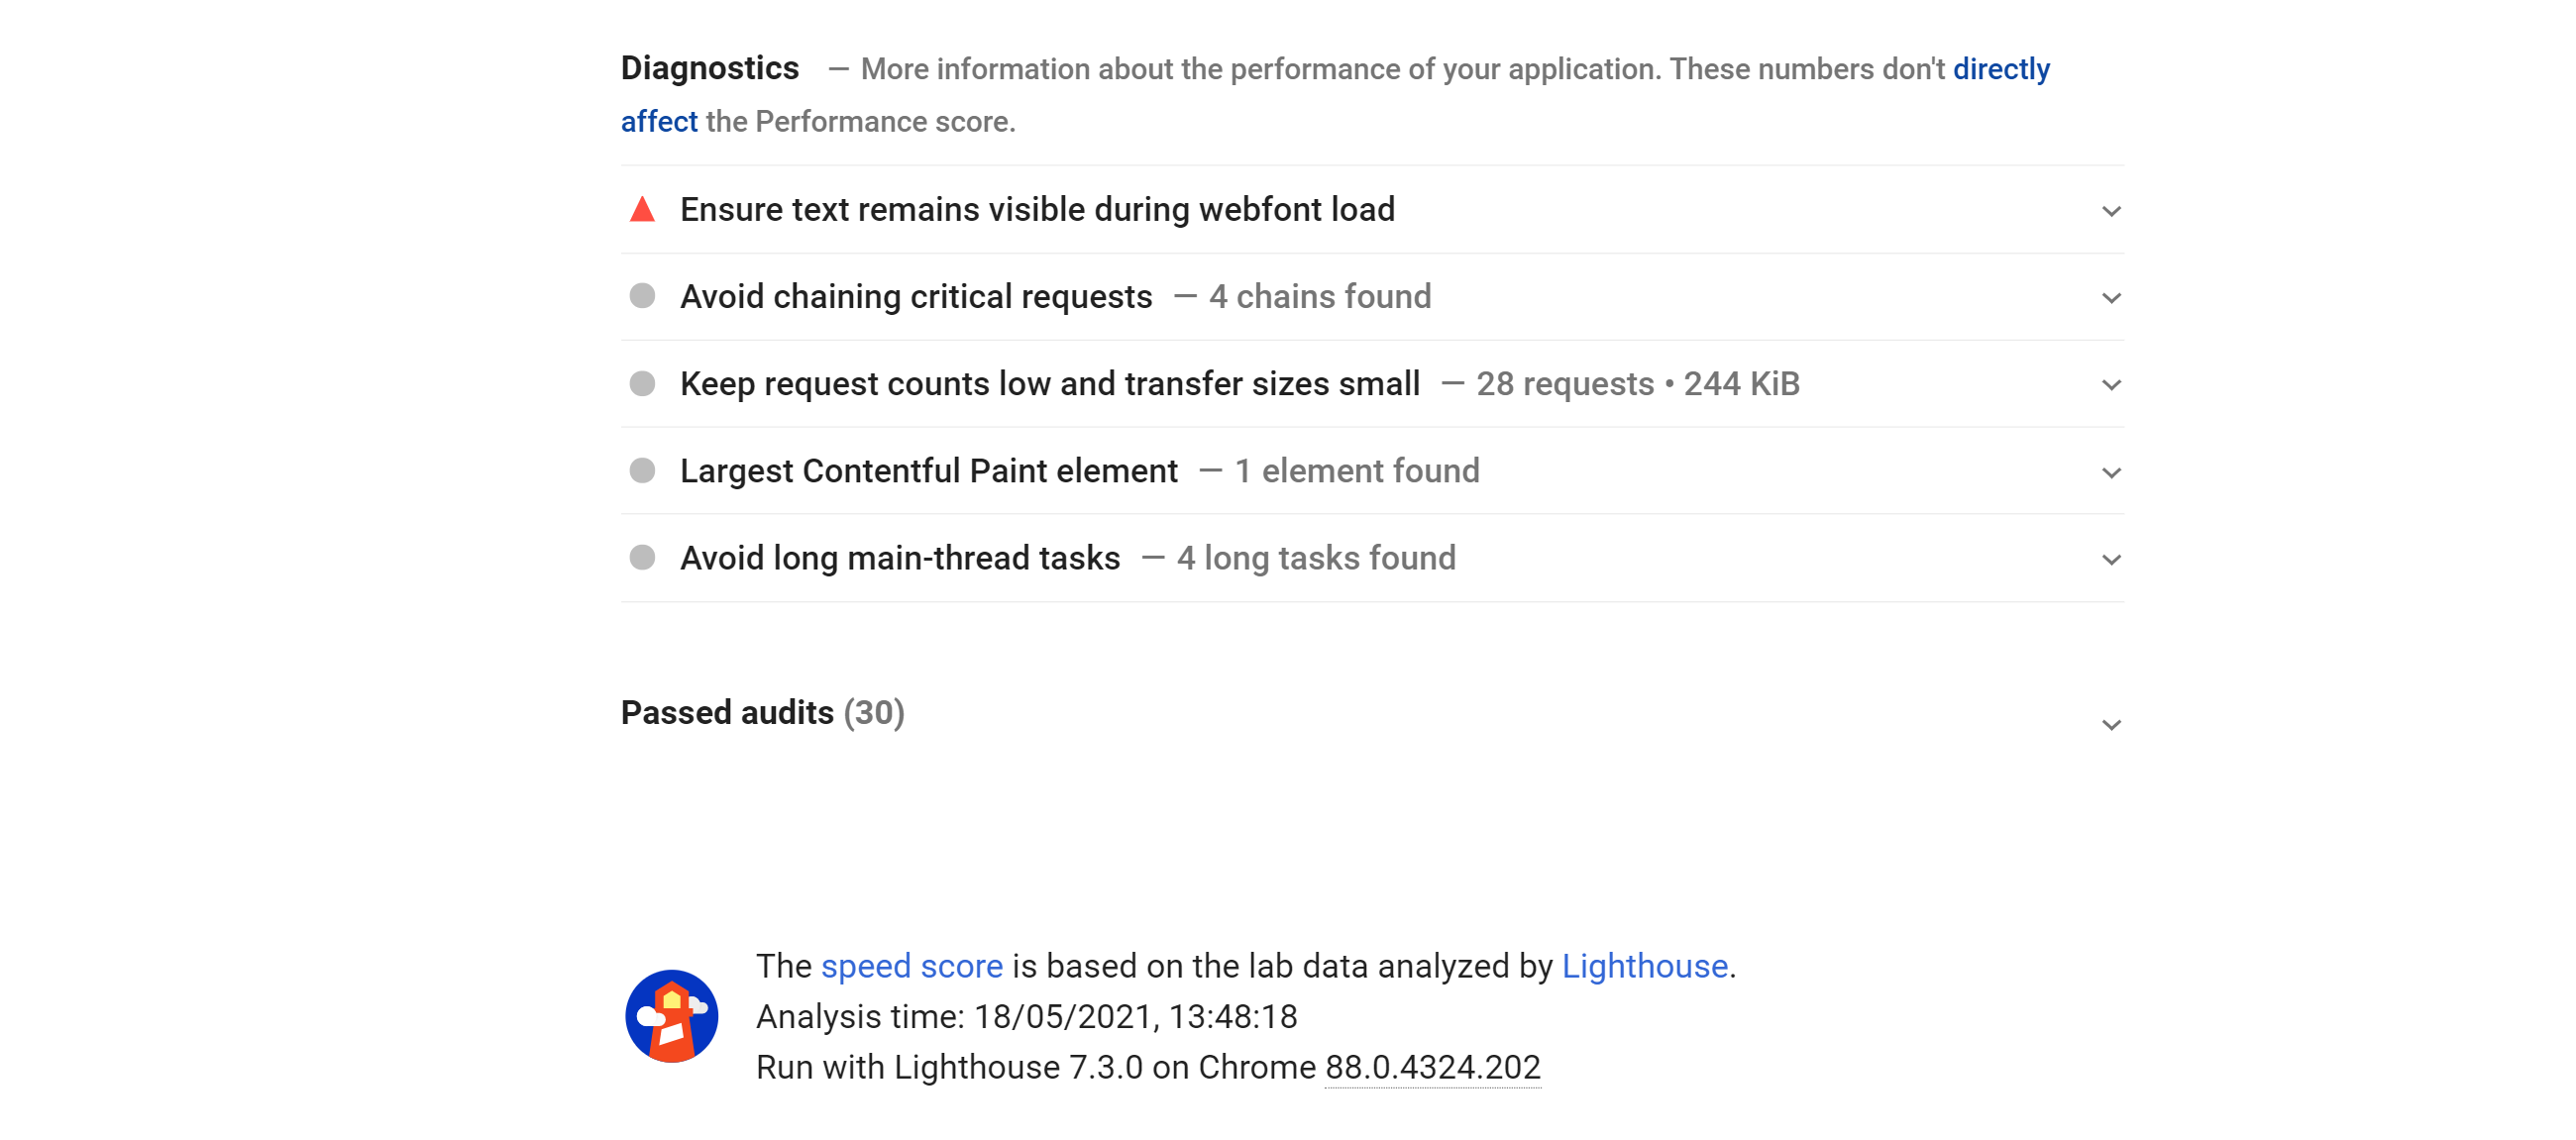
Recommendations
This section summarises areas of potential optimisation that Google says “may reduce page load time”.

Diagnosis
According to Google, the information in this part of the evaluation has no direct influence on the PageSpeed Insights Score, but provides further information on possible problems or best practice solutions.
Conclusion on Google PageSpeed Insights
PageSpeed Insights provide a good first overview of a specific URL and the associated loading time.
It is important to know that this is not the only Google service that analyses the loading time of a URL or domain.
One of the other sites is webpagetest.org, where very detailed analyses of the loading behaviour of a specific URL can be carried out.
If you use the Chrome browser, there is also the integrated audit tool “Lighthouse“, which can be used to check other facets of the page’s loading time.
Different Google services look at different speed metrics, so it is worth using not just one of these services but several to get a more comprehensive picture.
On Ask-SISTRIX, we also provide further information on how to best optimise your own website in terms of PageSpeed.
Test SISTRIX for Free
- Free 14-day test account
- Non-binding. No termination necessary
- Personalised on-boarding with experts