Ever since there has been such as thing as search engine optimization, the question of “How often are people clicking on each ranking position?” has been posed. Of course, there is no universal answer to this question – too many factors have a bearing on the click probability per position: the intention or the time of the search, the device used and many more. Despite this, people are regularly trying to give an answer and today, I would like to add another attempt. The charts are part of my lecture at this year’s SEODay in Cologne, Germany.
The following numbers are based on the new Google Search Console API. This allows data from the Search Console to be collected and processed automatically. We were the first tool provider to integrate this feature in our software, shortly after its release. Some of our customers have granted me permission to use their data for an anonymous and summarized evaluation – for which I would like to say thank you. Through this, 124,086,615 clicks from one week in September were accumulated.
While analyses regarding this topic all attempt to answer the same question, they are usually based on very different metrics. For this evaluation I will take a look at the organic clicks and examine on which ranking positions they occured. Advertisements, Universal Search integrations and other elements on the search result page therefore have no direct influence on the results, given that views/impressions are not taken into consideration. Hence, I will speak of click probabilities, not the CTR (click through rate). A direct comparison with the AOL data from 2008 is possible; this evaluation is based on the same method. Let us get started with a diagram of the click probability for the positions 1-100:
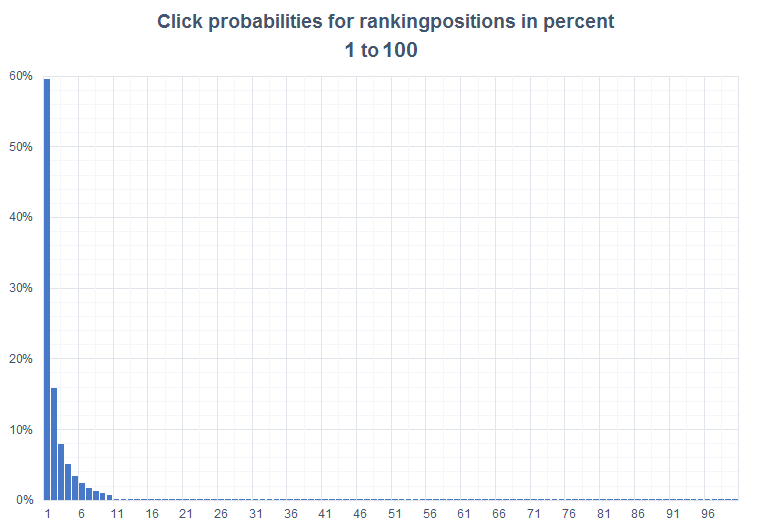
We can see plenty of white space with a little blue on the left edge. Excel has only plotted the blue pixels at the bottom out of sympathy, there is no factual basis for them. 99.1% of all organic clicks occur on positions 1-10. So, only 0.9% of the clicks are left for the remaining resultpages. In order to get a clearer view of the top positions, here we have the same diagram for the positions 1 to 11:
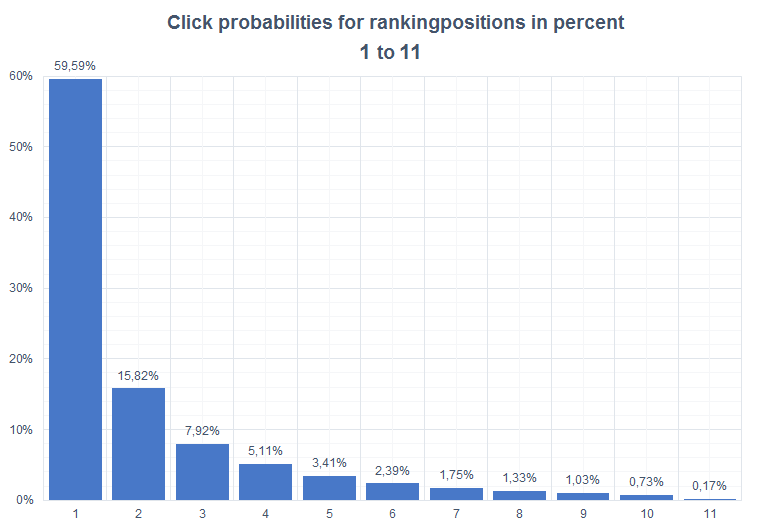
Almost 60% of all organic clicks happen on the first position. With around 15%, position 2 receives only a quarter of the clicks of position 1. Afterwards, the decline in click probability is no longer as rapid, but still clear. The first ranking on page 2 (position 11) receives only 0.17% of all organic clicks. The next evaluation becomes a little more colorful: in addition to the mean value of the above data, I have added the click probability by device category:
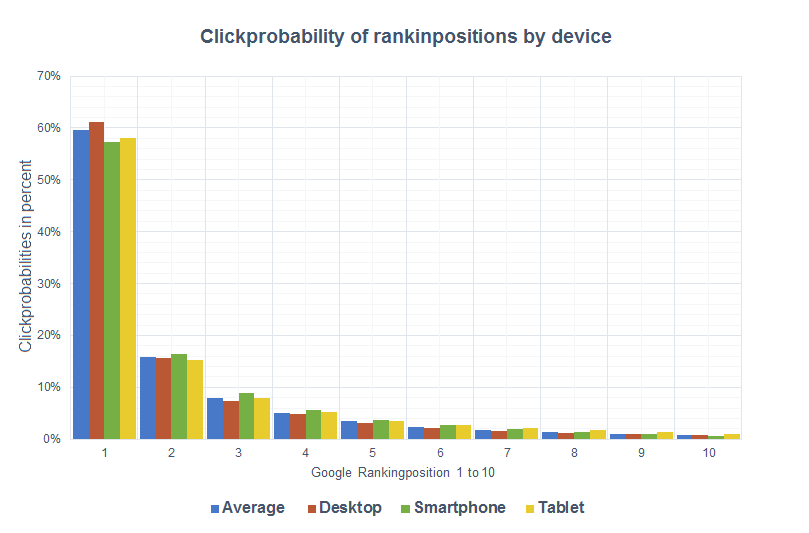
The click probabilities are close to equally spread on the different device categories (desktop, smartphone and tablet). As there are no great differences immediately apparent, I have graphed the deviation of the three device categories from the mean:
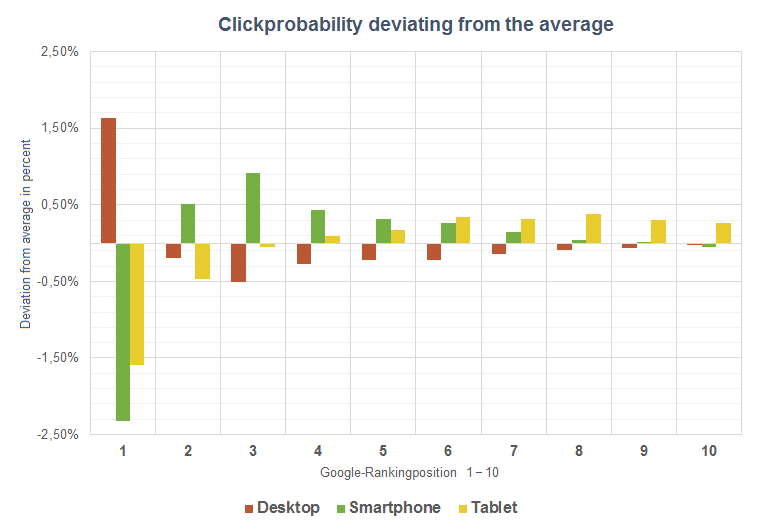
Interestingly, desktop users click on the first hit at a higher than average rate, while tablet and especially smartphone users are more likely to click on the next positions. A result that I would not have expected. Lastly, here is the evaluation of the click probability for position 1 by country:
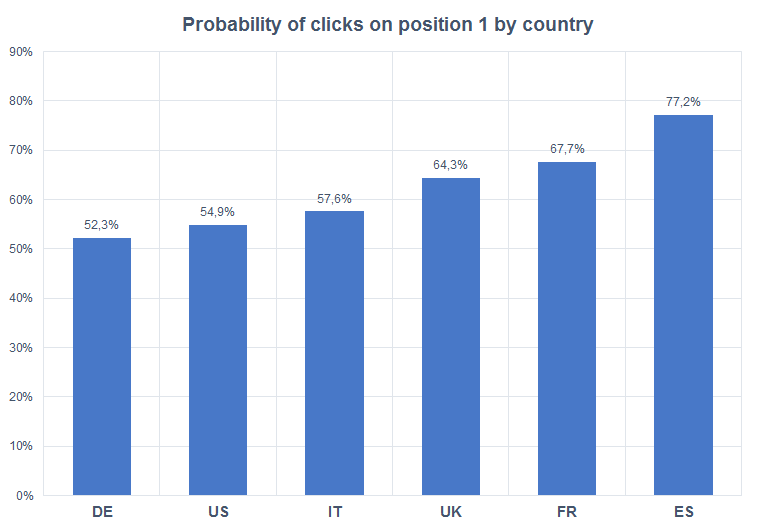
While we Germans are rather cautious and mistrustful, the French and Spanish click more frequently on the first result. In comparison with the AOL data from 2006, the change is, incidentally, rather minimal: Back then, about 42% of all users in the US clicked on the first organic result, today that number is only 10% higher.