
2021 was a difficult year to compete for organic search visibility. Not only did Google launch a variety of major algorithm updates throughout the year, but the SEO landscape also became significantly more competitive. The second year of the coronavirus pandemic and continued lockdowns resulted in many brands shifting their resources towards SEO, while search engines grappled with ensuring that only the most relevant, trustworthy, authoritative results rose to the top.
- Methodology
- International ccTLDs
- YMYL (Your Money, Your Life) Publisher Sites
- UGC (User-Generated Content)
- Product Review Websites
- Vacation & Travel Sites: Competitors to Google?
- Educational Sites & Lessons for Kids
- Ecommerce Sites
- List of losing domains (Absolute and Percentage)
- IndexWatch 2021 Winners and Losers in other countries
Where there are SEO winners, there must also be losers. As a reminder, not all declines in organic visibility are the direct result of a failed SEO strategy; many losses can be explained by Google (and its users) deciding another type of content is more relevant. These types of intent shifts are common during core updates and can wreak havoc on the visibility of many sites, despite the sites doing nothing wrong or, in some cases, making any changes at all.
Below is a list of the 250 domains that saw the greatest declines in SEO visibility throughout 2021, both in terms of absolute gains and percentage declines.
Methodology
We have identified the 250 domains with the greatest visibility declines – both in percentage and in absolute terms using the SISTRIX Visibility Index, which indicates a value for how visible a domain is in Google’s search results.
SISTRIX measures rankings of over 100 million domains for 100 million keywords on Google. The data below will focus specifically on Google’s U.S. index (Google.com).
By actively measuring the rankings across a representative keyword set, the SISTRIX data is free from external influences such as seasonality, the weather, vacation times and other external factors and trends.
The data shown below is collected from mobile search rankings only.
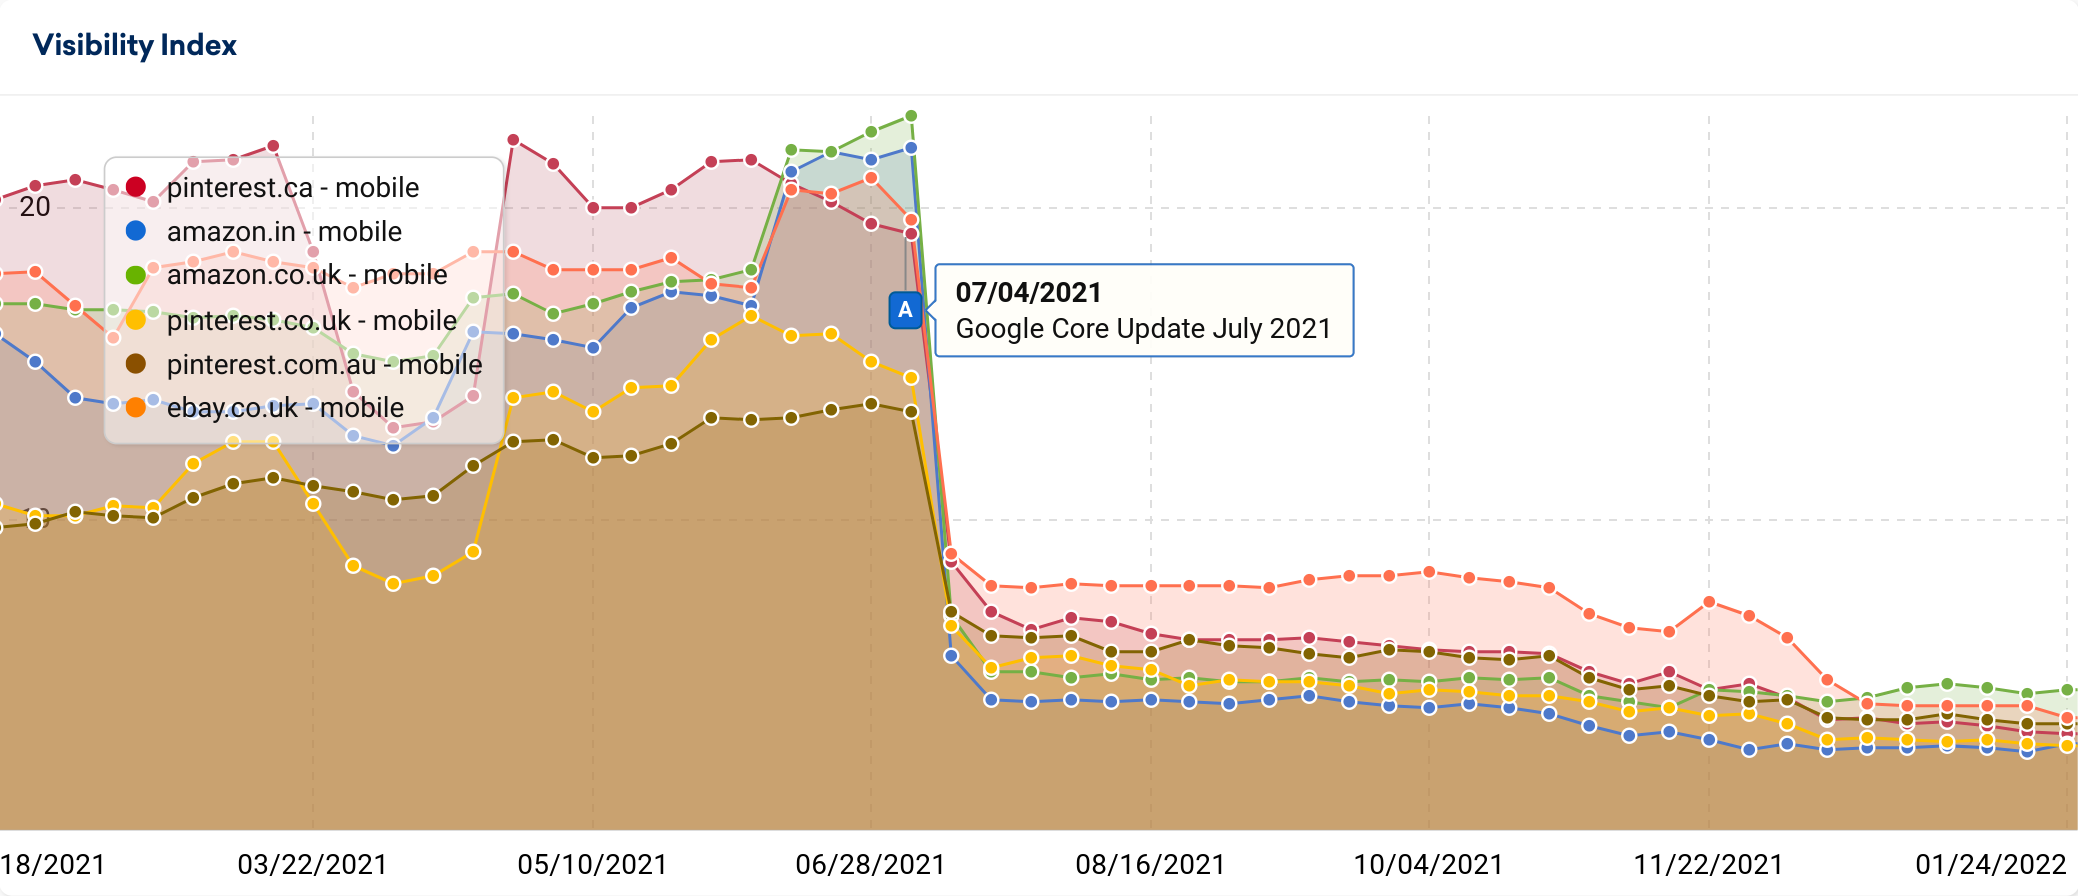
International ccTLDs
Recent Google algorithm adjustments appear to have reduced the visibility of various non-U.S. ccTLDs across several notable brand properties — many of which had previously seen significant U.S. traffic to their international websites. Examples of this include Pinterest (Canada, Ireland, Spain, Mexico, UK, Germany, and Australia), Amazon (India and UK), TripAdvisor (New Zealand) and eBay (UK). The majority of this drop occurred during the July Core Update, when Google rolled back the visibility of these non-U.S. ccTLDs.
YMYL (Your Money, Your Life) Publisher Sites
Several large scale publisher sites in YMYL categories (your money, your life), who had benefited greatly from core updates of recent years, saw declines in 2021. Some examples of this include Healthline, Money Under 30, Medicine Net, The Balance, and What to Expect. While these publishers go above and beyond to create high-quality content and demonstrate good E-A-T in their respective verticals, they were often outranked by authorities such as government sites, nonprofit organizations, science journals and other first-hand sources of medical and financial information.
Google may be becoming better at understanding who are the true authorities, who they might choose to prioritize over the publishers referencing them, especially for highly sensitive, YMYL queries.
For example, Healthline, which has grown tremendously in visibility in recent years, saw declines starting with the June Core Update. Here is a view into high-volume keyword losses they saw in the period afterward, many of which continued ranking on the first page, but in lower positions:
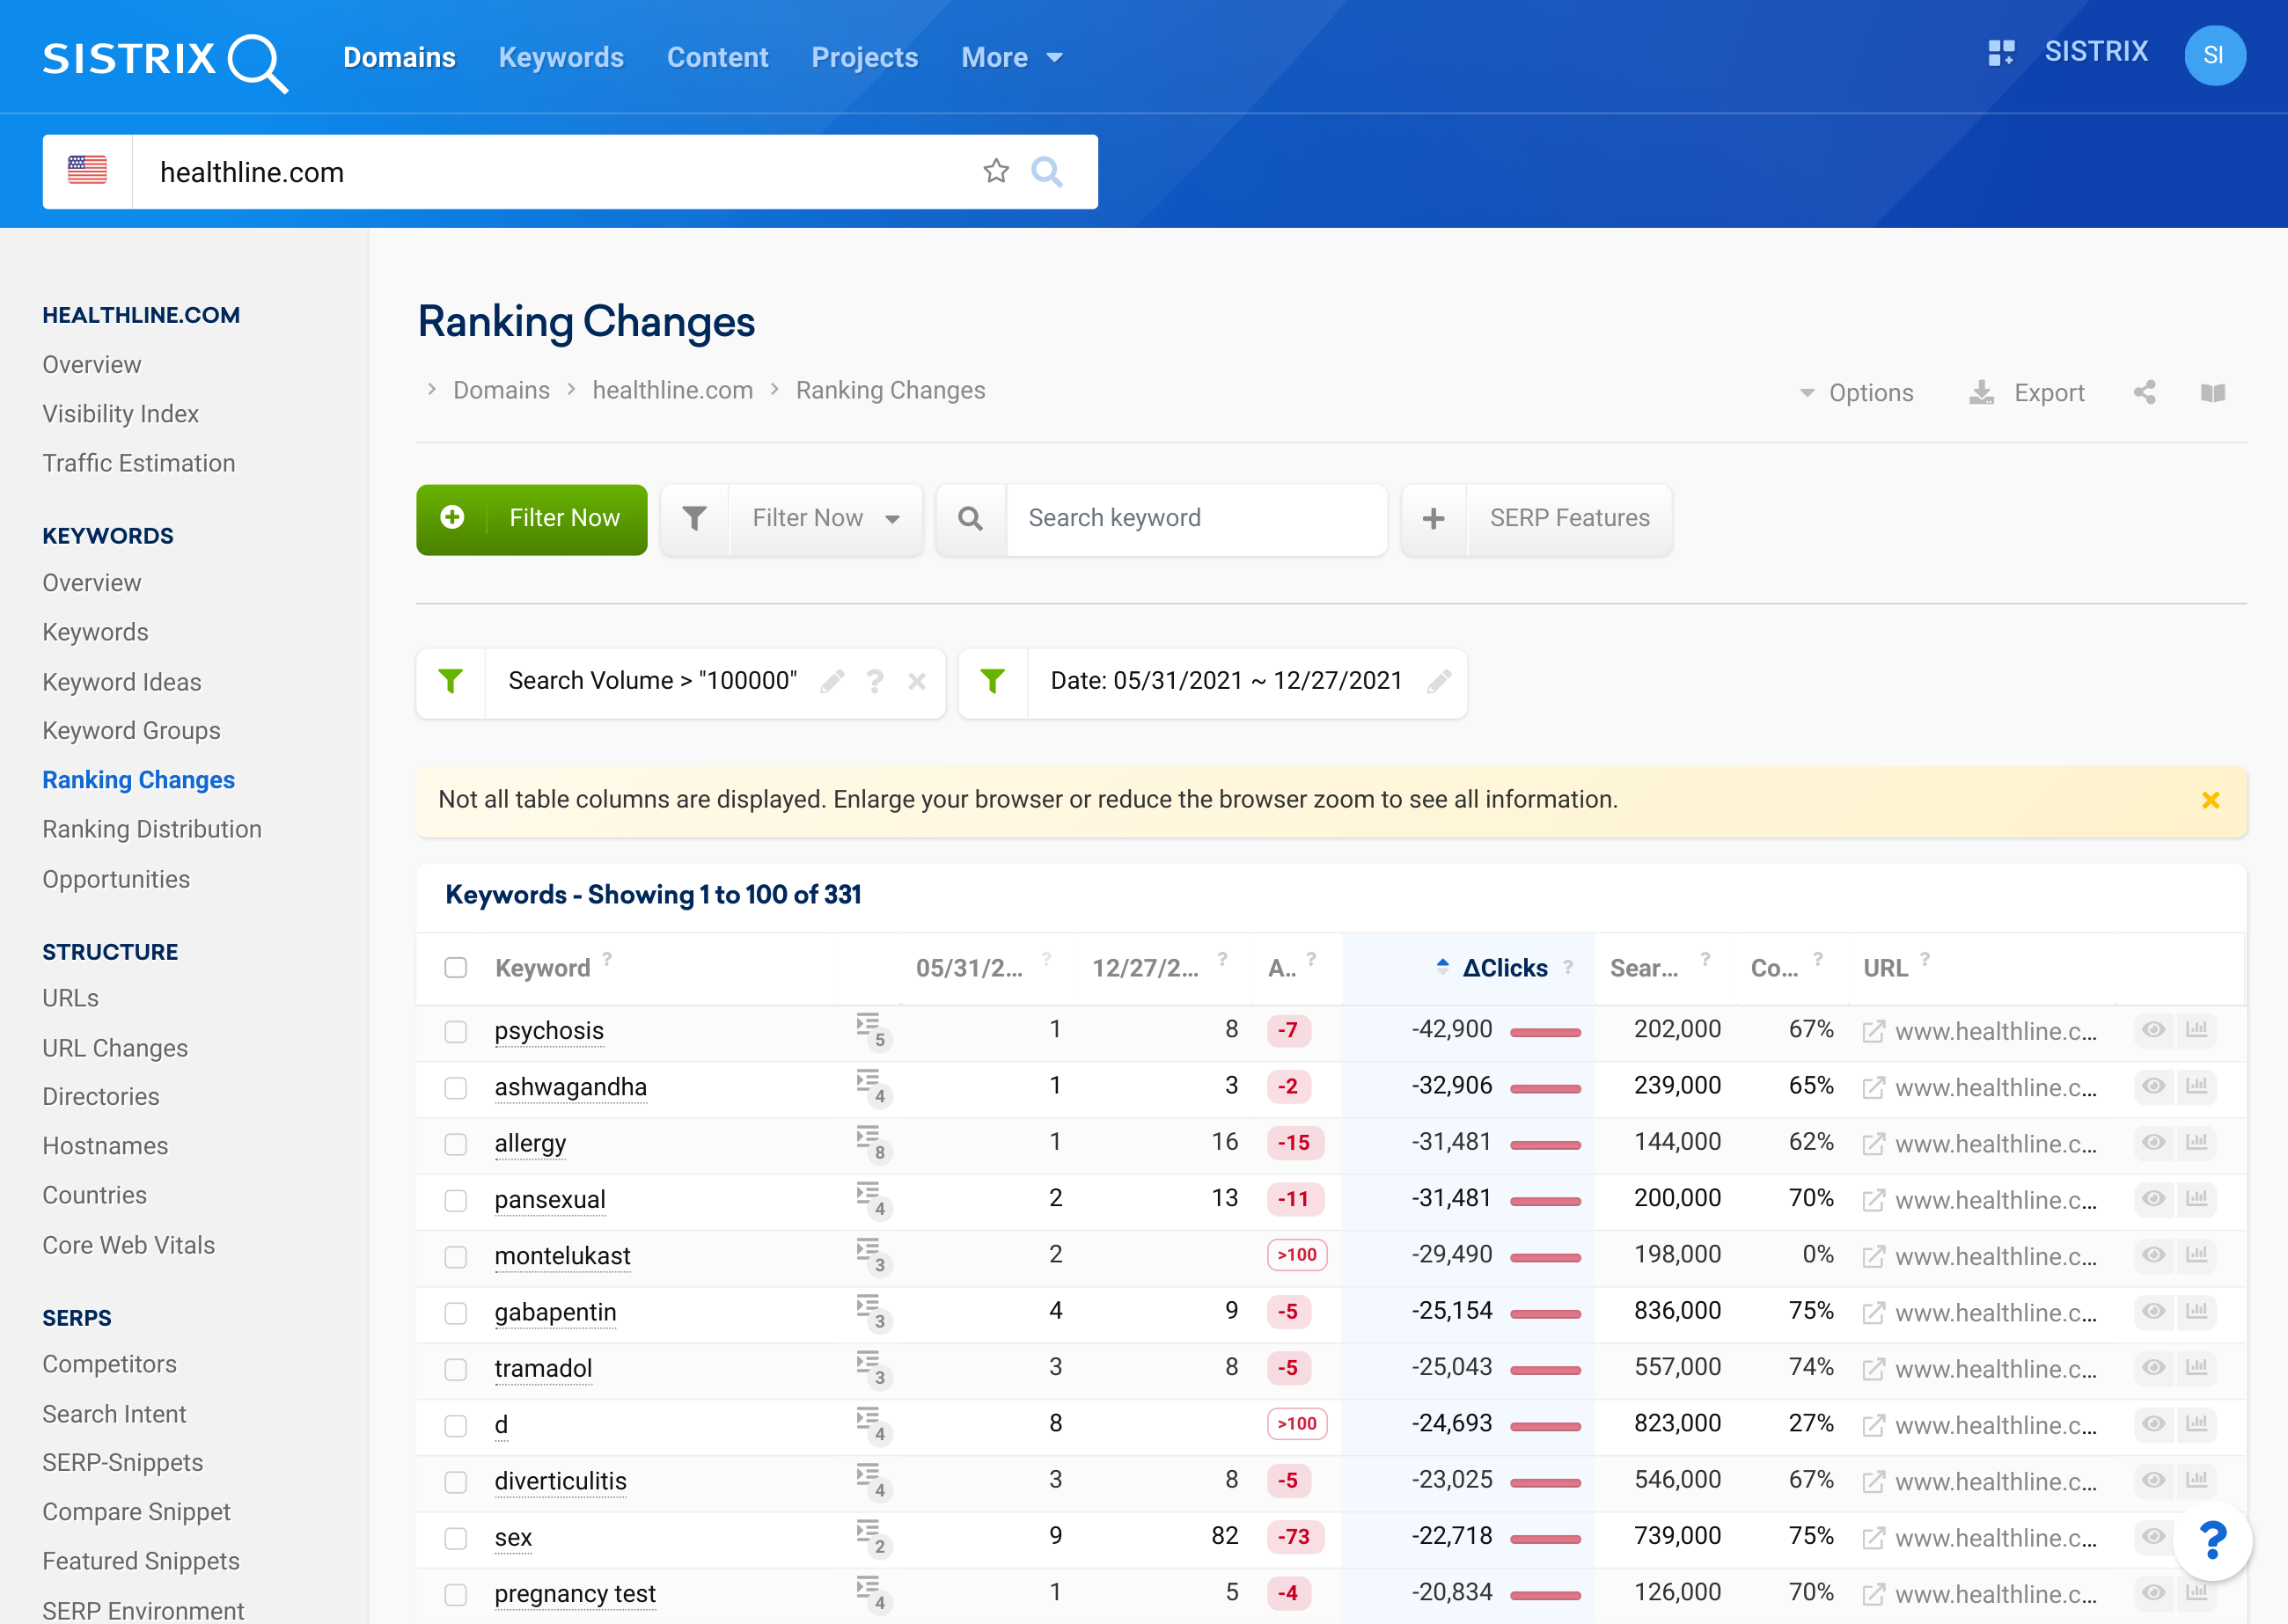
By looking at who outranked Healthline for these terms, it can help illuminate what Google may have been hoping to achieve with its core updates.
For the keyword “allergy,” which generates 144,000 searches per month, Healthline moved from position 1 to position 14. It was outranked by highly-authoritative organizations with significant subject-matter expertise on allergies, such as:
- Medline Plus (a government website)
- WebMD
- The Mayo Clinic
- American Academy of Allergy, Asthma & Immunology
- American College of Allergy, Asthma, & Immunology
- The Allergy & Asthma Network
- Cleveland Clinic

In another example, Healthline was previously ranking #1 for the keyword “psychosis,” which generates 202,000 searches per month. By the end of 2021, it had moved to position 8.
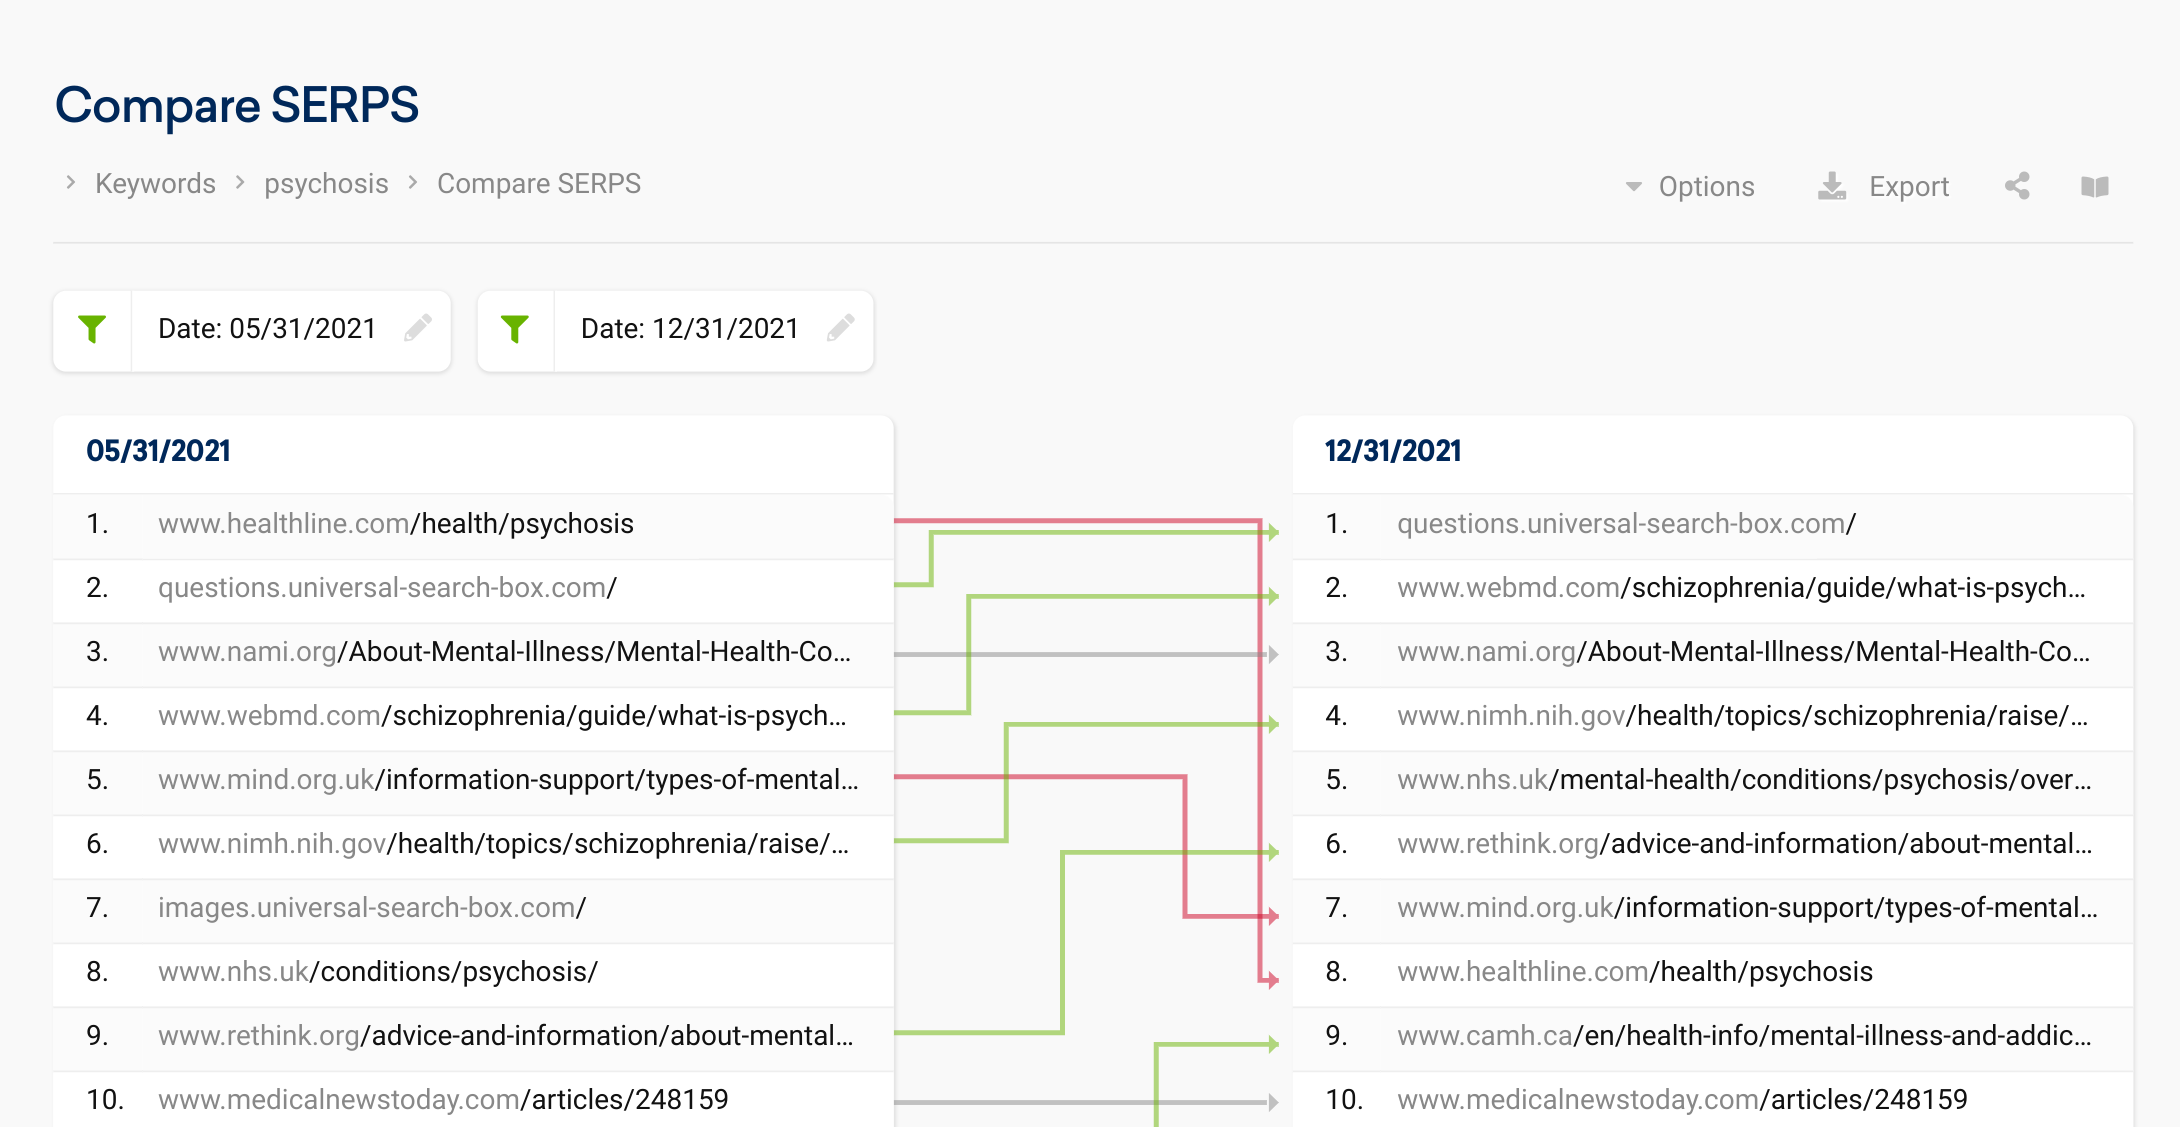
The sites that remained or moved into top positions show significant subject-matter expertise and authoritativeness on mental illness, such as:
- WebMD
- National Alliance on Mental Illness
- National Institute of Mental Health
- National Health Service (UK)
- Rethink Mental Illness
- Mind
In these and many other similar examples, it seems evident that Google is preferring true authorities with focused subject-matter expertise on specific medical conditions. This could be a more refined version of E-A-T being incorporated into Google’s algorithms than what we’ve seen in years past.
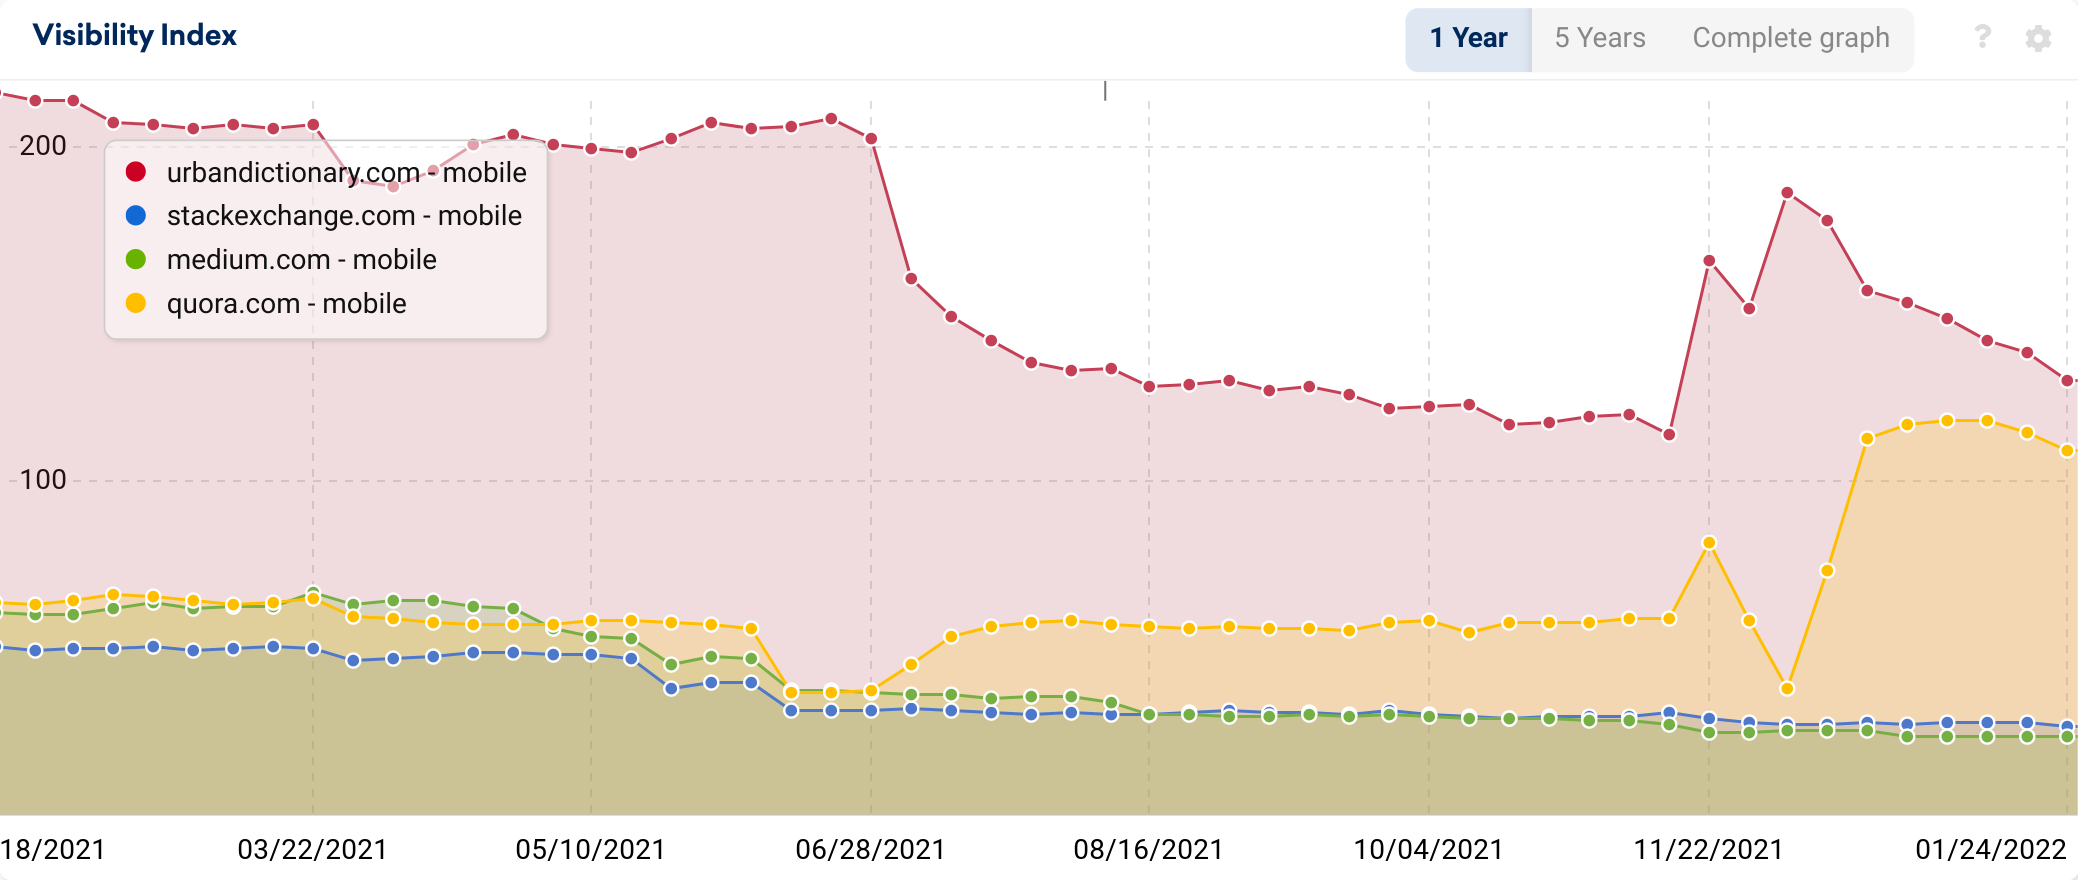
UGC (User-Generated Content)
A variety of sites that are primarily comprised of user-generated content (UGC) saw significant declines in 2021, such as Medium, Stack Exchange, and Urban Dictionary. Quora would have made the loser list, but it saw a significant uptick in late December that restored its visibility to levels not seen since 2019.
Product Review Websites
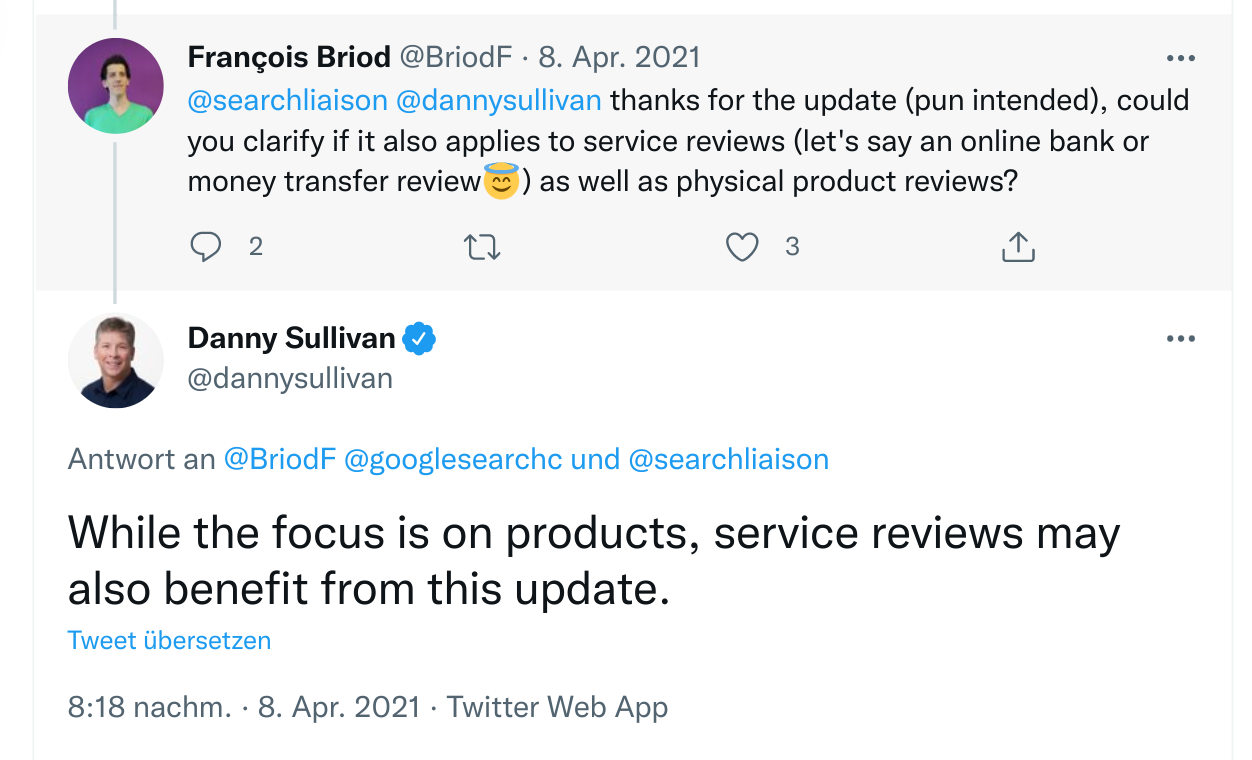
Google launched two Product Review Updates in April and December of 2021. These updates were aimed at highlighting product review content that “provides insightful analysis and original research, and is written by experts or enthusiasts who know the topic well.”
While the two Product Review updates were technically not core updates, their impact was just as big for many sites.
Google was not entirely explicit in its definition of the types of sites that may be considered product review sites, and the impact was felt across many sites that don’t fall neatly into this category. For many of the affected sites, reviewing products (or services) is only one component of their content strategy.
To add insult to injury, some of the sites that felt negative impacts from these Product Review updates (shown as A and B in the below chart) were also negatively impacted by the June, July, and November core updates. Below is an example of the general declines seen throughout 2021 among various popular sites with product review content:
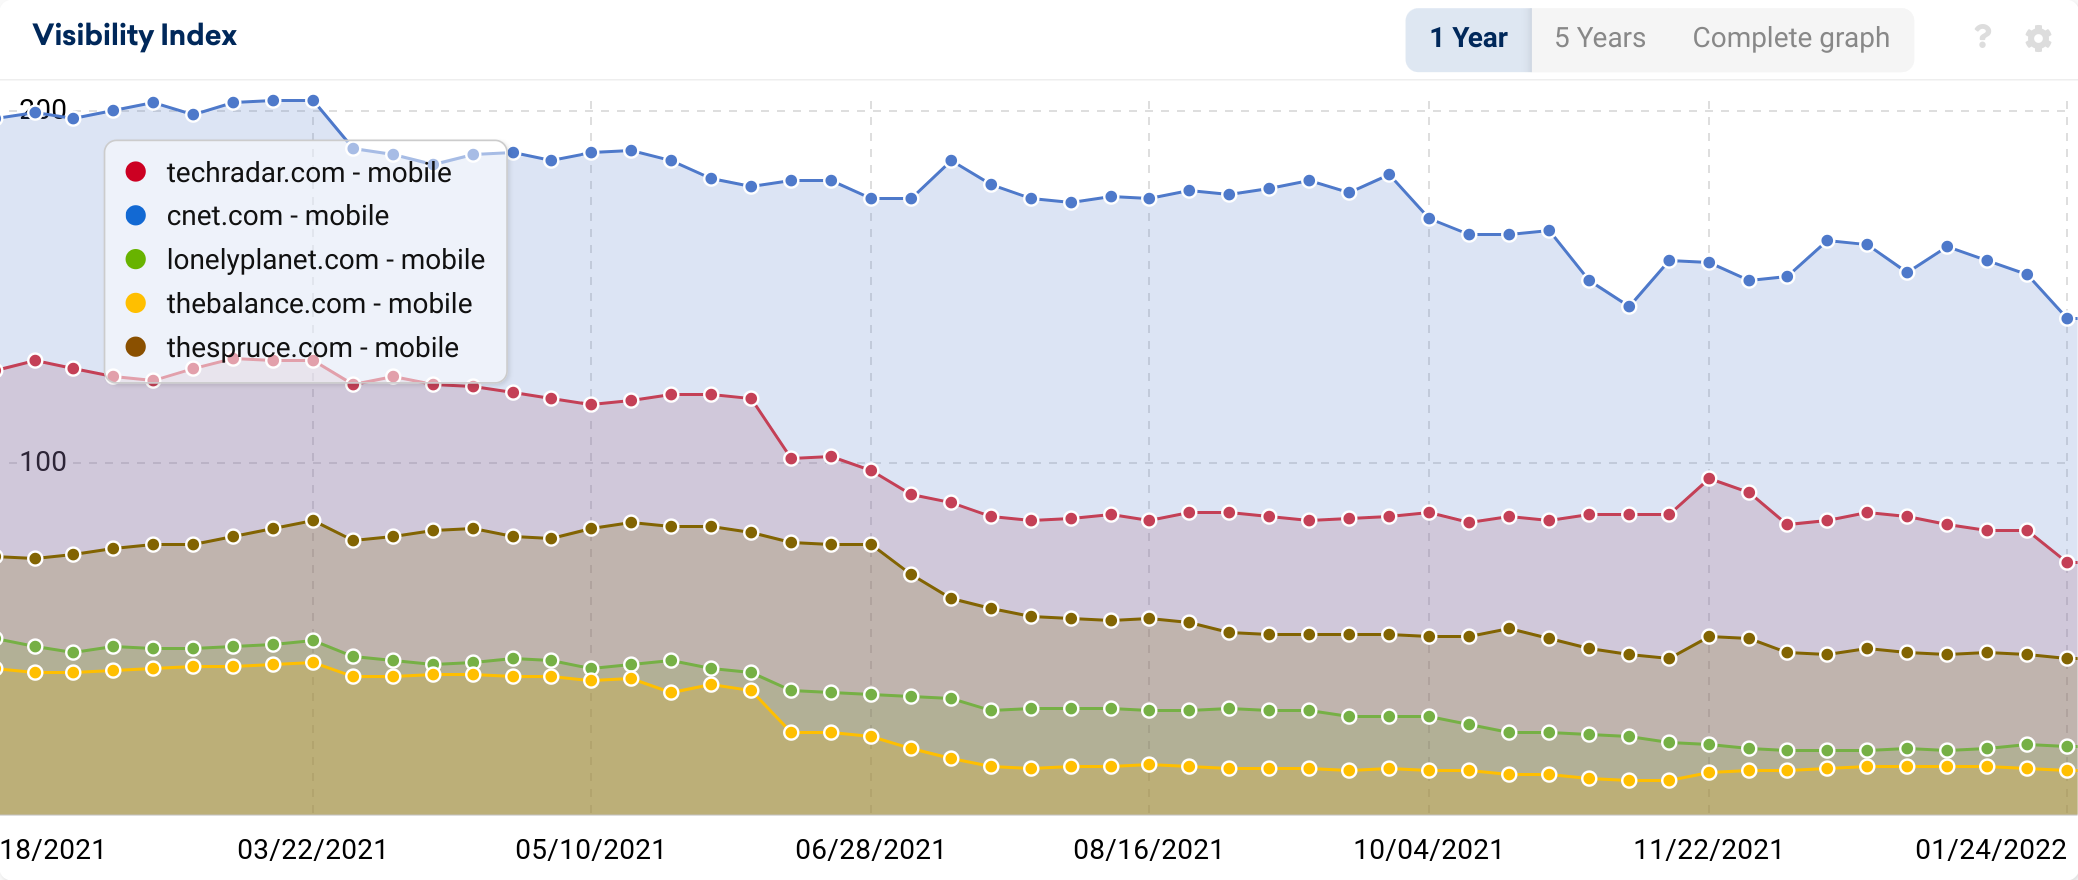
With the December Product Review update, several generalist review sites that discuss a broad variety of products saw declines, and in many cases, their rankings were replaced by product review websites focused in one particular niche.
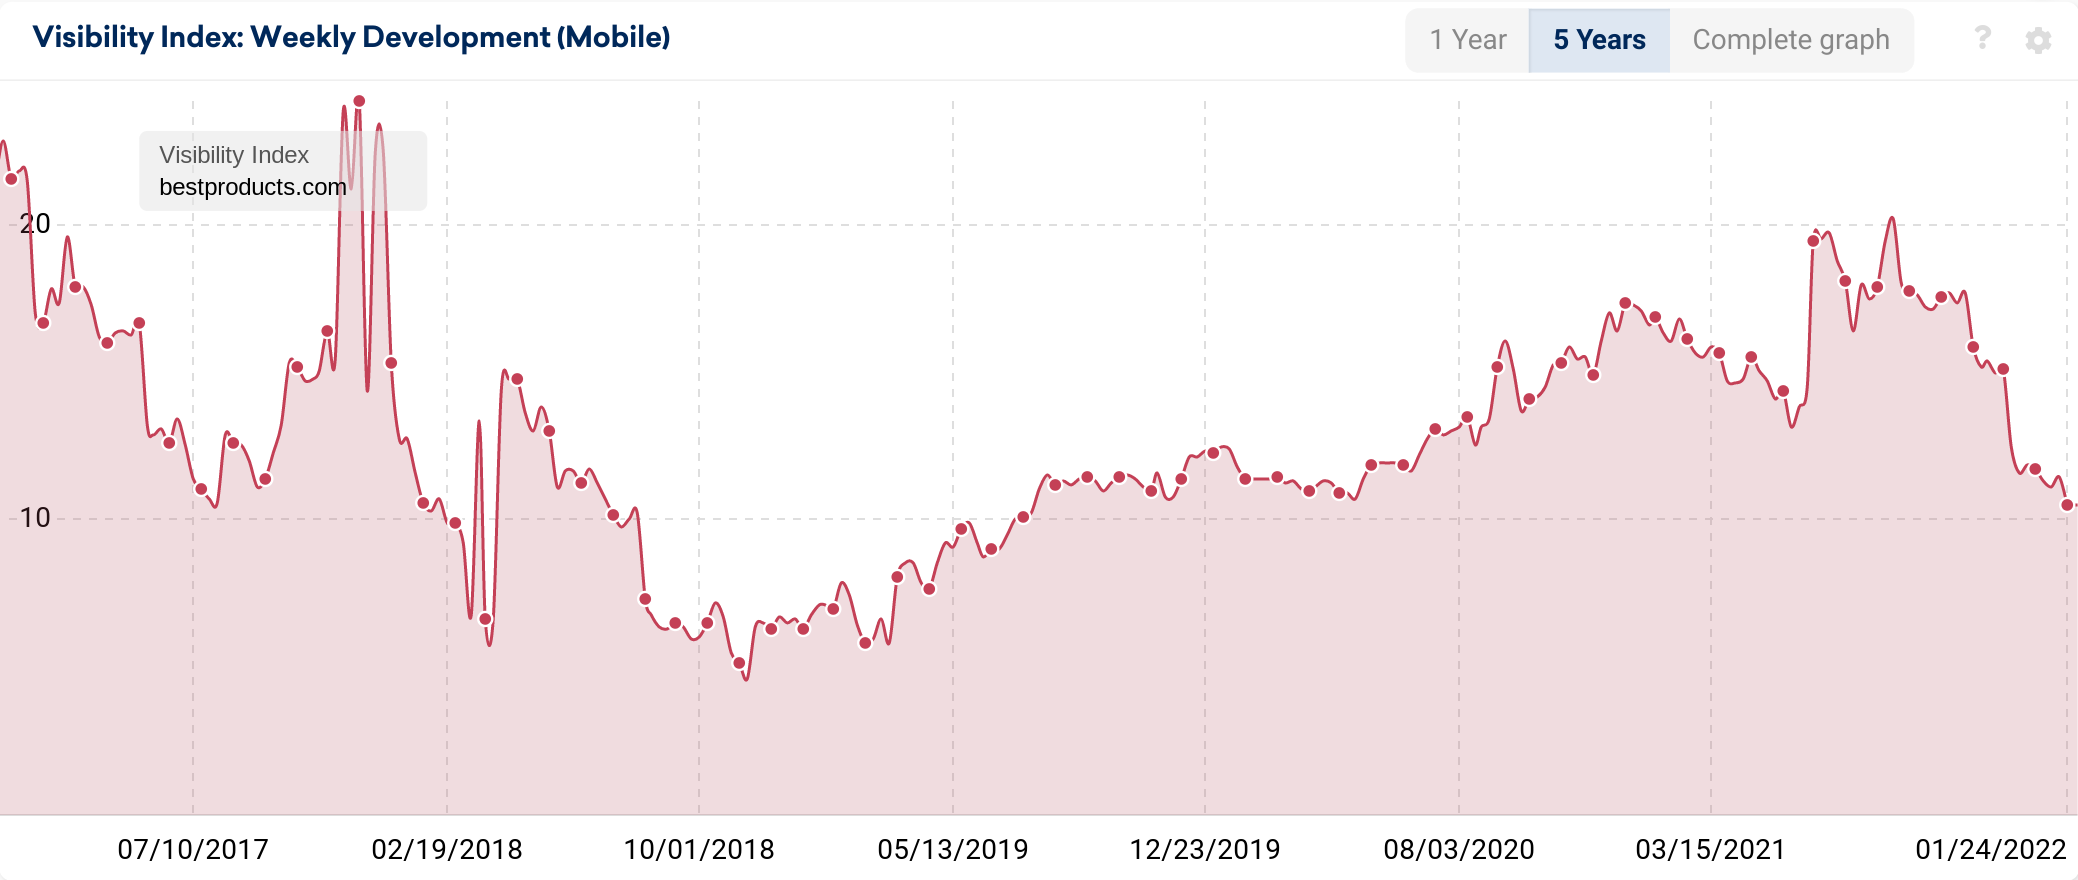
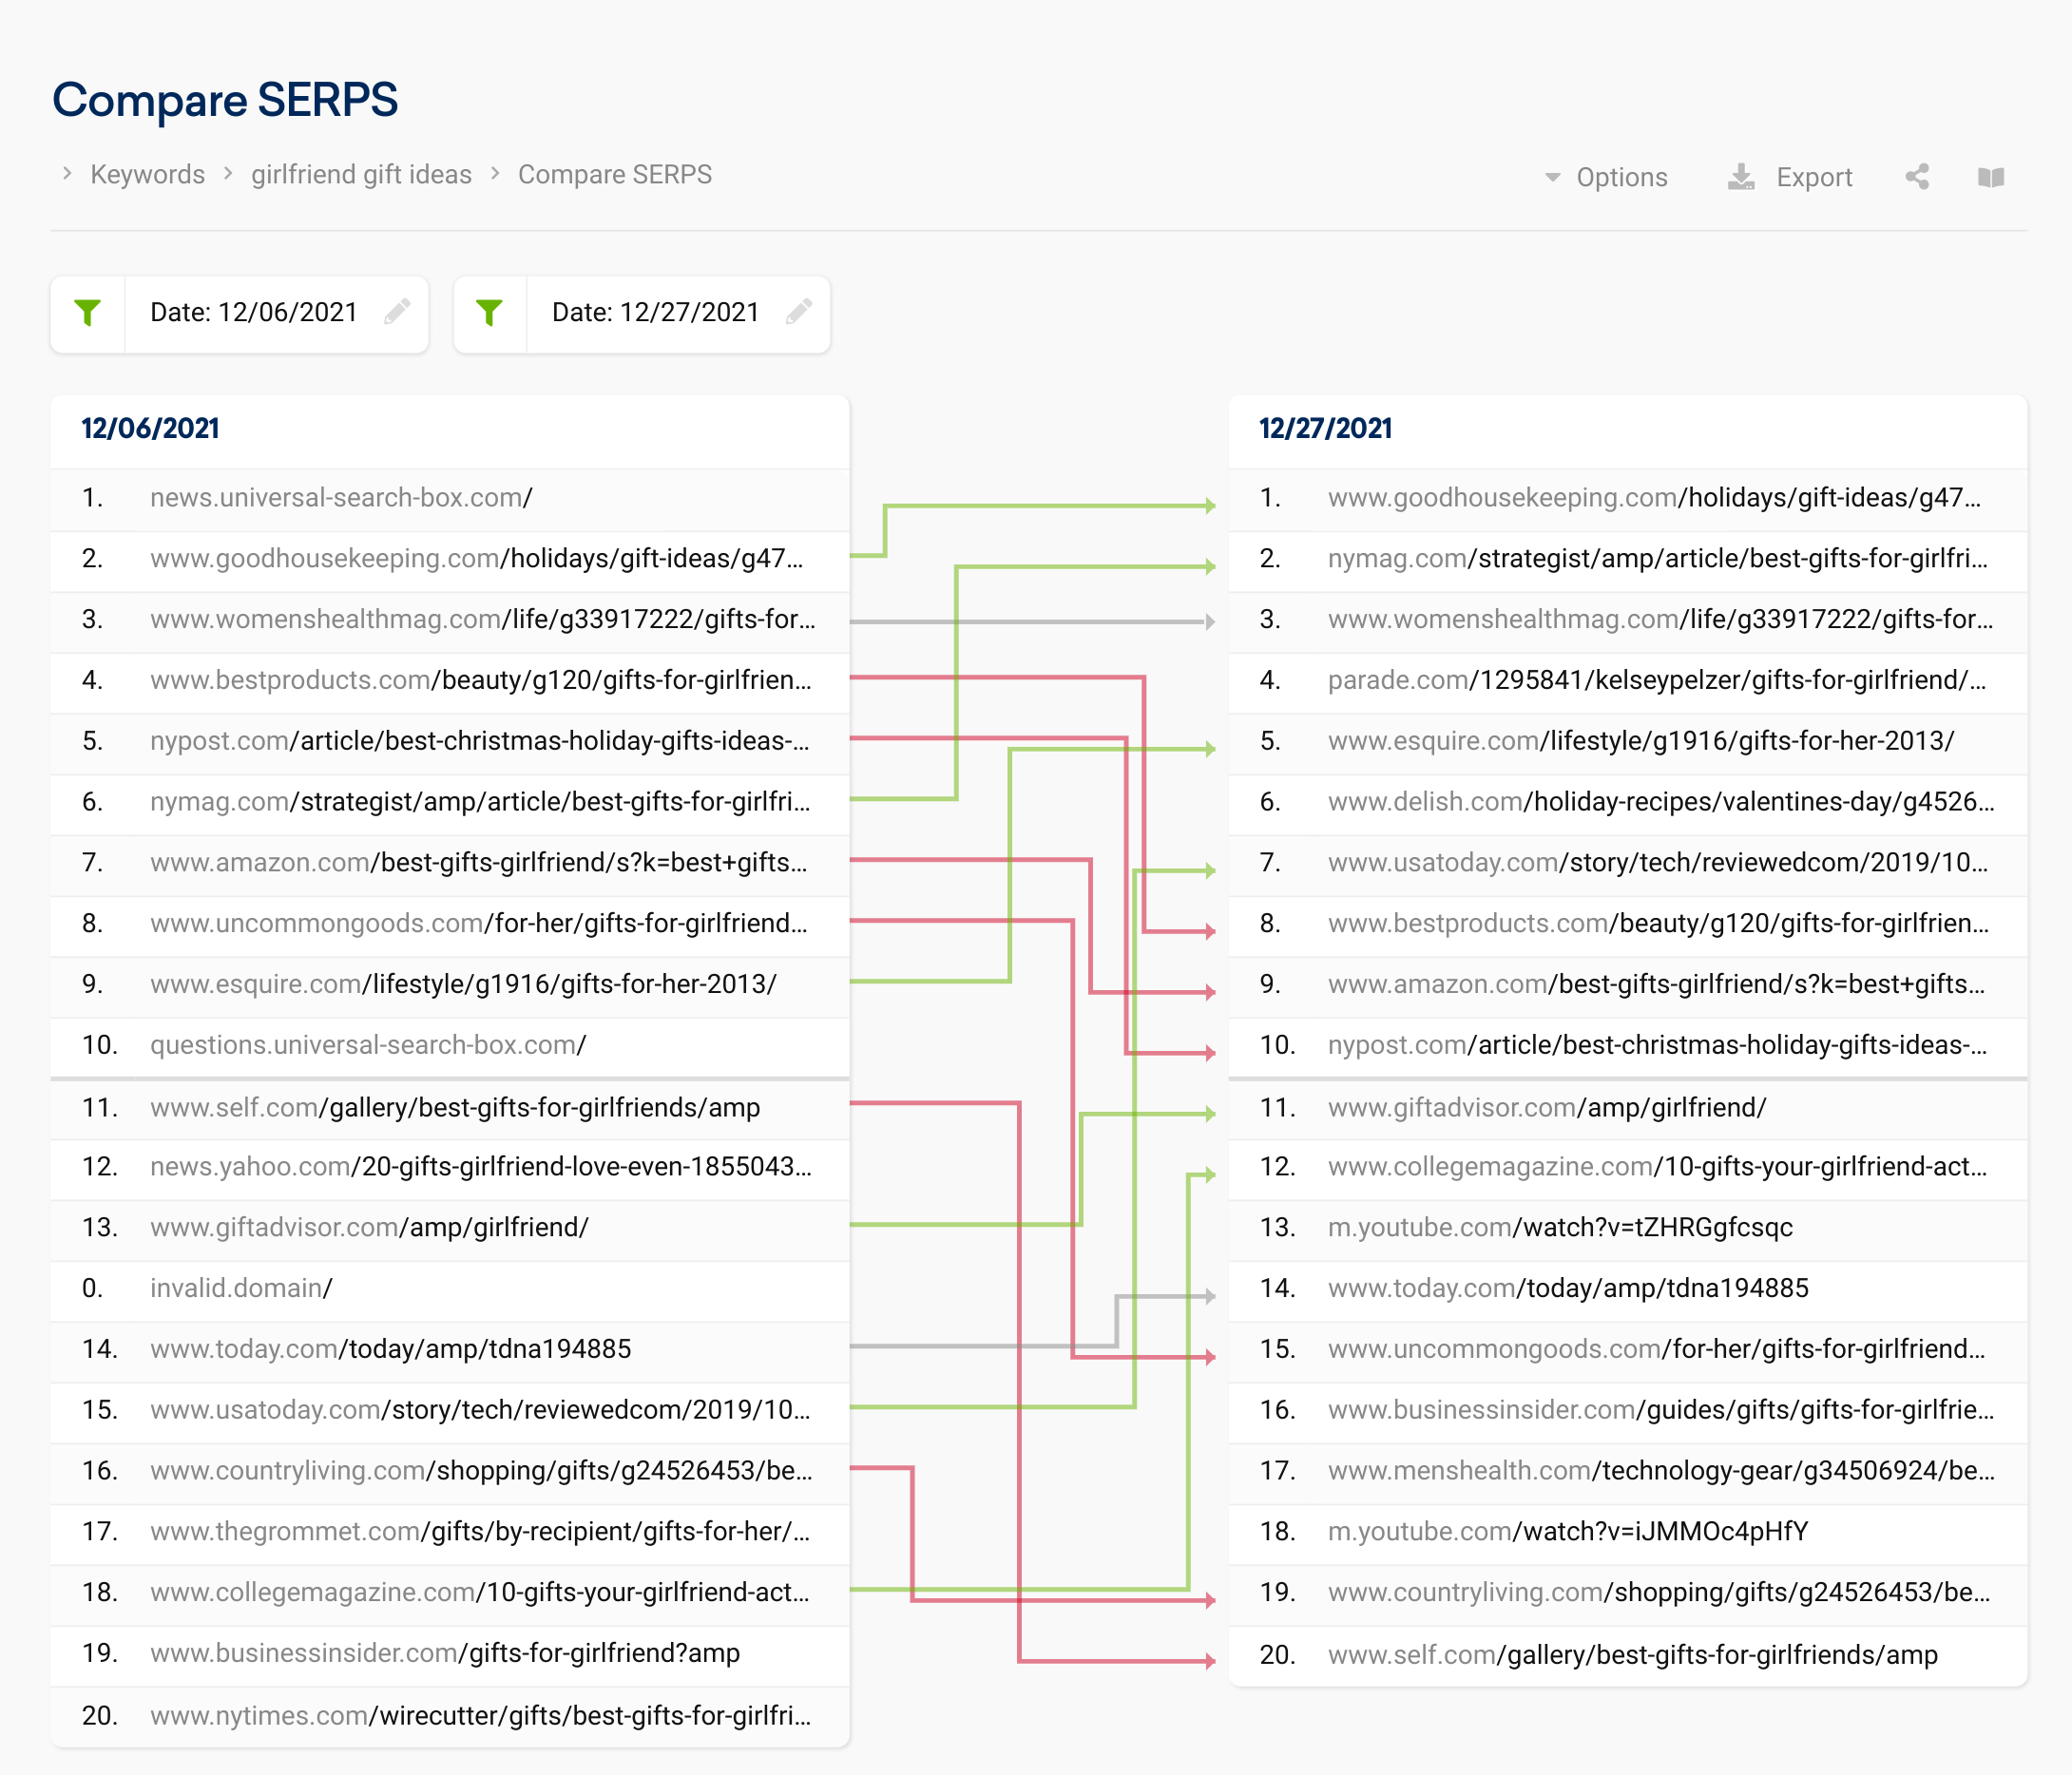
As an example, here is the decline seen by BestProducts.com, which reviews a wide range of products.
Here are some of the keywords Best Products lost top rankings for during the December Product Review update, which span many different topics:
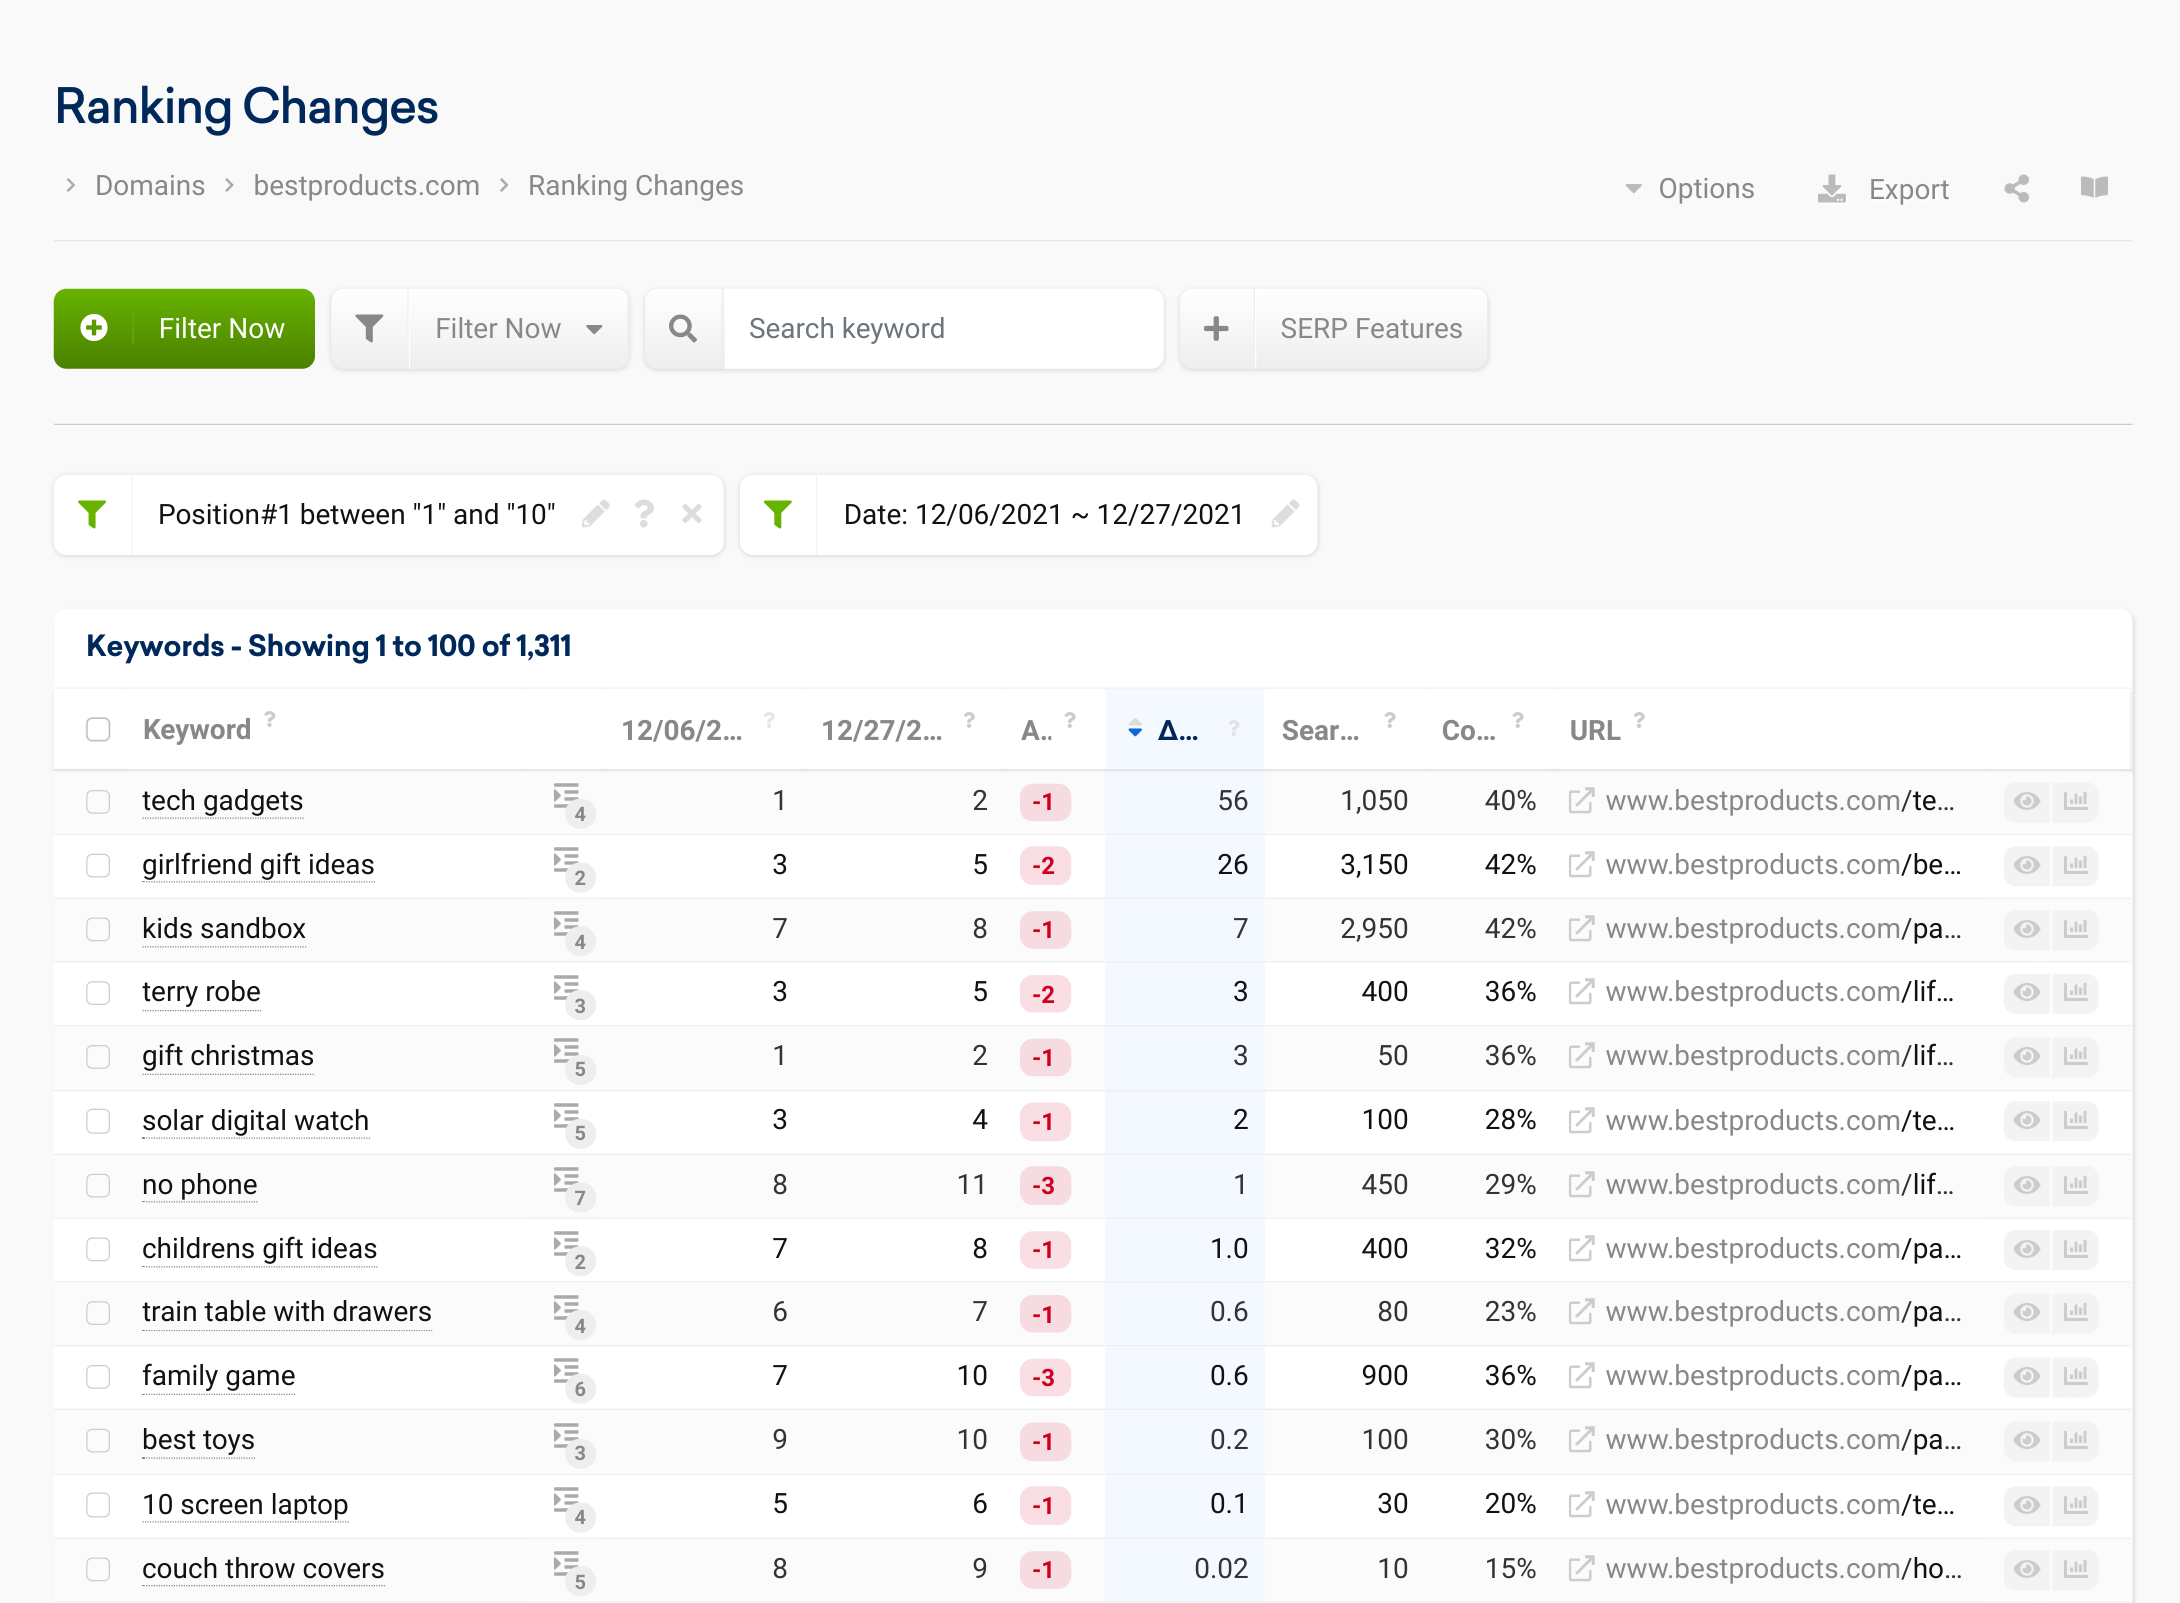
For the keyword “girlfriend gift ideas” (3,150 monthly search volume), Best Product’s #3 ranking was captured by Good Housekeeping, New York Magazine, Women’s Health Magazine, Parade, Esquire, Delish, and USA Today – a combination of recent articles (possibly due to QDF), as well as publishers who potentially demonstrate stronger E-A-T and better content on the topic.
Vacation & Travel Sites: Competitors to Google?
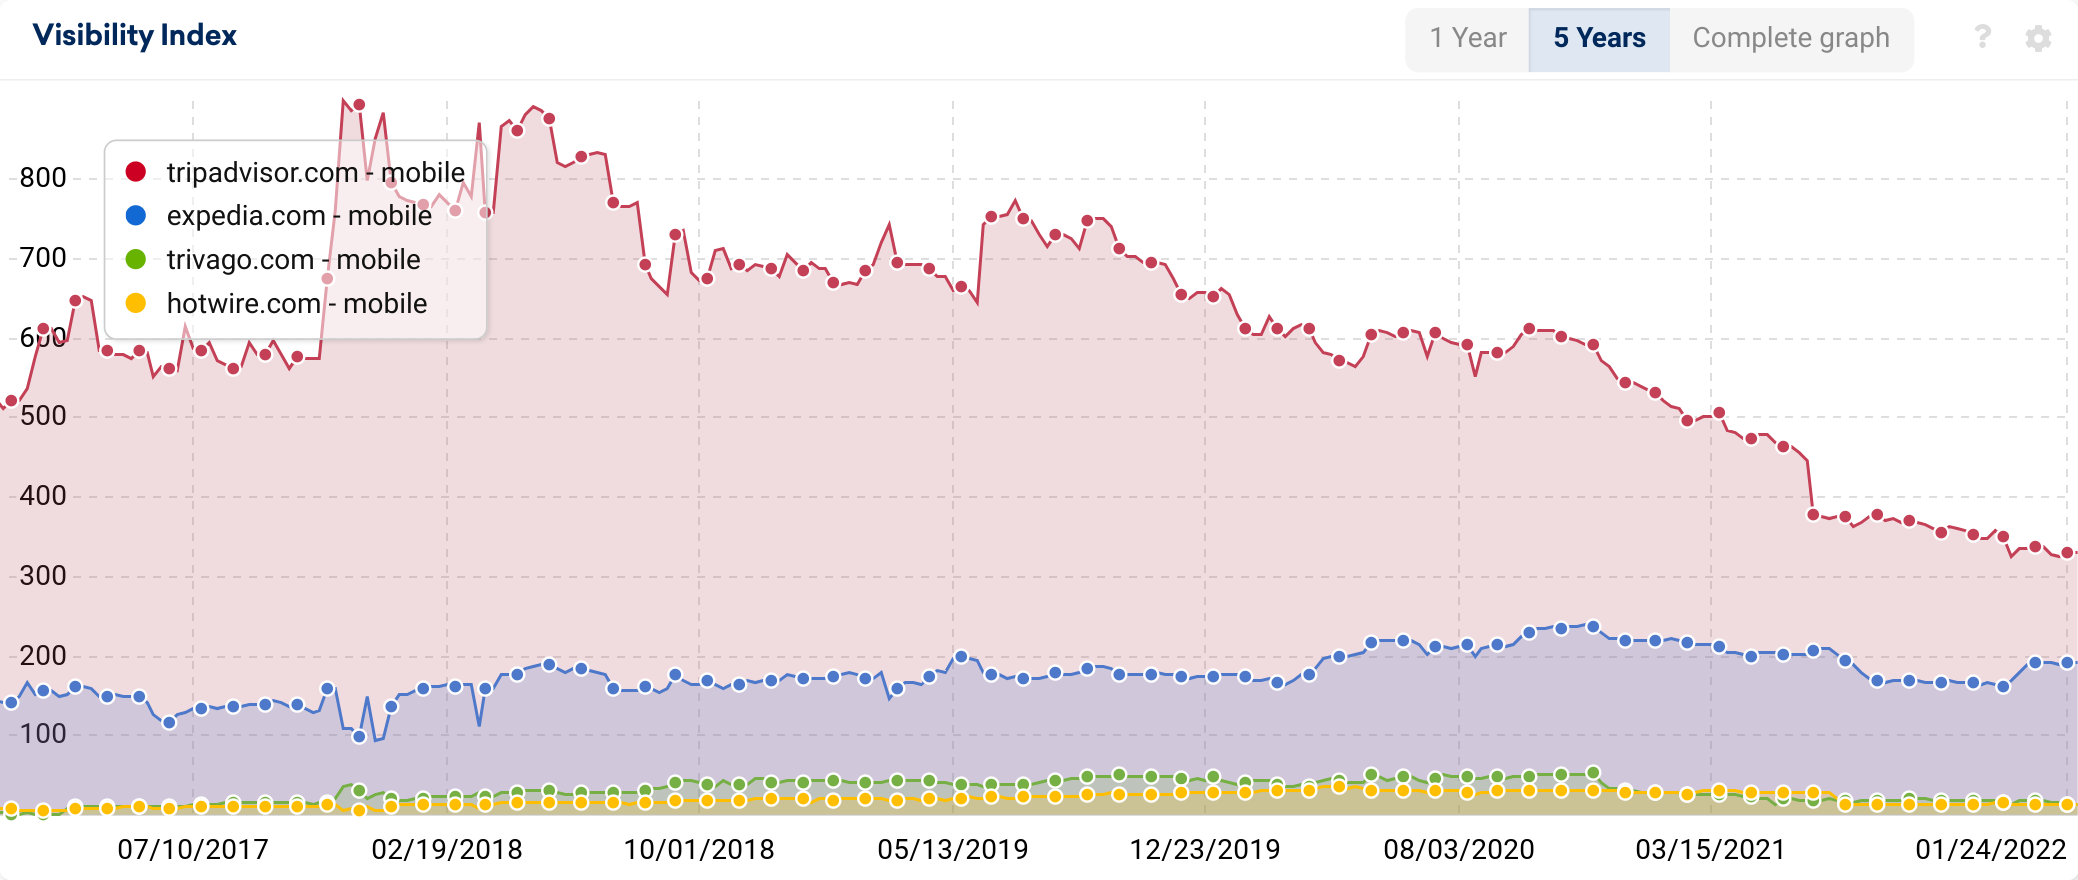
A significant number of websites in the travel and vacation categories saw significant declines this year, particularly comparison shopping sites and discount sites. Examples include Tripadvisor, Home to Go, Travel and Leisure, Expedia, Hotwire, and Wikitravel.
It is worth noting that some of these sites consider Google to be a competitor to their business, given that Google owns a variety of travel products like Google Flights and Google Hotel Ads.
Educational Sites & Lessons for Kids
A variety of websites in the educational space, including college comparison sites and online lessons for children, saw declines in 2021.
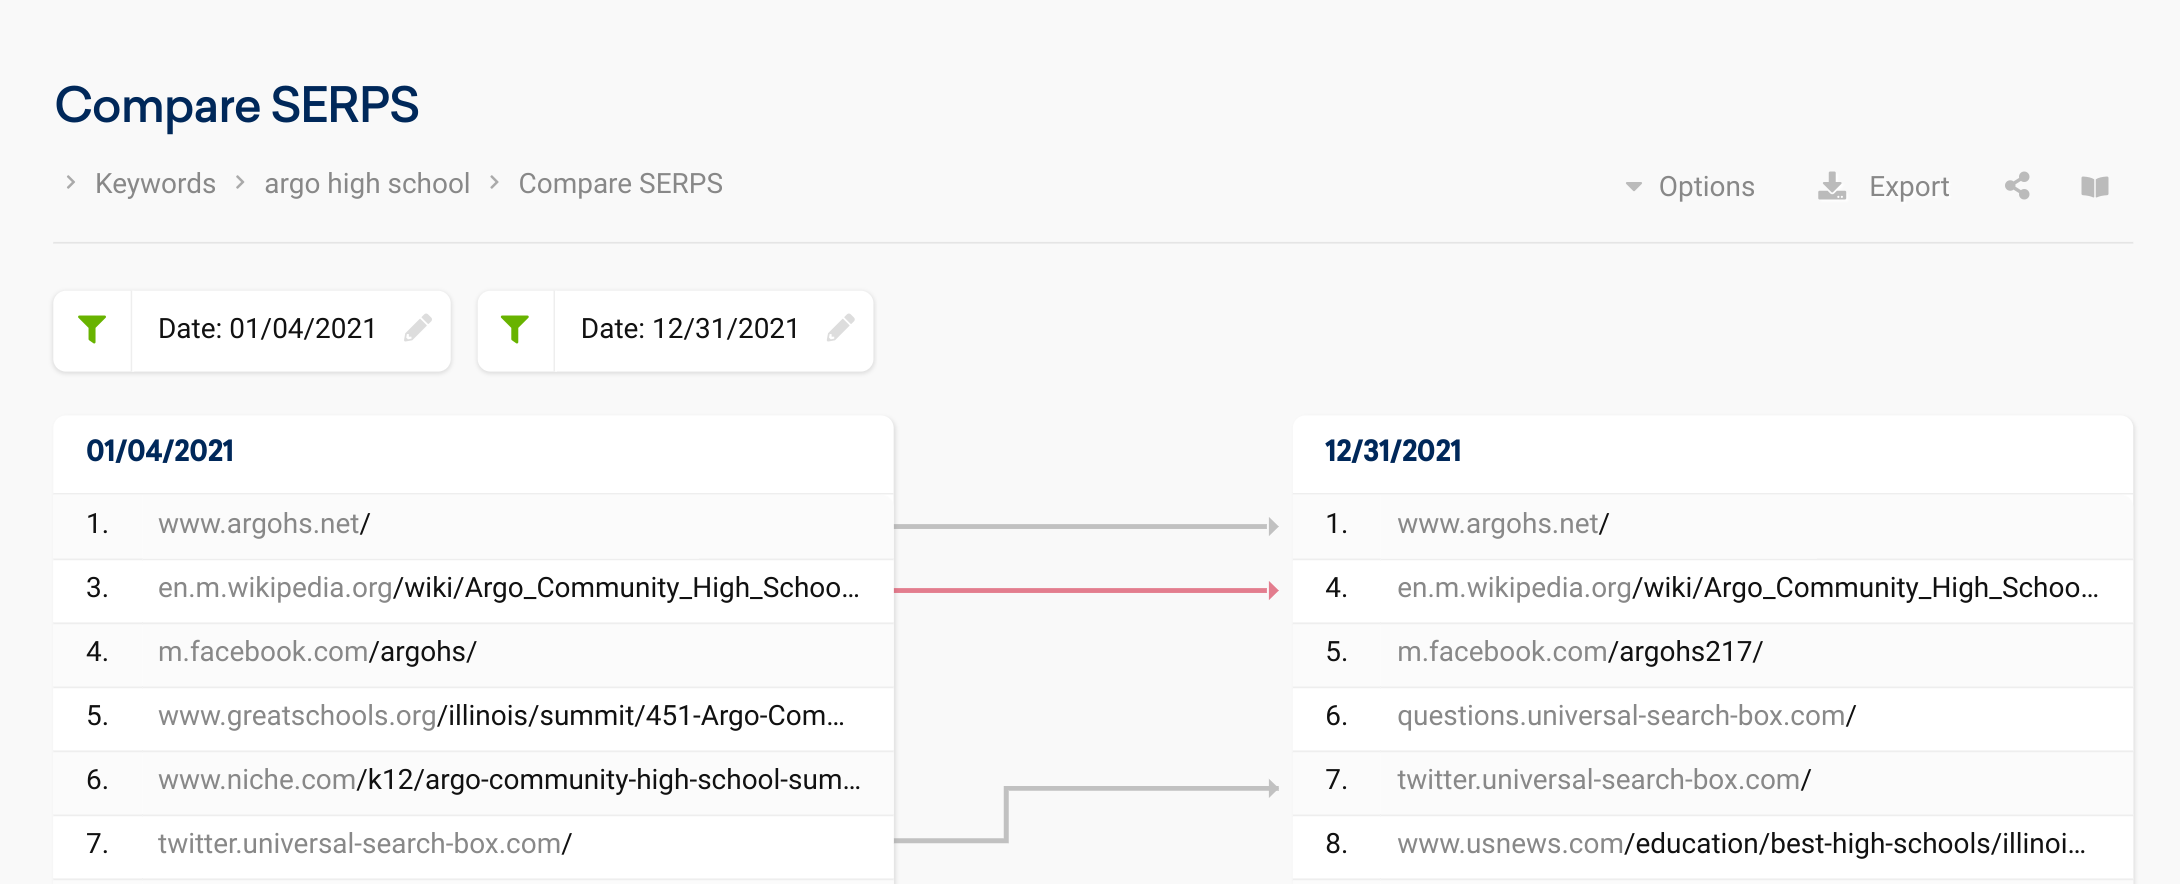
Some generalist school comparison sites, such as College Choices, Niche, and Great Schools, saw gradual declines throughout the year that were exacerbated by the June Core Update. In many cases, the rankings held by these schools for individual school names were replaced by more localized results or news articles about the schools.

For example, for the keyword “Argo High School,” both Great Schools and Niche, fell entirely off the first page by the end of 2021. They were replaced by a US News article about the school, a second website for an Argo High School, and a Linkedin profile for one of the schools.
Ecommerce Sites
While a handful of big ecommerce sites ended up on the 2021 winner list, other major clothing and furniture retailers didn’t fair as well. H&M, Joss and Main, Forever 21, Shoes.com, Overstock, and Etsy all saw visibility declines in 2021.
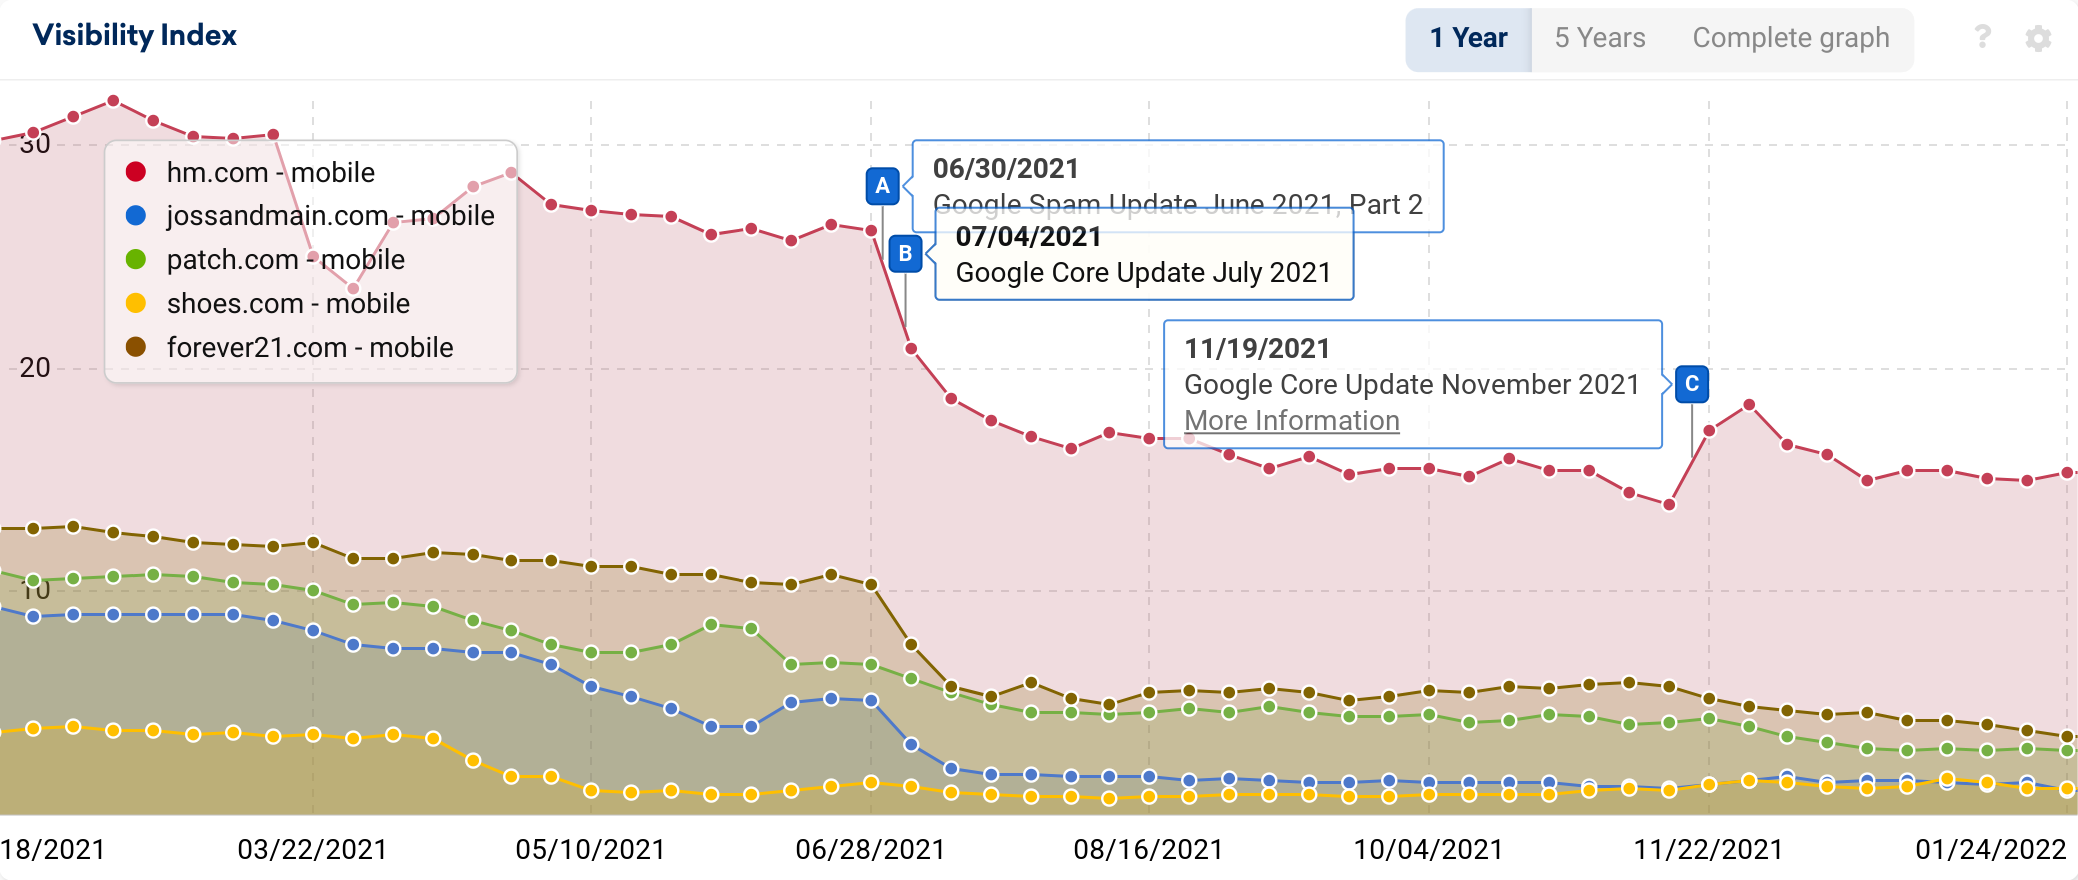
For several of these sites, the declines primarily took place between June and August. While it might seem natural to pin these losses on one particular Google update, the problem is that Google rolled out four concurrent, confirmed updates within the span of those two months: the Page Experience Update, the June Core Update, the July Core Update, and two Spam Updates.
List of losing domains (Absolute and Percentage)
Below, we have included two tables containing the top 25 domains (absolute and percent.) These have been filtered to remove adult content.
| # | Domain | 01/04/2021 | 01/03/2022 | Absolute VI change |
|---|---|---|---|---|
| 1 | wikipedia.org | 5,588.88 | 4,859.40 | -729.49 |
| 2 | youtube.com | 1,066.59 | 590.12 | -476.47 |
| 3 | amazon.com | 2,720.31 | 2,458.37 | -261.95 |
| 4 | tripadvisor.com | 543.69 | 336.76 | -206.94 |
| 5 | facebook.com | 994.44 | 897.11 | -97.33 |
| 6 | pinterest.com | 409.13 | 327.61 | -81.52 |
| 7 | urbandictionary.com | 220.10 | 148.84 | -71.26 |
| 8 | ebay.com | 524.52 | 454.69 | -69.83 |
| 9 | healthline.com | 240.52 | 176.09 | -64.43 |
| 10 | google.com | 522.17 | 461.35 | -60.82 |
| 11 | techradar.com | 130.83 | 82.55 | -48.28 |
| 12 | niche.com | 78.58 | 37.10 | -41.49 |
| 13 | gamestop.com | 71.70 | 32.95 | -38.75 |
| 14 | medium.com | 62.08 | 23.33 | -38.75 |
| 15 | npr.org | 91.05 | 53.63 | -37.42 |
| 16 | wiktionary.org | 374.67 | 338.69 | -35.99 |
| 17 | cnet.com | 194.77 | 161.48 | -33.29 |
| 18 | medicinenet.com | 48.55 | 15.87 | -32.68 |
| 19 | lonelyplanet.com | 50.10 | 18.43 | -31.67 |
| 20 | theguardian.com | 133.74 | 102.84 | -30.90 |
| 21 | fandom.com | 407.89 | 378.00 | -29.89 |
| 22 | soundcloud.com | 72.23 | 43.52 | -28.70 |
| 23 | expedia.com | 219.60 | 191.03 | -28.57 |
| 24 | nationalgeographic.com | 65.46 | 37.80 | -27.66 |
| 25 | thebalance.com | 39.78 | 13.62 | -26.15 |
View the full, unfiltered list of top 250 domains that saw the highest absolute loses in Google visibility.
| # | Domain | 01/04/2021 | 01/03/2022 | Percent VI change |
|---|---|---|---|---|
| 1 | olympic.org | 5.10 | 0.02 | -99.66% |
| 2 | ytmp3.cc | 4.79 | 0.03 | -99.41% |
| 3 | lynda.com | 3.69 | 0.03 | -99.16% |
| 4 | automobilemag.com | 4.09 | 0.04 | -99.11% |
| 5 | sciencemag.org | 14.01 | 0.13 | -99.05% |
| 6 | radio.com | 12.84 | 0.12 | -99.03% |
| 7 | wikia.org | 7.28 | 0.08 | -98.97% |
| 8 | cia.gov | 21.96 | 1.01 | -95.42% |
| 9 | tripadvisor.co.nz | 4.93 | 0.25 | -94.92% |
| 10 | pinterest.de | 3.24 | 0.20 | -93.87% |
| 11 | ebay.com.au | 3.52 | 0.24 | -93.22% |
| 12 | stitcher.com | 4.15 | 0.29 | -93.14% |
| 13 | wolfgangpuck.com | 4.83 | 0.34 | -92.94% |
| 14 | amazon.ca | 8.18 | 0.63 | -92.34% |
| 15 | pinterest.ie | 3.42 | 0.28 | -91.75% |
| 16 | pinterest.es | 5.93 | 0.68 | -88.52% |
| 17 | moneyunder30.com | 8.64 | 1.02 | -88.23% |
| 18 | popcornflix.com | 4.60 | 0.54 | -88.19% |
| 19 | pinterest.nz | 3.19 | 0.38 | -88.00% |
| 20 | pinterest.com.mx | 3.70 | 0.45 | -87.92% |
| 21 | jossandmain.com | 9.48 | 1.42 | -85.07% |
| 22 | amazon.in | 17.74 | 2.70 | -84.80% |
| 23 | smartertravel.com | 9.12 | 1.40 | -84.67% |
| 24 | pinterest.ca | 21.93 | 3.47 | -84.18% |
| 25 | collegechoice.net | 4.74 | 0.80 | -83.22% |
View the full, unfiltered list of top 250 domains that saw the highest percentage loses in Google visibility.
IndexWatch 2021 Winners and Losers in other countries
There are reports available for the following countries
- United Kingdom – Winners and Losers
- United States – Winners and Losers (this report.)
- Germany – Winners and Losers
- Italy – Winners and Losers
- Spain – Winners and Losers
- France – Winners and Losers
And that rounds up the 2021 IndexWatch reports for the US. If you haven’t seen it yet, the winners report is here,
One more thing – don’t forget to subscribe to TrendWatch, which goes out vial newsletter every month,