
Where there are SEO winners, there must also be losers, and in 2023, it felt like there were a lot of them. Between various Core Updates, Reviews Updates, Spam Updates and the notorious September Helpful Content Update, 2023 produced a significant batch of sites that lost upwards of 50% of their SEO visibility throughout the year. Read the analysis and check the list of 200 losing domains.
- Classification of Domains
- Biggest Domain Losers of SEO Visibility in 2023
- Top 100 search visibility losers: Percentage VI losses
- Top 100 search visibility losers: Absolute VI losses
- Biggest losers: travel & destination review sites
- General product review websites
- E-commerce websites
- Home furniture
- Helpful Content Update: Massive Losses Across Categories
- Methodology and Disclaimers for Analyzing Winners & Losers
- Classification of domains
- Global IndexWatch 2023 reports
This article is the second of a two-part series and will focus primarily on the biggest visibility losers in 2023. View the first part of the series, which discussed the biggest visibility winners in 2023.
More about the methodology and the Visibility Index is provided at the end of this article.
Classification of Domains
In the spirit of using generative AI to enhance data analysis, this year, I used ChatGPT to classify the domains into 55 categories. The categories and methodology are shown at the end of this article.
The categories with the greatest average percentage losses in visibility, plus the number of domains classified in that category, are shown below:
| Parent category | Percent change | Count of Domains |
|---|---|---|
| Travel Directories & Blogs | -50.19% | 67 |
| Hobbies & Collectibles | -50.13% | 55 |
| Home & Furniture | -49.48% | 21 |
| Advocacy and Nonprofit | -48.67% | 8 |
| Information & Research | -48.01% | 23 |
| Fashion & Apparel | -47.87% | 32 |
| E-commerce | -47.39% | 23 |
| Art & Culture | -47.32% | 23 |
| Adult Content | -46.93% | 6 |
| Education & Learning | -46.57% | 78 |
| Technology & Computing | -46.17% | 136 |
| Food & Delivery | -45.78% | 27 |
| Entertainment & Social Media | -44.06% | 140 |
| Lyrics & Music | -42.88% | 24 |
| Sports & Outdoor Equipment | -42.69% | 13 |
| Business & Finance | -42.16% | 76 |
| Religion & Spirituality | -41.92% | 4 |
| Product Reviews | -41.85% | 7 |
| News & Media | -41.49% | 40 |
| Games & Puzzles | -40.77% | 4 |
| Authority Health Site | -39.47% | 32 |
| Beauty & Fragrances | -39.26% | 5 |
| Sports Teams & Sports Publishers | -38.07% | 20 |
Biggest Domain Losers of SEO Visibility in 2023
Top 100 search visibility losers: Percentage VI losses
| # | Domain | 02.01.2023 | 01.01.2024 | Change % |
|---|---|---|---|---|
| 1 | overstock.com | 66.901 | 0.3392 | -99.49% |
| 2 | vacationidea.com | 23.4217 | 0.2606 | -98.89% |
| 3 | familydestinationsguide.com | 6.3885 | 0.1557 | -97.56% |
| 4 | restaurantclicks.com | 4.7709 | 0.1168 | -97.55% |
| 5 | tripstodiscover.com | 6.7873 | 0.2051 | -96.98% |
| 6 | guitarspace.org | 3.2098 | 0.1011 | -96.85% |
| 7 | treksplorer.com | 4.1179 | 0.1312 | -96.81% |
| 8 | gadgetreview.com | 6.2857 | 0.2559 | -95.93% |
| 9 | uphomes.com | 3.8455 | 0.1684 | -95.62% |
| 10 | edsurge.com | 3.3121 | 0.156 | -95.29% |
| 11 | havecamerawilltravel.com | 3.437 | 0.1623 | -95.28% |
| 12 | whereig.com | 3.8082 | 0.1936 | -94.92% |
| 13 | wtkr.com | 6.8059 | 0.3536 | -94.80% |
| 14 | everydaycalculation.com | 4.7479 | 0.2949 | -93.79% |
| 15 | mydegreeguide.com | 3.7265 | 0.2328 | -93.75% |
| 16 | textranch.com | 3.0701 | 0.2008 | -93.46% |
| 17 | online-tech-tips.com | 4.8689 | 0.336 | -93.10% |
| 18 | viatravelers.com | 3.7634 | 0.2679 | -92.88% |
| 19 | the-home-cinema-guide.com | 4.4834 | 0.3443 | -92.32% |
| 20 | fee.org | 3.9912 | 0.316 | -92.08% |
| 21 | trulyexperiences.com | 3.1026 | 0.2607 | -91.60% |
| 22 | lovehairstyles.com | 5.2333 | 0.4652 | -91.11% |
| 23 | mymove.com | 3.4551 | 0.3082 | -91.08% |
| 24 | pocket-lint.com | 9.2487 | 0.8957 | -90.32% |
| 25 | bloody-disgusting.com | 3.5037 | 0.341 | -90.27% |
| 26 | groovypost.com | 9.1943 | 0.9913 | -89.22% |
| 27 | bl.uk | 4.2236 | 0.4562 | -89.20% |
| 28 | thecoolist.com | 3.2495 | 0.3555 | -89.06% |
| 29 | reservations.com | 8.7165 | 0.9621 | -88.96% |
| 30 | planetware.com | 31.0218 | 3.5361 | -88.60% |
| 31 | planetofhotels.com | 3.0805 | 0.353 | -88.54% |
| 32 | hechingerreport.org | 3.8701 | 0.4436 | -88.54% |
| 33 | fixya.com | 4.1118 | 0.4755 | -88.44% |
| 34 | denofgeek.com | 14.7298 | 1.7238 | -88.30% |
| 35 | handluggageonly.co.uk | 11.8962 | 1.4803 | -87.56% |
| 36 | linuxhint.com | 3.3255 | 0.4179 | -87.43% |
| 37 | financesonline.com | 3.7521 | 0.4727 | -87.40% |
| 38 | tourscanner.com | 8.4496 | 1.1077 | -86.89% |
| 39 | getolympus.com | 4.3022 | 0.5693 | -86.77% |
| 40 | explainthatstuff.com | 9.1065 | 1.2242 | -86.56% |
| 41 | gearpatrol.com | 12.4694 | 1.6862 | -86.48% |
| 42 | calculateme.com | 3.0083 | 0.4167 | -86.15% |
| 43 | the-house.com | 3.7932 | 0.5317 | -85.98% |
| 44 | moovitapp.com | 7.4006 | 1.0554 | -85.74% |
| 45 | artincontext.org | 3.6056 | 0.5221 | -85.52% |
| 46 | zoro.com | 3.7705 | 0.548 | -85.47% |
| 47 | faroutmagazine.co.uk | 17.4652 | 2.5879 | -85.18% |
| 48 | globenewswire.com | 3.0543 | 0.4527 | -85.18% |
| 49 | abcactionnews.com | 5.3794 | 0.8121 | -84.90% |
| 50 | wanderingwheatleys.com | 4.7856 | 0.7294 | -84.76% |
| 51 | quantamagazine.org | 5.286 | 0.8153 | -84.58% |
| 52 | thecrazytourist.com | 6.3942 | 0.9864 | -84.57% |
| 53 | techwalla.com | 7.4334 | 1.1545 | -84.47% |
| 54 | aeon.co | 3.1008 | 0.486 | -84.33% |
| 55 | sciencealert.com | 3.1794 | 0.4991 | -84.30% |
| 56 | myrecipes.com | 3.2526 | 0.5134 | -84.22% |
| 57 | travel2next.com | 3.9731 | 0.65 | -83.64% |
| 58 | thepeoplehistory.com | 7.8012 | 1.3095 | -83.21% |
| 59 | buybuybaby.com | 22.9194 | 3.8855 | -83.05% |
| 60 | inverse.com | 8.9382 | 1.5668 | -82.47% |
| 61 | everydaypower.com | 4.1944 | 0.7363 | -82.45% |
| 62 | softwaretestinghelp.com | 32.2445 | 5.7116 | -82.29% |
| 63 | xda-developers.com | 5.5175 | 0.9931 | -82.00% |
| 64 | hackaday.com | 4.2034 | 0.7595 | -81.93% |
| 65 | hotcars.com | 12.3534 | 2.2502 | -81.78% |
| 66 | digitalcameraworld.com | 30.4795 | 5.65 | -81.46% |
| 67 | protoolreviews.com | 4.8259 | 0.9132 | -81.08% |
| 68 | funbrain.com | 3.5421 | 0.6747 | -80.95% |
| 69 | all3dp.com | 3.3121 | 0.636 | -80.80% |
| 70 | beatport.com | 4.7018 | 0.9182 | -80.47% |
| 71 | booked.net | 5.294 | 1.0582 | -80.01% |
| 72 | thrillist.com | 18.4523 | 3.7638 | -79.60% |
| 73 | windowsreport.com | 6.5434 | 1.3442 | -79.46% |
| 74 | brickset.com | 6.1122 | 1.2616 | -79.36% |
| 75 | clipart-library.com | 4.6151 | 0.9571 | -79.26% |
| 76 | geekflare.com | 3.1822 | 0.6645 | -79.12% |
| 77 | fashionbeans.com | 6.5556 | 1.4165 | -78.39% |
| 78 | theculturetrip.com | 20.915 | 4.5411 | -78.29% |
| 79 | matadornetwork.com | 3.2796 | 0.7203 | -78.04% |
| 80 | wellandgood.com | 4.9645 | 1.0935 | -77.97% |
| 81 | artnews.com | 3.6331 | 0.8067 | -77.80% |
| 82 | bobvila.com | 32.7152 | 7.2838 | -77.74% |
| 83 | wellgames.com | 3.4172 | 0.7647 | -77.62% |
| 84 | insanelygoodrecipes.com | 9.4689 | 2.1535 | -77.26% |
| 85 | fossbytes.com | 3.8749 | 0.8828 | -77.22% |
| 86 | marieclaire.com | 9.1649 | 2.0944 | -77.15% |
| 87 | appliancesconnection.com | 3.6408 | 0.8327 | -77.13% |
| 88 | thefreedictionary.com | 155.1929 | 35.6277 | -77.04% |
| 89 | themanual.com | 4.3403 | 1.0022 | -76.91% |
| 90 | bloomberglaw.com | 3.6154 | 0.8441 | -76.65% |
| 91 | nymag.com | 75.5646 | 17.7382 | -76.53% |
| 92 | ldproducts.com | 6.3621 | 1.4941 | -76.52% |
| 93 | solvusoft.com | 3.1269 | 0.7412 | -76.30% |
| 94 | webbikeworld.com | 3.2185 | 0.7724 | -76.00% |
| 95 | lifehack.org | 8.5688 | 2.0603 | -75.96% |
| 96 | rookieroad.com | 3.869 | 0.9334 | -75.87% |
| 97 | tunebat.com | 3.3998 | 0.8273 | -75.67% |
| 98 | mongabay.com | 4.4103 | 1.0734 | -75.66% |
| 99 | sears.com | 19.2929 | 4.7307 | -75.48% |
| 100 | trendybeatz.com | 3.0514 | 0.7494 | -75.44% |
Top 100 search visibility losers: Absolute VI losses
| # | Domain | 02 Jan 2023 | 01 Jan 2024 | Change |
|---|---|---|---|---|
| 1 | youtube.com | 1965.28 | 1427.32 | -537.96 |
| 2 | wiktionary.org | 680.01 | 170.22 | -509.80 |
| 3 | amazon.com | 3322.49 | 2967.78 | -354.71 |
| 4 | walmart.com | 826.32 | 570.14 | -256.19 |
| 5 | ebay.com | 684.93 | 470.66 | -214.27 |
| 6 | etsy.com | 375.96 | 178.16 | -197.80 |
| 7 | target.com | 460.62 | 336.33 | -124.29 |
| 8 | thefreedictionary.com | 155.19 | 35.63 | -119.57 |
| 9 | bestbuy.com | 534.54 | 431.02 | -103.52 |
| 10 | urbandictionary.com | 137.72 | 35.00 | -102.72 |
| 11 | nytimes.com | 293.98 | 193.60 | -100.38 |
| 12 | thesaurus.com | 197.08 | 108.50 | -88.58 |
| 13 | dictionary.com | 630.88 | 551.80 | -79.08 |
| 14 | bhphotovideo.com | 138.68 | 70.57 | -68.11 |
| 15 | overstock.com | 66.90 | 0.34 | -66.56 |
| 16 | spotify.com | 246.39 | 180.37 | -66.02 |
| 17 | macys.com | 170.04 | 106.08 | -63.96 |
| 18 | nymag.com | 75.56 | 17.74 | -57.83 |
| 19 | bedbathandbeyond.com | 90.62 | 37.47 | -53.15 |
| 20 | nordstrom.com | 156.11 | 112.42 | -43.70 |
| 21 | thespruce.com | 81.48 | 40.52 | -40.96 |
| 22 | makeuseof.com | 62.31 | 22.91 | -39.40 |
| 23 | cnn.com | 111.71 | 73.48 | -38.23 |
| 24 | npr.org | 75.53 | 38.22 | -37.31 |
| 25 | washingtonpost.com | 66.43 | 30.40 | -36.03 |
| 26 | wayfair.com | 115.48 | 80.36 | -35.13 |
| 27 | vogue.com | 49.81 | 15.54 | -34.27 |
| 28 | azlyrics.com | 106.05 | 72.49 | -33.56 |
| 29 | lawinsider.com | 55.66 | 23.77 | -31.89 |
| 30 | collider.com | 44.01 | 13.30 | -30.72 |
| 31 | lowes.com | 185.73 | 155.54 | -30.19 |
| 32 | dickssportinggoods.com | 66.12 | 37.19 | -28.93 |
| 33 | cancer.gov | 51.21 | 23.40 | -27.82 |
| 34 | wikivoyage.org | 44.04 | 16.30 | -27.74 |
| 35 | planetware.com | 31.02 | 3.54 | -27.49 |
| 36 | nature.com | 60.20 | 32.81 | -27.39 |
| 37 | discogs.com | 62.28 | 34.92 | -27.37 |
| 38 | yahoo.com | 143.92 | 116.82 | -27.10 |
| 39 | softwaretestinghelp.com | 32.24 | 5.71 | -26.53 |
| 40 | fandom.com | 402.03 | 376.47 | -25.56 |
| 41 | bobvila.com | 32.72 | 7.28 | -25.43 |
| 42 | digitalcameraworld.com | 30.48 | 5.65 | -24.83 |
| 43 | bbc.com | 62.68 | 37.86 | -24.82 |
| 44 | tvtropes.org | 41.48 | 16.84 | -24.64 |
| 45 | travelandleisure.com | 63.12 | 38.63 | -24.49 |
| 46 | yelp.com | 147.20 | 123.60 | -23.60 |
| 47 | newegg.com | 110.23 | 86.78 | -23.45 |
| 48 | vacationidea.com | 23.42 | 0.26 | -23.16 |
| 49 | rd.com | 44.76 | 22.00 | -22.76 |
| 50 | pinterest.com | 431.52 | 409.46 | -22.06 |
| 51 | xhamster.com | 38.65 | 16.71 | -21.95 |
| 52 | insider.com | 37.12 | 15.55 | -21.57 |
| 53 | nordstromrack.com | 33.80 | 12.42 | -21.38 |
| 54 | poshmark.com | 34.55 | 13.88 | -20.67 |
| 55 | dillards.com | 30.38 | 10.83 | -19.55 |
| 56 | kohls.com | 57.74 | 38.38 | -19.37 |
| 57 | buybuybaby.com | 22.92 | 3.89 | -19.03 |
| 58 | glassdoor.com | 46.47 | 27.69 | -18.78 |
| 59 | familyhandyman.com | 31.23 | 12.54 | -18.70 |
| 60 | guru99.com | 28.60 | 10.30 | -18.31 |
| 61 | computerhope.com | 30.73 | 12.45 | -18.27 |
| 62 | rateyourmusic.com | 27.43 | 9.86 | -17.57 |
| 63 | nypost.com | 32.98 | 15.64 | -17.34 |
| 64 | tasteofhome.com | 44.37 | 27.17 | -17.20 |
| 65 | foodnetwork.com | 62.70 | 45.61 | -17.09 |
| 66 | asos.com | 39.83 | 22.86 | -16.97 |
| 67 | thespruceeats.com | 33.47 | 16.57 | -16.90 |
| 68 | bloomingdales.com | 31.52 | 14.75 | -16.77 |
| 69 | chron.com | 33.76 | 17.18 | -16.58 |
| 70 | theculturetrip.com | 20.92 | 4.54 | -16.37 |
| 71 | lyrics.com | 57.69 | 41.38 | -16.31 |
| 72 | rtings.com | 42.63 | 26.48 | -16.15 |
| 73 | samsclub.com | 29.44 | 13.33 | -16.11 |
| 74 | mckinsey.com | 23.35 | 7.77 | -15.58 |
| 75 | smithsonianmag.com | 27.36 | 12.18 | -15.18 |
| 76 | bleacherreport.com | 25.39 | 10.25 | -15.13 |
| 77 | faroutmagazine.co.uk | 17.47 | 2.59 | -14.88 |
| 78 | thrillist.com | 18.45 | 3.76 | -14.69 |
| 79 | sears.com | 19.29 | 4.73 | -14.56 |
| 80 | verywellfamily.com | 24.83 | 10.29 | -14.54 |
| 81 | newyorker.com | 32.31 | 17.77 | -14.53 |
| 82 | xnxx.com | 70.76 | 56.34 | -14.42 |
| 83 | movieweb.com | 22.00 | 8.00 | -14.00 |
| 84 | brides.com | 37.55 | 23.68 | -13.87 |
| 85 | crunchbase.com | 43.20 | 29.54 | -13.65 |
| 86 | architecturaldigest.com | 33.07 | 19.57 | -13.50 |
| 87 | ldoceonline.com | 41.07 | 27.60 | -13.46 |
| 88 | grainger.com | 23.66 | 10.38 | -13.27 |
| 89 | livescience.com | 26.12 | 12.90 | -13.23 |
| 90 | pcmag.com | 114.20 | 101.15 | -13.05 |
| 91 | denofgeek.com | 14.73 | 1.72 | -13.01 |
| 92 | frontiersin.org | 21.59 | 8.67 | -12.92 |
| 93 | zazzle.com | 20.67 | 7.89 | -12.78 |
| 94 | zoominfo.com | 21.85 | 9.19 | -12.66 |
| 95 | staples.com | 42.75 | 30.19 | -12.56 |
| 96 | gq.com | 18.21 | 5.74 | -12.48 |
| 97 | biomedcentral.com | 21.72 | 9.59 | -12.13 |
| 98 | rei.com | 45.34 | 33.21 | -12.13 |
| 99 | wellsfargo.com | 27.61 | 15.72 | -11.88 |
| 100 | interglot.com | 27.79 | 16.02 | -11.77 |
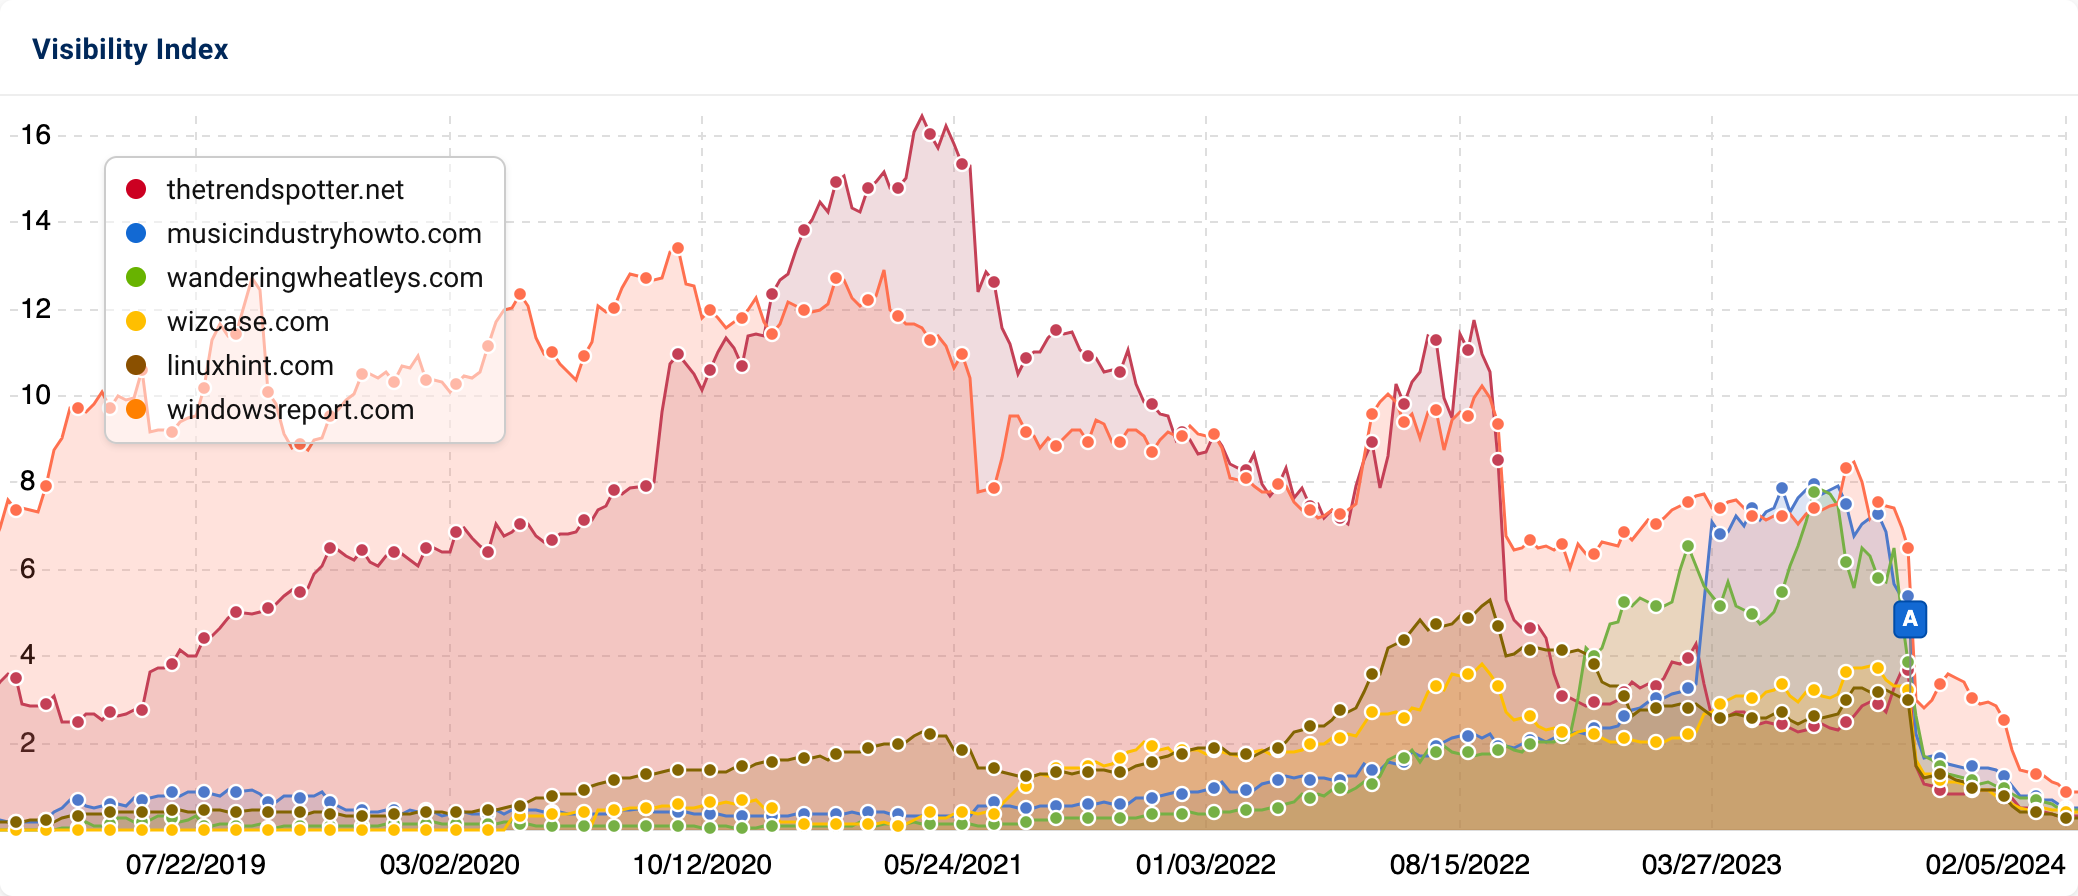
Biggest losers: travel & destination review sites
There is a clear pattern among the domains that lost the greatest visibility, in terms of average percentage losses: most of these sites fell into the travel & destination review category. This means the websites primarily focus on reviewing travel destinations, restaurants, hotels and other places. Most, if not all, of these websites contain aggressive advertising and/or affiliate links.
Some of the most heavily affected travel & destination review websites include (but are not limited to):
| Domain | Average Percentage Change |
|---|---|
| vacationidea.com | -98.89% |
| familydestinationsguide.com | -97.56% |
| tripstodiscover.com | -96.98% |
| treksplorer.com | -96.81% |
| viatravelers.com | -92.88% |
| reservations.com | -88.96% |
| restaurantclicks.com | -97.55% |
| planetware.com | -88.60% |
| planetofhotels.com | -88.54% |
| handluggageonly.co.uk | -87.56% |
| tourscanner.com | -86.89% |
| wanderingwheatleys.com | -84.76% |
| thecrazytourist.com | -84.57% |
| travel2next.com | -83.64% |
| booked.net | -80.01% |
| thrillist.com | -79.60% |
| theculturetrip.com | -78.29% |
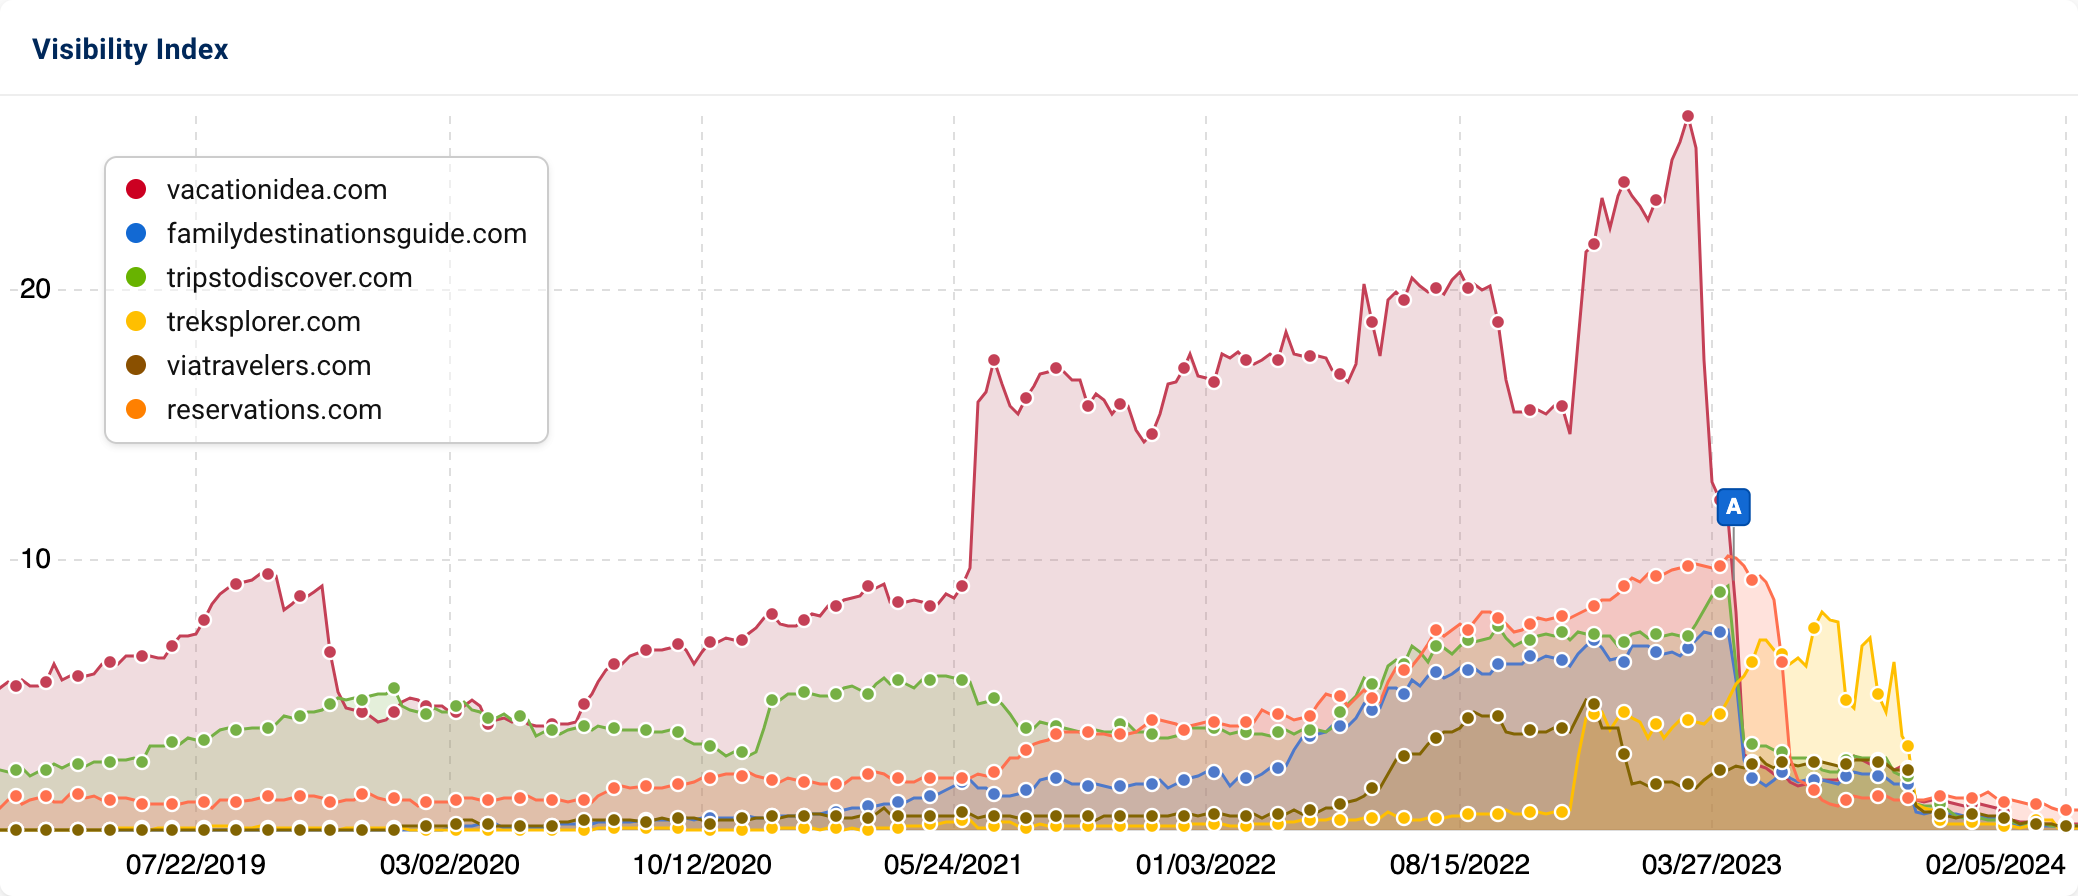
Several of the travel and review sites shown in the above chart saw significant declines during the April 2023 Reviews Update, marked with the pin “A” – particularly vacationidea.com, whose drop actually seems to have started during the March 2023 Core Update.
As a reminder, in April 2023, Google renamed what was previously its Product Reviews algorithm updates to simply Reviews Updates, which is included in its list of Google ranking systems. The impact of this change was significant: while the prior 6 “Product Reviews Updates” only affected websites containing reviews of physical products, expanding this ranking system to include all “Reviews” content means that any website reviewing anything – including places and destinations – is now eligible to be affected. This expanded definition likely explains why so many travel sites saw a massive decline during the April Reviews Update.
Google’s reviews system is meant to reduce the rankings of review content that lacks sufficient evidence that the author has truly visited the place, tried the product, or otherwise truly tested and evaluated the item they are reviewing. While this is a tough task to do algorithmically (and likely explains why Google has launched so many iterations of this update), looking at the content among some of the websites with the greatest declines gives us a clue about what Google was looking to devalue. Many of these sites:
- Do not include the names of the authors or any evidence that they exist
- The content does not contain any evidence that the author has truly visited those places.
- Use aggressive advertising and affiliate links, which in some cases distract from the main content or cause the recommendations and advice to appear slightly biased.
- Use generic stock photography instead of real photos of the destinations.
- Artificially edit dates, such as the below article which uses 2024 in the title, despite being last updated in 2022.


Lost rankings were often overtaken by higher authority websites, Google’s own properties (image and video search), the official websites for these destinations, or UGC sites such as Reddit.
To make matters worse, every one of these 6 sites saw substantial visibility declines during the September 2023 Helpful Content Update. This could indicate that many of the same issues that caused declines due to Google’s Reviews system might also be at play with Google’s updated Helpful Content System.
General product review websites
In addition to travel and destination review websites, many other types of review websites were affected. Another clear pattern can be seen among the domains that lost the greatest visibility, in terms of average percentage losses, in the general product review category.
Some of the most heavily affected general product review websites include (but are not limited to):
| Domain | Percentage Change |
|---|---|
| havecamerawilltravel.com | -95.28% |
| trulyexperiences.com | -91.60% |
| lovehairstyles.com | -91.11% |
| thecoolist.com | -89.06% |
| hotcars.com | -81.78% |
| brickset.com | -79.36% |
| bobvila.com | -77.74% |
| themanual.com | -76.91% |
| lifehack.org | -75.96% |
| hypebeast.com | -74.25% |
| foter.com | -72.32% |
| momlovesbest.com | -71.45% |
| hobbylobby.com | -70.12% |
| homedit.com | -66.56% |
| latest-hairstyles.com | -63.07% |
| kidsactivitiesblog.com | -61.74% |
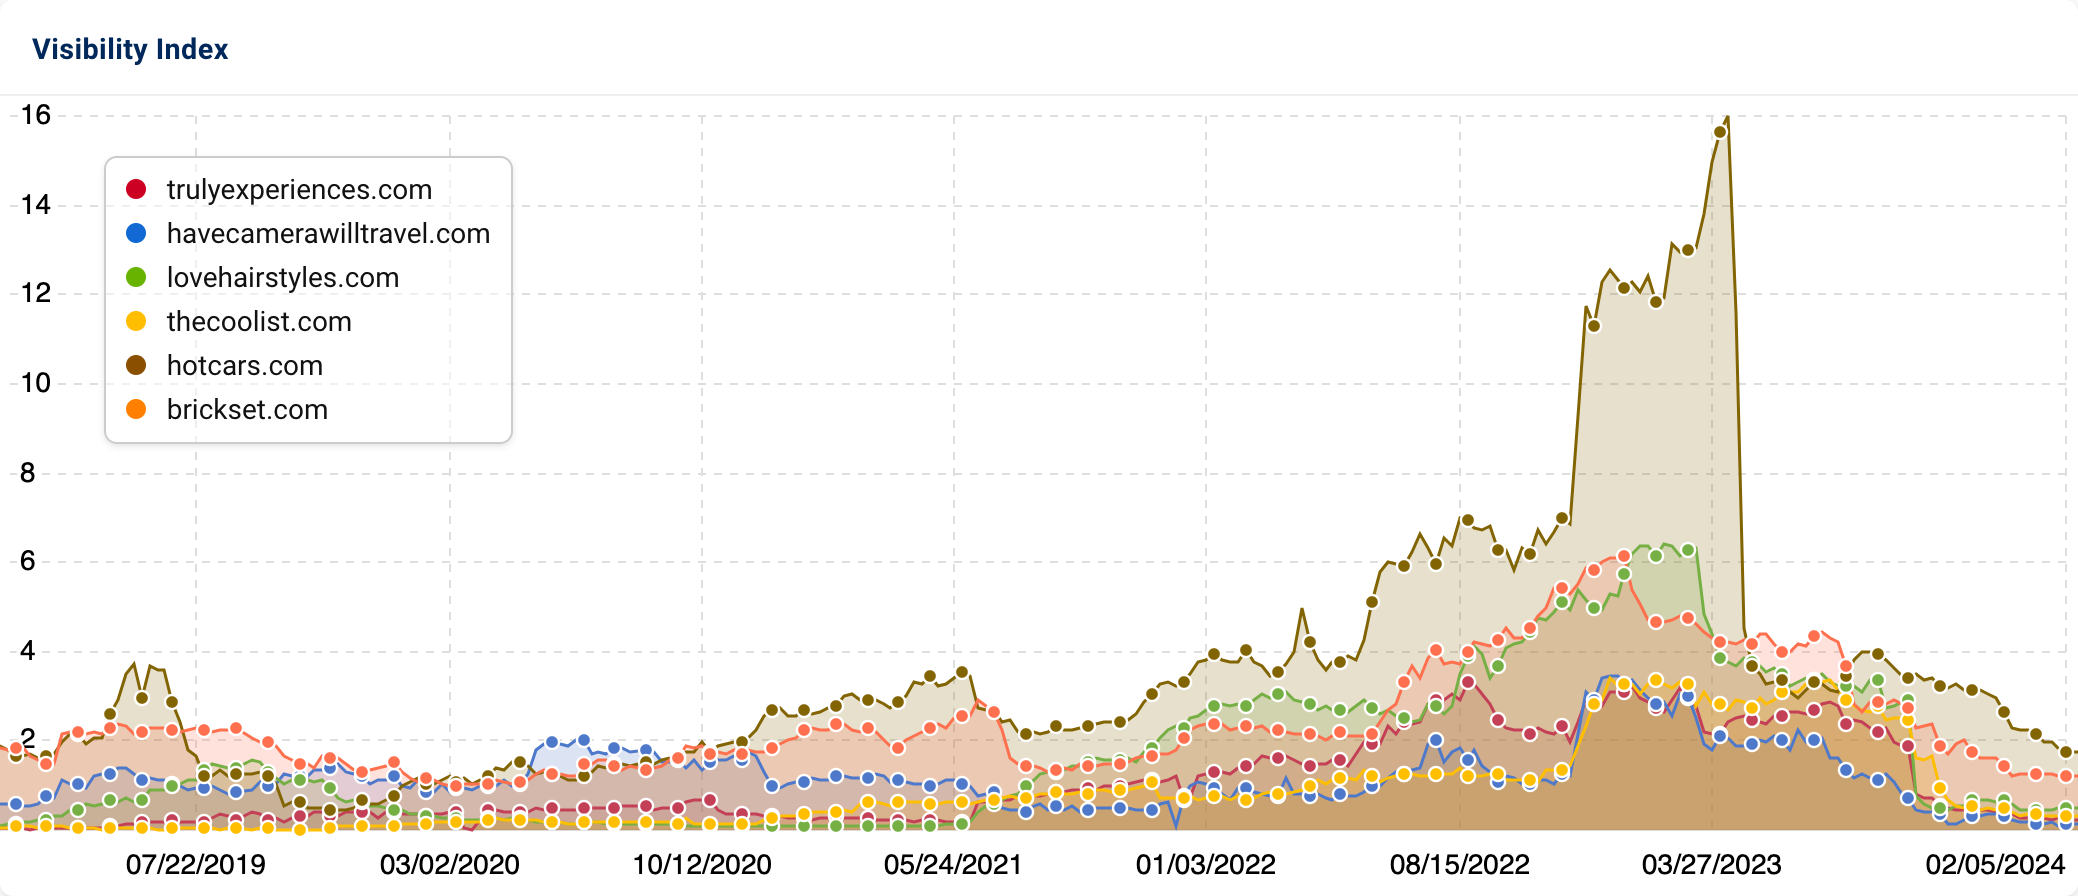
General product review sites focus on reviewing anything under the category we used ChatGPT to classify as “Hobbies and Collectibles.” This includes websites reviewing cameras, movies, cars, and other products. Most, if not all, of the websites contained in this category were hit by the February, April and November Reviews Updates as well as the March, August and November Core Updates. They were also hit by the September Helpful Content and October Spam Updates.
These sites contain many advertisements and, in some cases, offer a poor user experience. It appears that many of these sites lost top positions for broad keywords.
Lost rankings for high-volume keywords were often overtaken by higher authority websites like Amazon, Ebay, Walmart and Best Buy.
Again, with this category, there’s a clear sign showing what Google is looking to devalue:
- Thin content that doesn’t give much of a description of the products
- Sites that use aggressive advertising and affiliate links, which in some cases distract from the main content or cause the recommendations and advice to appear slightly biased
- Use generic stock photography instead of real photos of the products
E-commerce websites
In addition to websites reviewing products and locations, e-commerce was another heavily impacted category, with an average of a -47.39% drop across 23 domains in this category.
Below are some of the domains that saw the greatest average decline in terms of percentage visibility decreases:
| Domain | Percent Change |
|---|---|
| thekrazycouponlady.com | -73.90% |
| heb.com | -72.48% |
| 1stdibs.com | -70.56% |
| camelcamelcamel.com | -66.23% |
| flipkart.com | -65.29% |
| shopmyexchange.com | -58.54% |
| ebay.co.uk | -57.03% |
| samsclub.com | -54.72% |
| hsn.com | -53.92% |
| etsy.com | -52.61% |
| ebay.ca | -52.53% |
| retailmenot.com | -38.58% |
| tractorsupply.com | -34.85% |
| dealnews.com | -34.26% |
| ebay.com | -31.28% |
| walmart.com | -31.00% |
| staples.com | -29.38% |
| qvc.com | -28.49% |
| target.com | -26.98% |
Several of the biggest players in the e-commerce category in the U.S. saw significant absolute declines throughout 2023. The sites demonstrate a similar increase, then decline in overall visibility throughout 2023. The significant increases seen by these sites around February 2023 coincide closely with Google’s February 2023 Product Reviews Update, marked below with the pin “A”.
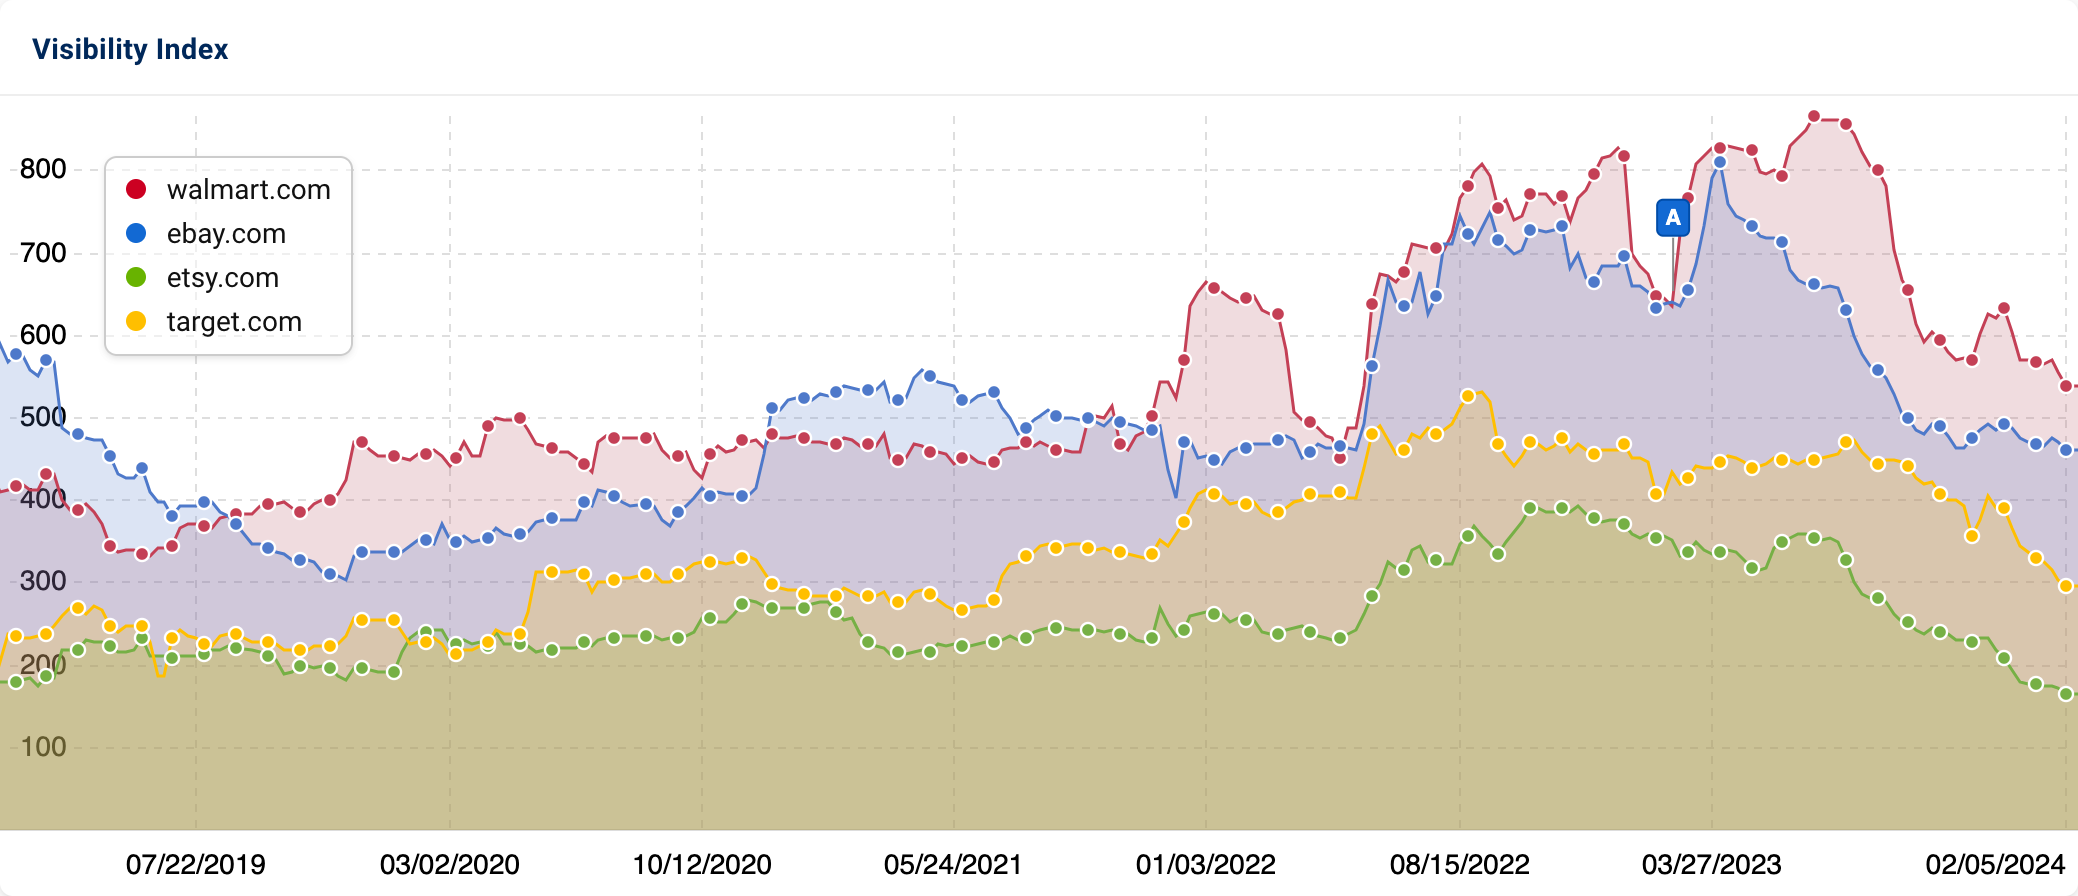
Looking at the keywords for which e-commerce sites gained rankings in February reveals some interesting trends:
For the keyword “beer,” observe how Walmart earned position #4 after the February 2023 Product Reviews update, despite not having ranked anywhere in the top 20 positions for that keyword one month prior.
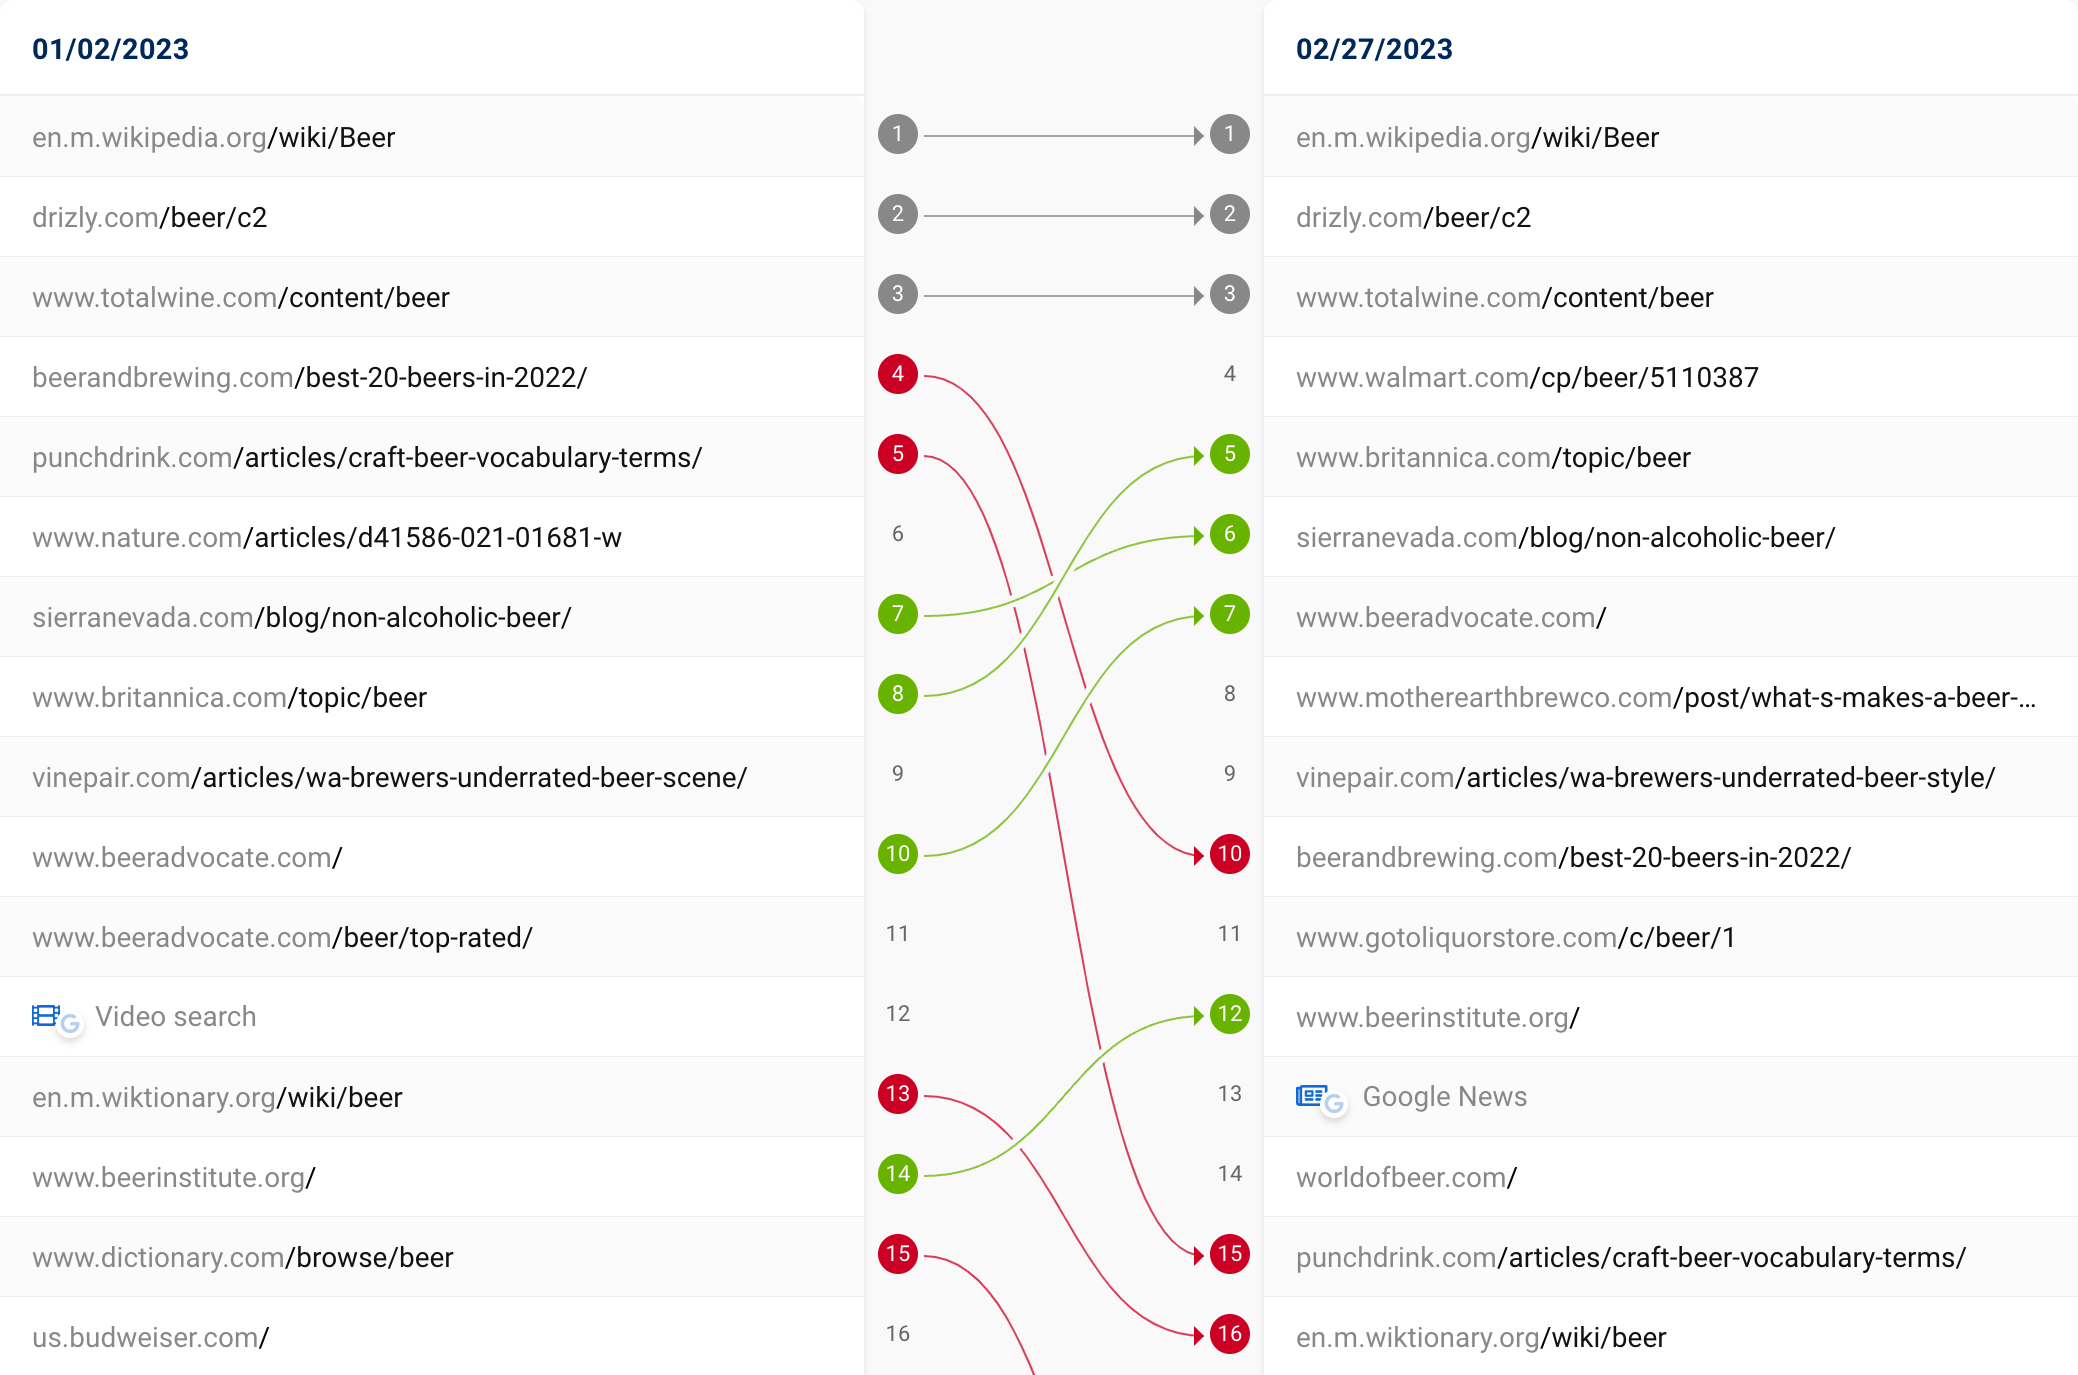
While Wikipedia and two other transactional results (Drizly and Total Wine) maintained top positions, several informational and product review sites fell out of the top 5 during this same period. This could signal an intent shift commonly seen during updates to Google’s Reviews system: fewer informational and review articles in top positions, and more transactional and e-commerce pages ranking there.
The keyword “food storage” shows another similar pattern in the SERP between January and February 2023:
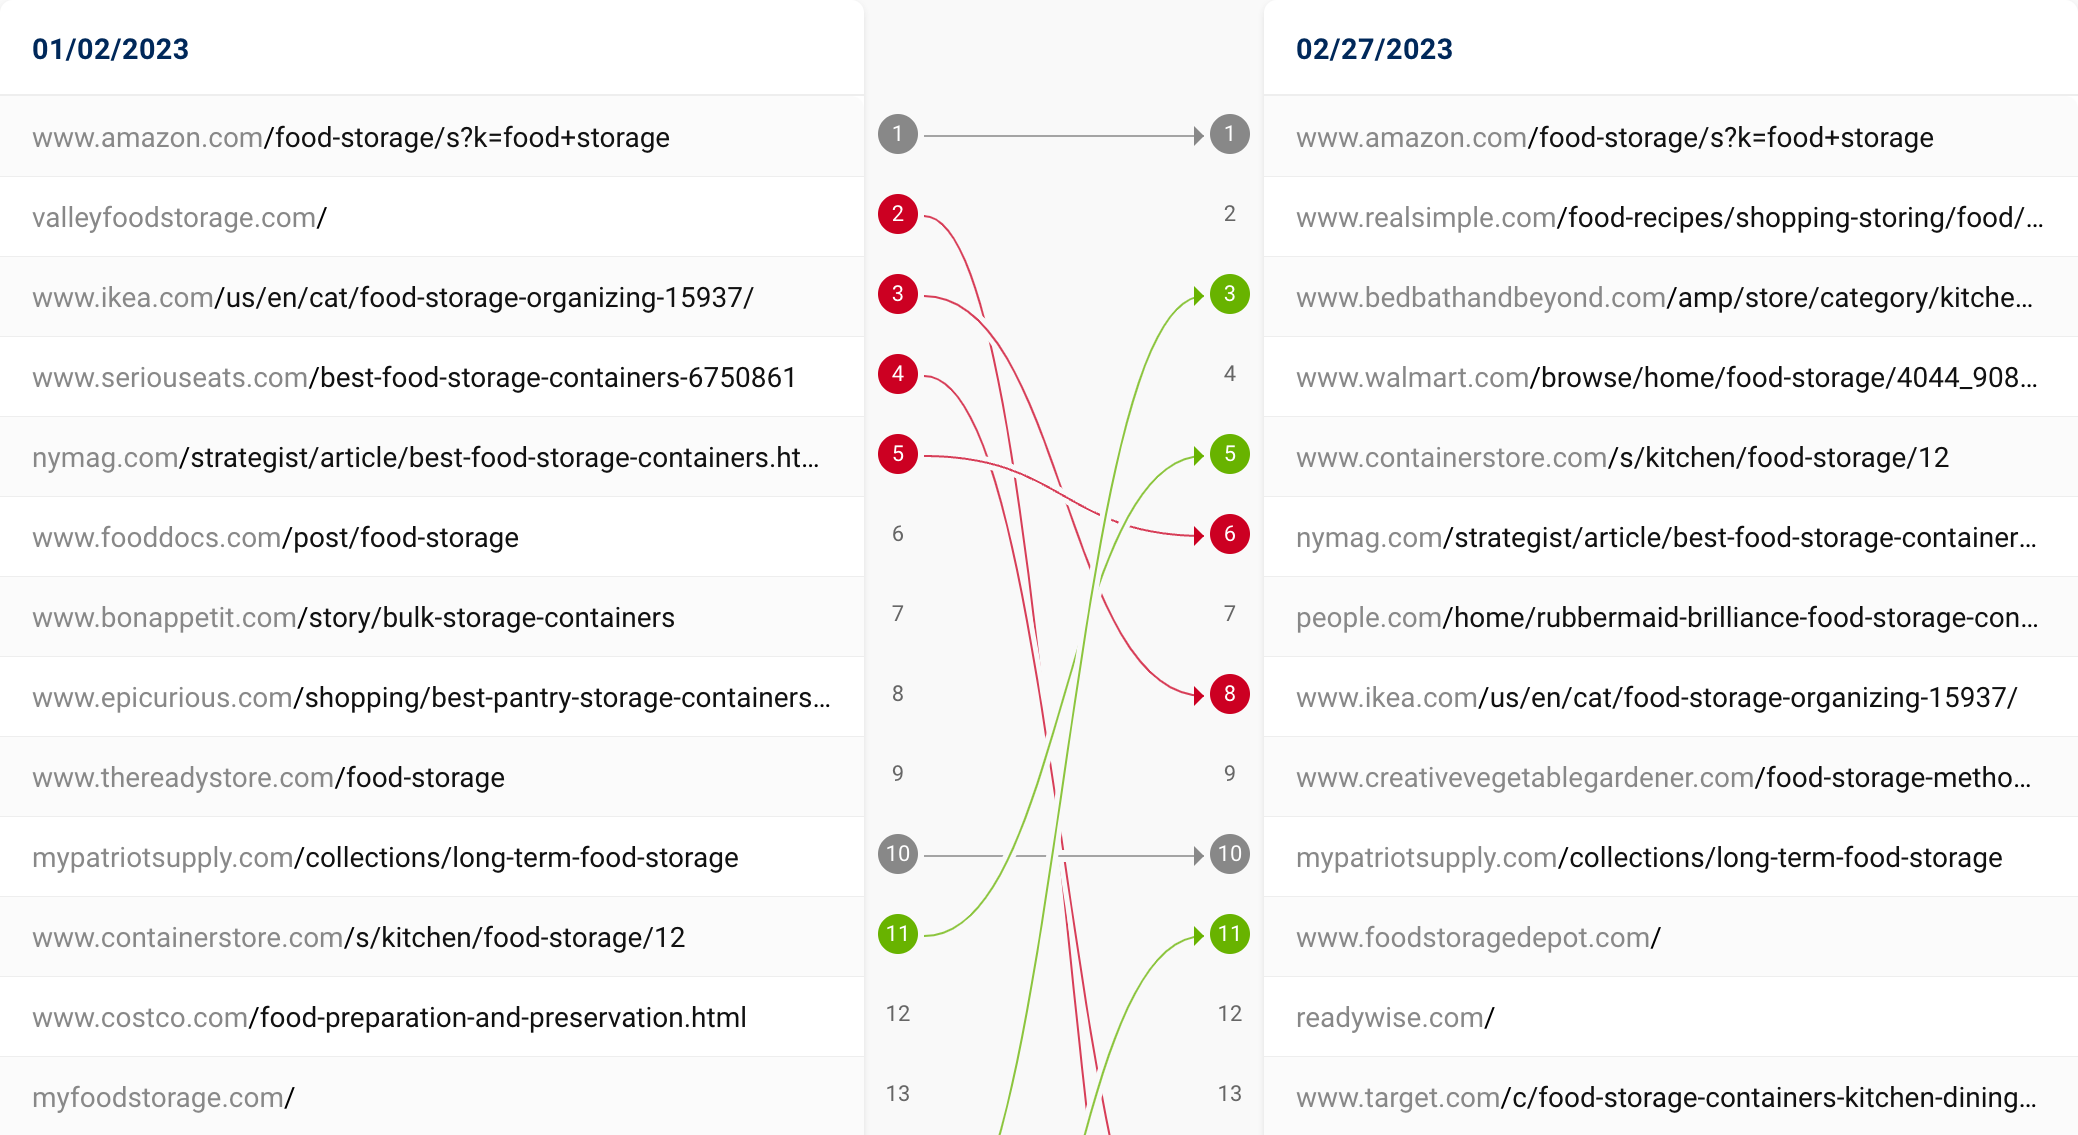
Aside from Real Simple’s article about “Food Storage Mistakes,” 4 out of 5 of the top ranking sites in February were transactional, e-commerce pages. Furthermore, a whopping 6 informational/review articles fell in rankings during the same period, with several falling entirely out of the top 20 results.
Later in the year, however, it appears that the SERP became a bit more diversified for generic keywords that could mean multiple things or indicate various intents, including a mix of transactional, informational, review and official government pages.
For example, for the keyword “Mucinex,” while the Mucinex official website maintained the top ranking throughout the 2nd half of the year, the SERP became more varied in November than it was in July.
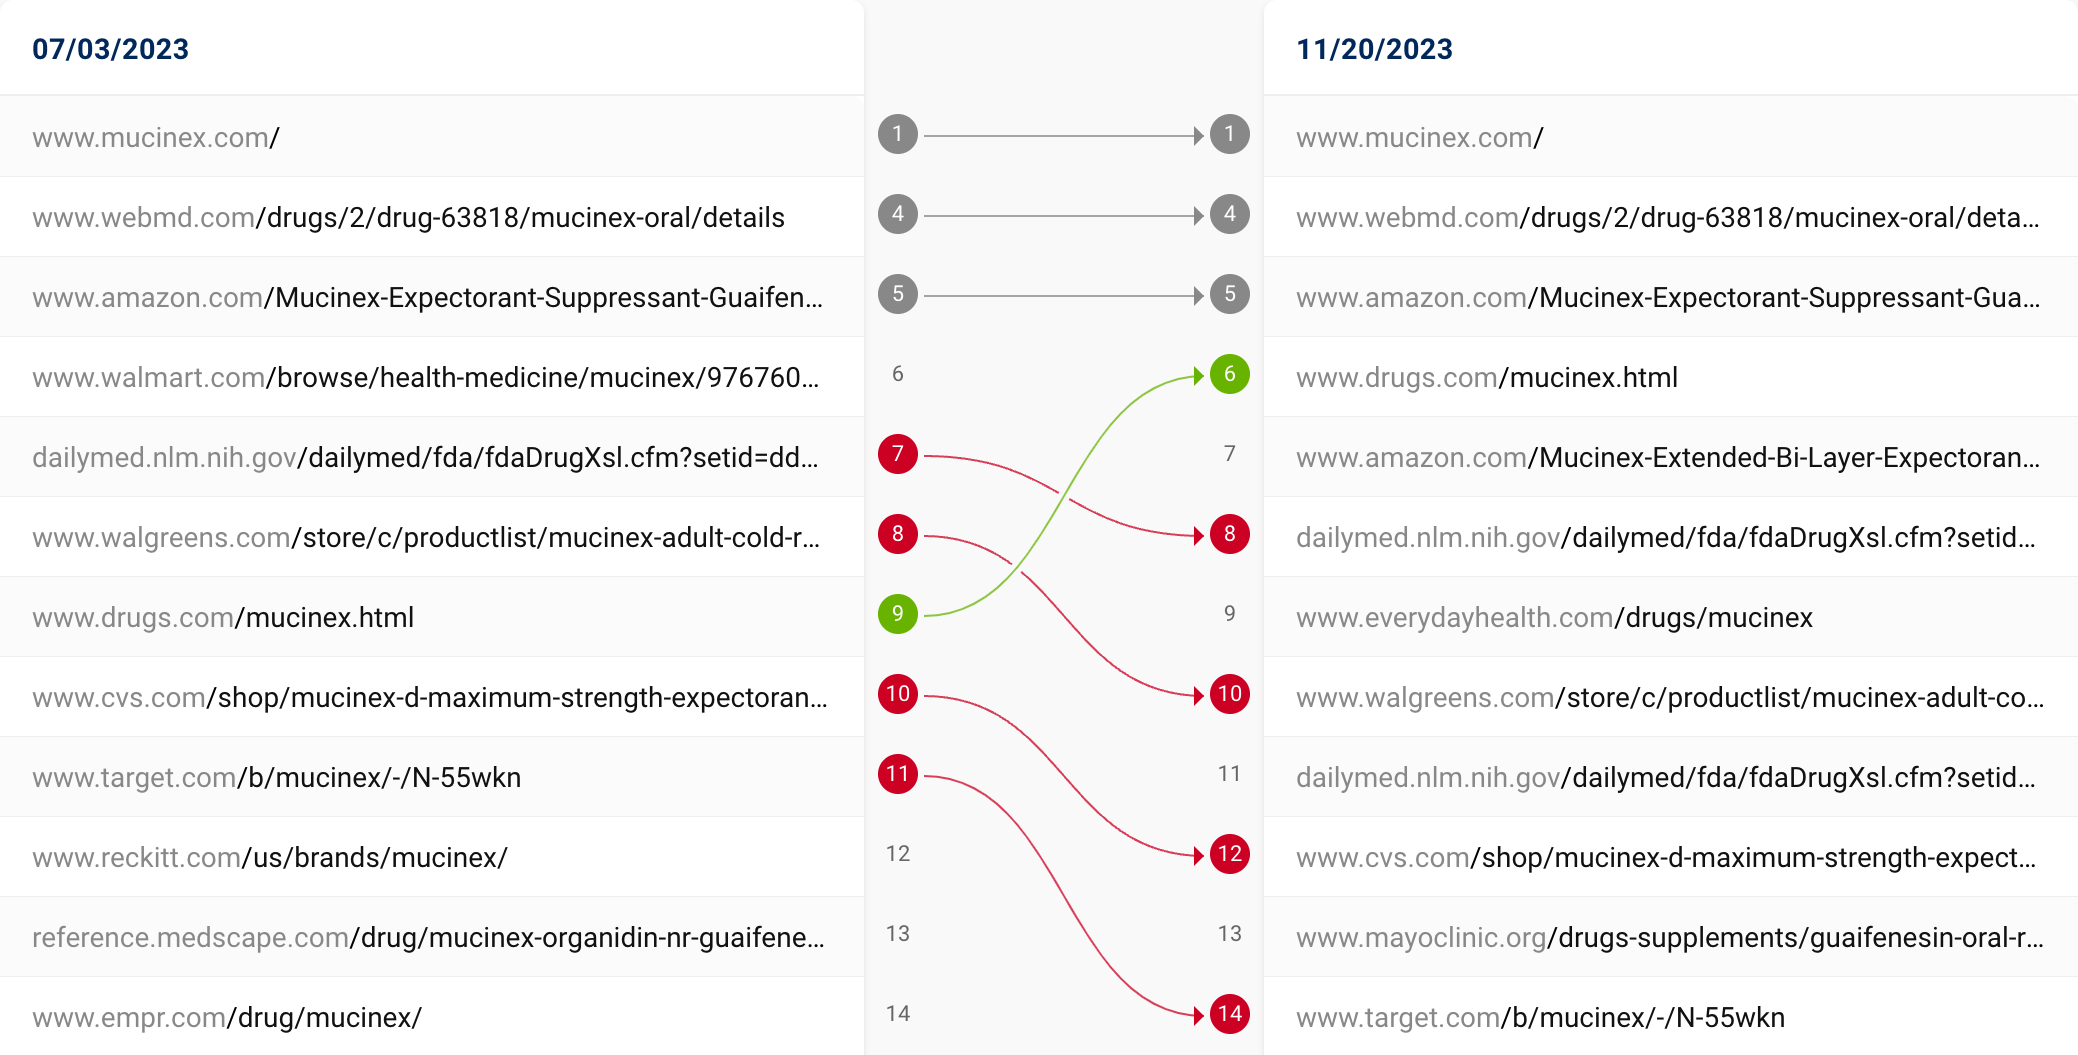
While July’s top results largely featured transactional pages, the SERP became more varied in November. The official Drugs.com page moved up in rankings, plus stronger rankings for Everyday Health, a new ranking from Daily Med (NIH), and a new ranking from Mayo Clinic. In addition to Walmart losing rankings for this term, Walgreens, CVS and Target also lost positions within the top 11.
The SERP may have become more transactional around the time of the February Reviews Update – with more e-commerce websites holding significant visibility – but it became more diverse later in the year.
Home furniture
Within the e-commerce category, several “home furniture” websites in particular saw significant losses.
While Overstock.com and BedBathandBeyond.com technically fall into this category, they are excluded given that their respective losses are explained by a merger/site migration. Beyond those sites, here are some “home furniture” sites with significant visibility declines:
| Domain | Percent Change | Absolute Change |
|---|---|---|
| thespruce.com | -50.27% | -40.9578 |
| wayfair.com | -30.42% | -35.1265 |
| lowes.com | -16.25% | -30.1901 |
| familyhandyman.com | -59.87% | -18.6988 |
| menards.com | -47.25% | -8.9525 |
| thisoldhouse.com | -40.55% | -6.3211 |
| northerntool.com | -65.97% | -5.3944 |
| williams-sonoma.com | -38.56% | -3.9893 |
| ferguson.com | -58.28% | -3.92 |
| lampsplus.com | -41.72% | -3.9112 |
| cb2.com | -50.52% | -3.3449 |
| build.com | -41.86% | -3.2101 |
| worldmarket.com | -63.90% | -2.9411 |
| appliancesconnection.com | -77.13% | -2.8081 |
| gardeningknowhow.com | -41.55% | -2.7038 |
| livingspaces.com | -48.76% | -1.8735 |
| kirklands.com | -23.52% | -1.8166 |
Below shows the sites with the greatest percentage visibility decreases in this category:
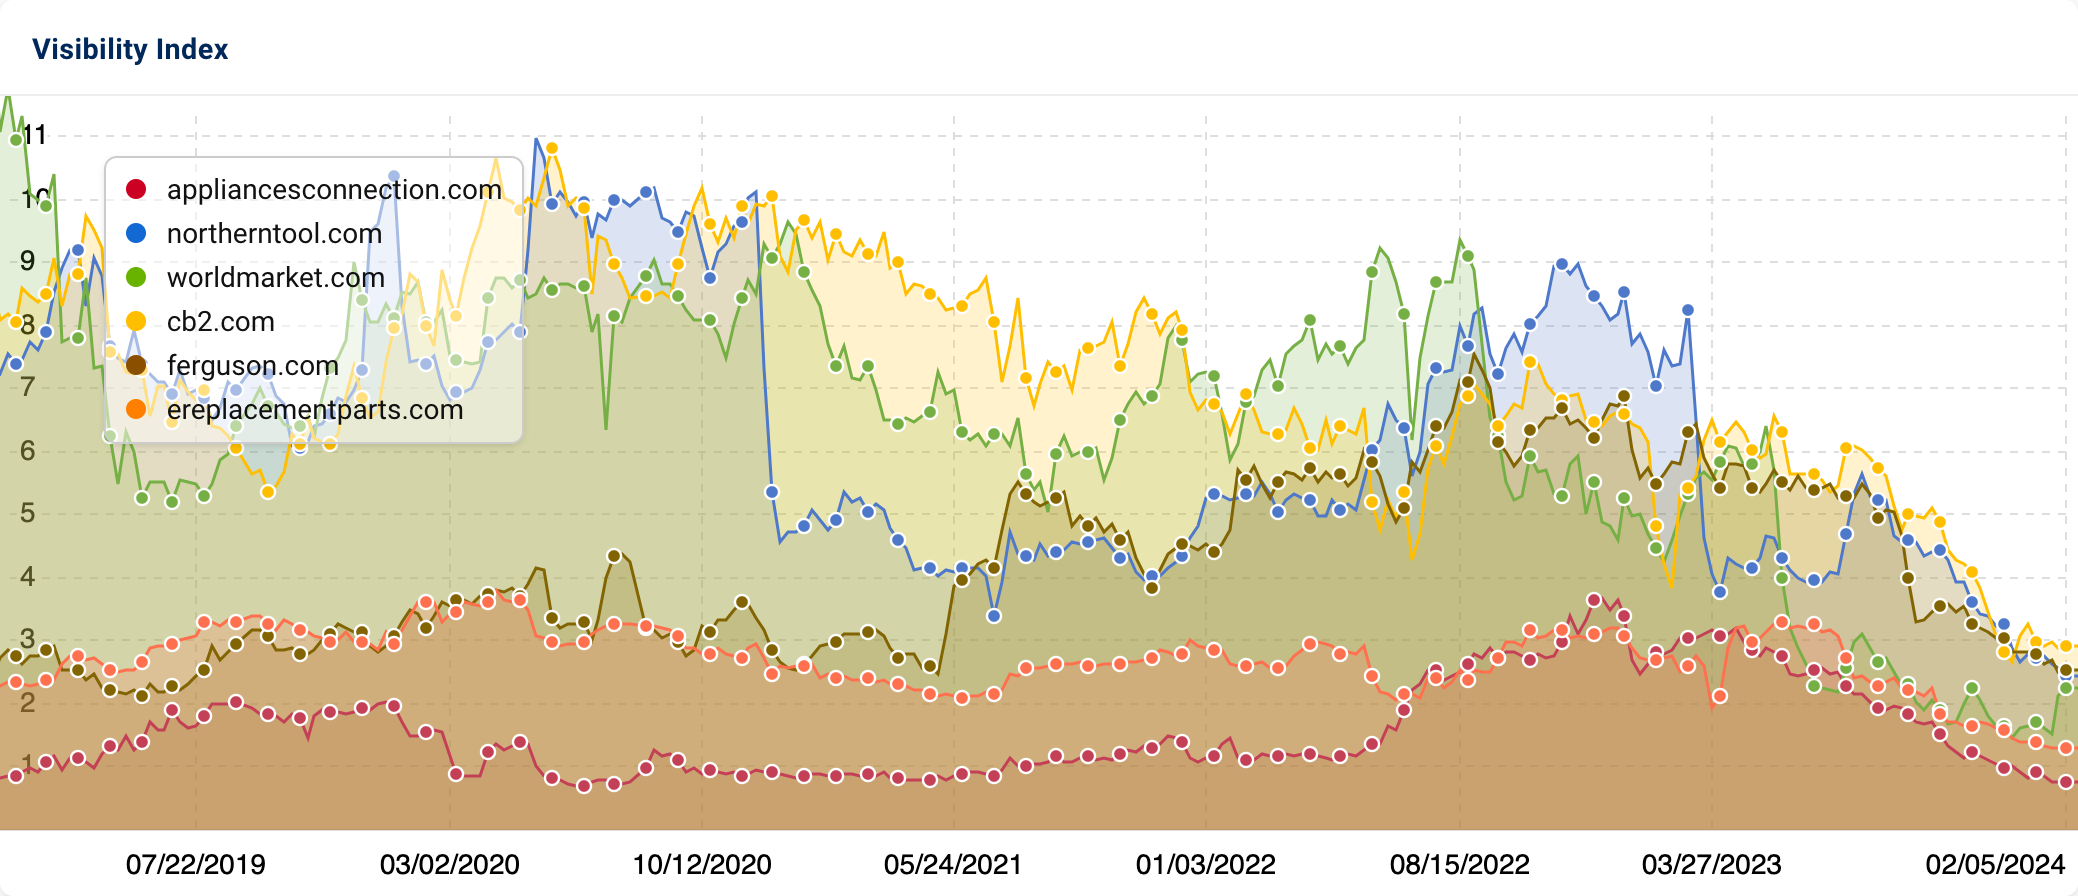
Followed by the sites with the greatest absolute decreases:
Most of these decreases among informational/affiliate sites in the “Home & Garden” category took place around the August 2023 Core Update and September Helpful Content Updates. Interestingly, each of the above 5 sites are seeing increases beginning in January 2024.
Helpful Content Update: Massive Losses Across Categories
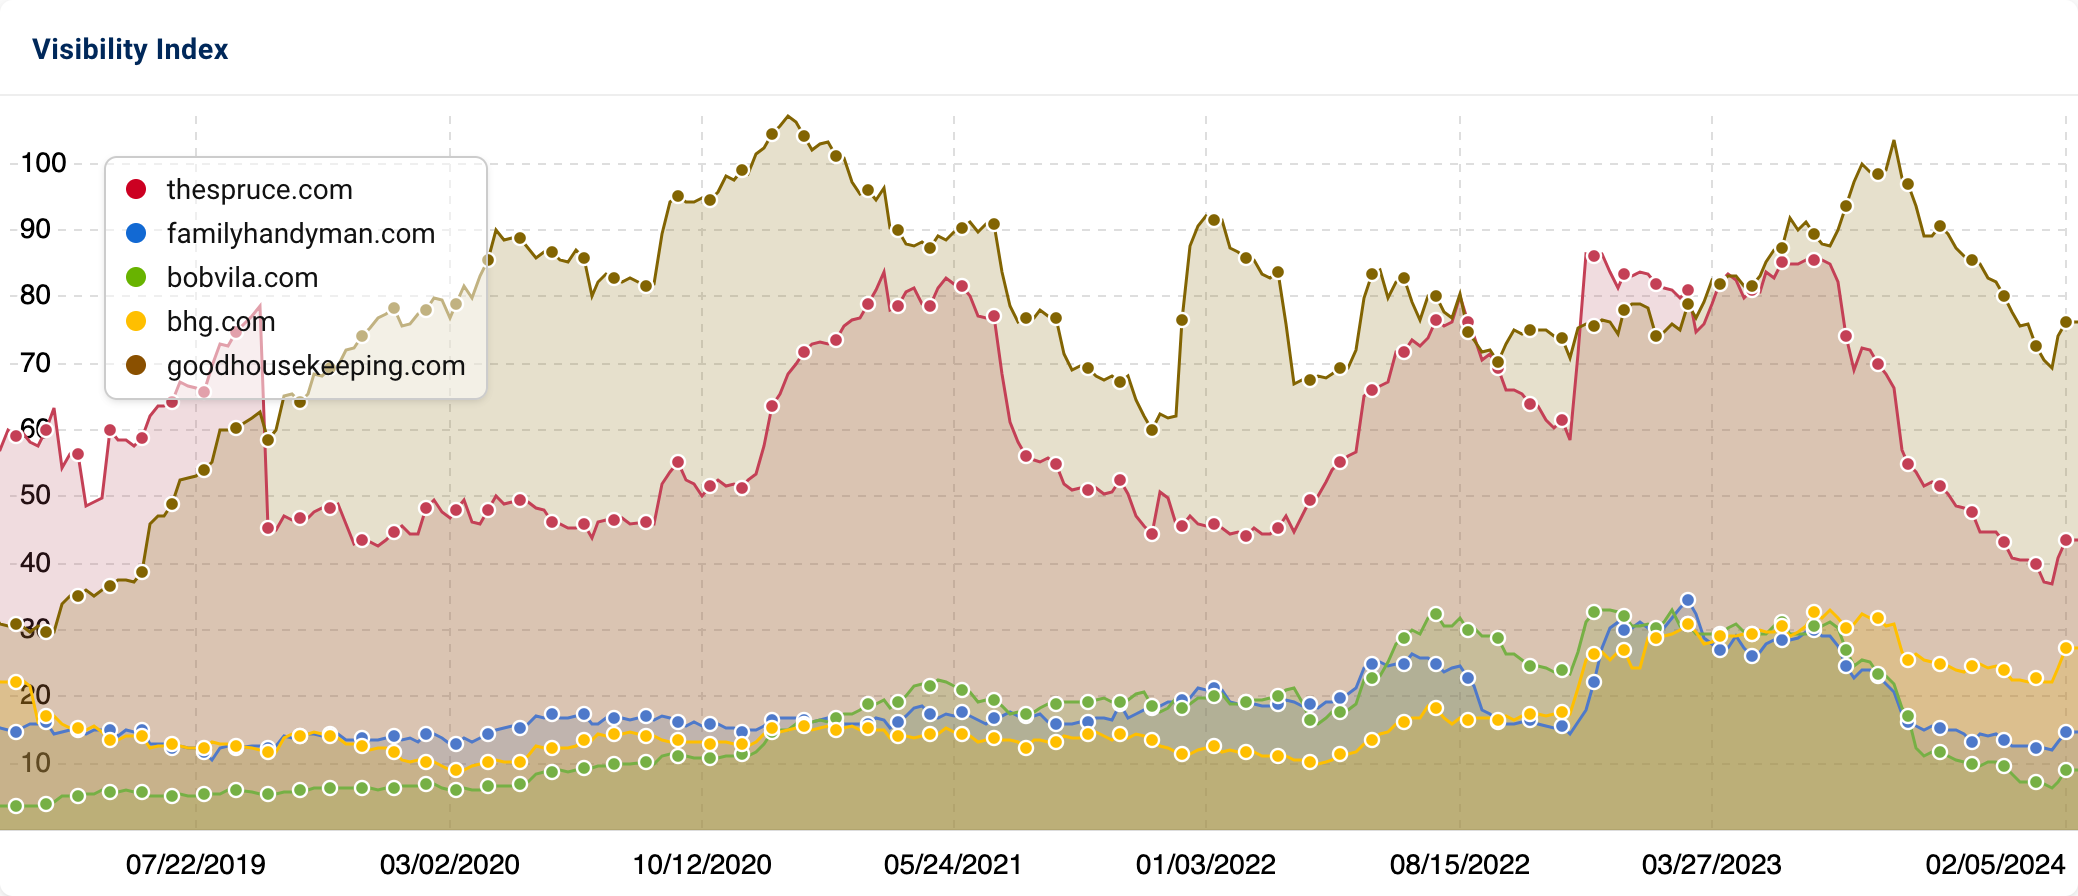
The Helpful Content Update in September was an SEO bloodbath, with thousands of sites losing huge amounts of visibility within the span of 2 weeks.
This chart shows a visual representation of what those visibility and traffic losses looked like for many sites – indicated by letter A in the above chart. The majority of impacted websites were informational and often affiliate websites that make money off ads and affiliate links. The sites spanned many different categories – such as fashion tips, home improvement, computer advice and more. Our SEO team at Amsive provided audits specifically to help companies affected by this update, and after auditing a few dozen websites, we noticed some of the following trends that Google’s algorithms may have been demoting:
- Aggressive advertisements, poor UX and excessive affiliate links
- Generic content lacking true E-E-A-T (experience, expertise, authoritativeness and trustworthiness)
- Stock photography instead of original images
- Too many pages targeting SEO-driven keywords
- Lack of branding
- Anonymous or unclear authors
The uproar from the SEO community regarding the outcomes of this update have caused Google to publicly respond numerous times, indicating that new updates are on the way. Given the SEO devastation many sites experienced in 2023 and continue to experience into the beginning of 2024, many site owners are awaiting these updates with great anticipation.
Methodology and Disclaimers for Analyzing Winners & Losers
Each year, we use the SISTRIX Visibility Index to measure the domains with the strongest organic visibility growth and declines on Google.com in the U.S. This year, we looked at the top 1,000 domains from each of the following categories: biggest winners (percentage visibility growth); biggest winners (absolute visibility growth); biggest losers (percent visibility decline); and biggest losers (absolute visibility declines). Deduping this list resulted in a total list of 2,496 domains for the below analysis.
As a reminder, SISTRIX measures rankings of over 100 million domains for 100 million keywords on Google. The data below will focus specifically on Google’s U.S. index (Google.com).
By actively measuring the rankings across a representative keyword set, the SISTRIX data is free from external influences such as seasonality, the weather, vacation times and other external factors and trends. The data shown below is collected from mobile search rankings only.
As a sidenote: implementing an SEO strategy is one of many variables that can influence how a website fares during these algorithm updates. Organic search rankings may also be influenced by factors such as QDF (query deserves freshness), political and global events, significant shifts in consumer behavior (such as government-imposed lockdowns), seasonality, and more.
While many visibility changes can be tied to specific SEO efforts, others could be influenced by these external factors, or could simply be the result of Google developing a better understanding of how to best meet search intent.
Classification of domains
First, ChatGPT was able to generate broad categories for the nearly 2,500 domains, but it led to some redundant and repetitive category names (such as singular and plural versions). Once the broad categories were generated, I then used ChatGPT to cluster similar terms into logical “parent” categories, which, with some tweaking, led to the following 55 category groups:
| Categories | |
|---|---|
| Adult Content | Information & Research |
| Advocacy and Nonprofit | Insurance |
| Appliances | International Organization |
| Art & Culture | Jewelry & Accessories |
| Automotive | Language Tools |
| Baby & Kids Clothing | Law & Government |
| Beauty & Fragrances | Lyrics & Music |
| Books & Literature | Marketing |
| Business & Finance | Museum |
| Career & Job Search | Music & Entertainment |
| Classifieds | News & Media |
| Consumer Electronics | Personal Care |
| Consumer Goods & Retail | Personal Development |
| Dating | Pest Control |
| E-commerce | Pets & Animals |
| Education & Learning | Product Reviews |
| Employment | Real Estate |
| Entertainment & Social Media | Religion & Spirituality |
| Environment | Science & Education |
| Family & Parenting | Social Media, User Generated Content & Forums |
| Fashion & Apparel | Sports & Outdoor Equipment |
| Food & Delivery | Sports Teams & Sports Publishers |
| Games & Puzzles | Streaming |
| Gaming Blogs & Forums | Technology & Computing |
| Graphics, Images & Stock Photos | Toys & Games |
| Health & Nutrition | Transportation |
| Hobbies & Collectibles | Travel Directories & Blogs |
| Home & Furniture |
Global IndexWatch 2023 reports
- IndexWatch UK Winners
- IndexWatch UK Losers
- IndexWatch DE Winners
- IndexWatch DE Losers
- IndexWatch ES Winners
- IndexWatch ES Losers
- IndexWatch IT Winners
- IndexWatch IT Losers
- IndexWatch FR Winners
- IndexWatch FR Losers
Note: thanks to my SEO intern, Silvia Gituto, for help analyzing data for this article.