
2023 was an unforgettable year in the SEO industry. In this report you’ll find the SISTRIX annual winners list and analysis of some of the more interesting gains. AI tools have also been used to categorise domains to expose sector-specific data.
- 2023 Search Summary
- Methodology and Disclaimers for Analyzing Winners & Losers
- AI Classification of Domains
- Biggest Domain Winners of SEO Visibility in 2023
- Biggest winners in terms of absolute visibility increases:
- Biggest winners in terms of percentage visibility increases:
- Categories of Winners
- UGC & Social Media
- Law & Government
- Health & Nutrition
- Travel
- Reference & Dictionary Sites
- Takeaways
- List of domain categorisations generated via ChatGPT
- Global IndexWatch 2023 reports
All our IndexWatch reports, covering six countries, are listed below.
2023 Search Summary
From the start of the year, it was clear that newly minted generative AI tools, including ChatGPT and others like it, were poised to create an unprecedented challenge to Google search by allowing for the exponential growth of AI-generated content.
At GoogleIO, Google revealed several new generative-AI products and features it would be introducing into its own search experience, most notably, its new Search Generative Experience (SGE), which could fundamentally alter the organic search experience (if and when it ever becomes live).
Google also announced various updates to how it displays and ranks results, including the introduction of Hidden Gems, Perspectives, Community Notes, and massive updates to several of its ranking systems, such as the Helpful Content and Reviews systems.
Toward the back end of the year, Google faced significant pushback and feedback from many disgruntled site owners who expressed discontent with changes to Google’s results. Much of the dissatisfaction with Google’s results stemmed from the dominance of a relatively small handful of authoritative sites that consistently rank for many high-volume, competitive keywords, particularly related to product reviews.
This and other issues related to spam and an influx of low-quality affiliate content got the attention of Google, who publicly responded multiple times, indicating that they were working on algorithmic solutions to address common complaints and feedback.
This year’s IndexWatch allows us to see whether the data supports the various narratives related to how Google’s results have been changing. This article is the first of a two-part series and will focus primarily on the biggest visibility winners in 2023, followed by a similar article covering the biggest losers.
Methodology and Disclaimers for Analyzing Winners & Losers
Each year, we use the SISTRIX Visibility Index to measure the domains with the strongest organic visibility growth and declines on Google.com in the U.S. This year, we looked at 1,000 domains from each of the following categories: biggest winners (percentage visibility growth); biggest winners (absolute visibility growth); biggest losers (percent visibility decline); and biggest losers (absolute visibility declines). Deduping this list resulted in a total list of 2,496 domains for the below analysis.
As a reminder, SISTRIX measures rankings of over 100 million domains for 100 million keywords on Google. The data below will focus specifically on Google’s U.S. index (Google.com).
By actively measuring the rankings across a representative keyword set, the SISTRIX data is free from external influences such as seasonality, the weather, vacation times and other external factors and trends. The data shown below is collected from mobile search rankings only.
As a sidenote: implementing an SEO strategy is one of many variables that can influence how a website fares during these algorithm updates. Organic search rankings may also be influenced by factors such as QDF (query deserves freshness), political and global events, significant shifts in consumer behavior (such as government-imposed lockdowns), seasonality, and more.
While many visibility changes can be tied to specific SEO efforts, others could be influenced by these external factors, or could simply be the result of Google developing a better understanding of how to best meet search intent.
AI Classification of Domains
In the spirit of using generative AI to enhance our analysis, this year, I used ChatGPT to classify the domains into logical categories.
These 55 categories were used to identify and observe trends among the greatest visibility winners and losers in 2023. More detail on the process, and the full list of categories, is available at the end of the article.
Biggest Domain Winners of SEO Visibility in 2023
Biggest winners in terms of absolute visibility increases:
| # | Domain | Change | 02.01.2023 | 01.01.2024 |
|---|---|---|---|---|
| 1 | wikipedia.org | 973.42 | 6028.93 | 7002.34 |
| 2 | reddit.com | 598.75 | 69.04 | 667.79 |
| 3 | instagram.com | 289.17 | 608.04 | 897.21 |
| 4 | merriam-webster.com | 250.97 | 1100.90 | 1351.87 |
| 5 | linkedin.com | 201.89 | 187.81 | 389.69 |
| 6 | quora.com | 185.21 | 62.87 | 248.08 |
| 7 | nih.gov | 149.74 | 254.57 | 404.32 |
| 8 | cambridge.org | 141.70 | 564.38 | 706.08 |
| 9 | tripadvisor.com | 125.50 | 482.63 | 608.12 |
| 10 | britannica.com | 111.81 | 635.06 | 746.87 |
| 11 | imdb.com | 99.04 | 915.04 | 1014.08 |
| 12 | apple.com | 86.03 | 193.27 | 279.30 |
| 13 | clevelandclinic.org | 83.20 | 154.12 | 237.32 |
| 14 | vocabulary.com | 70.74 | 190.31 | 261.05 |
| 15 | twitter.com | 66.64 | 224.94 | 291.58 |
| 16 | microsoft.com | 66.38 | 461.37 | 527.75 |
| 17 | indeed.com | 57.35 | 239.52 | 296.87 |
| 18 | genius.com | 56.54 | 251.75 | 308.29 |
| 19 | hotels.com | 51.19 | 173.35 | 224.53 |
| 20 | investopedia.com | 49.62 | 187.33 | 236.94 |
| 21 | tiktok.com | 49.35 | 41.11 | 90.46 |
| 22 | mayoclinic.org | 47.09 | 290.27 | 337.36 |
| 23 | adobe.com | 38.99 | 117.97 | 156.96 |
| 24 | ca.gov | 35.15 | 113.95 | 149.10 |
| 25 | webmd.com | 34.77 | 225.76 | 260.53 |
| 26 | cornell.edu | 29.31 | 75.78 | 105.09 |
| 27 | betterhealth.vic.gov.au | 29.20 | 17.08 | 46.28 |
| 28 | techtarget.com | 28.60 | 81.21 | 109.81 |
| 29 | allrecipes.com | 28.29 | 57.81 | 86.10 |
| 30 | expedia.com | 28.03 | 188.17 | 216.21 |
| 31 | medicalnewstoday.com | 27.74 | 78.17 | 105.90 |
| 32 | medium.com | 27.58 | 32.29 | 59.87 |
| 33 | stackoverflow.com | 26.68 | 28.27 | 54.95 |
| 34 | usatoday.com | 25.73 | 46.74 | 72.47 |
| 35 | canon.com | 25.00 | 44.94 | 69.93 |
| 36 | ziprecruiter.com | 24.80 | 32.14 | 56.94 |
| 37 | goodreads.com | 24.78 | 76.95 | 101.73 |
| 38 | gettyimages.com | 24.32 | 35.85 | 60.16 |
| 39 | sciencedirect.com | 24.20 | 95.62 | 119.82 |
| 40 | study.com | 23.30 | 37.57 | 60.88 |
| 41 | soundcloud.com | 23.16 | 54.08 | 77.23 |
| 42 | weather.com | 23.08 | 34.16 | 57.24 |
| 43 | homes.com | 22.60 | 20.94 | 43.54 |
| 44 | byjus.com | 22.31 | 23.30 | 45.61 |
| 45 | oxfordlearnersdictionaries.com | 22.23 | 24.59 | 46.82 |
| 46 | pbs.org | 22.23 | 33.05 | 55.28 |
| 47 | usa.gov | 22.04 | 50.74 | 72.78 |
| 48 | canva.com | 21.79 | 31.25 | 53.04 |
| 49 | istockphoto.com | 21.53 | 49.20 | 70.73 |
| 50 | cia.gov | 21.05 | 1.72 | 22.77 |
| 51 | bandcamp.com | 20.92 | 31.30 | 52.22 |
| 52 | steamcommunity.com | 20.68 | 9.85 | 30.53 |
| 53 | southernliving.com | 20.60 | 19.17 | 39.77 |
| 54 | rottentomatoes.com | 20.01 | 187.06 | 207.07 |
| 55 | loc.gov | 19.71 | 34.67 | 54.38 |
| 56 | google.com | 18.95 | 707.04 | 726.00 |
| 57 | superuser.com | 18.85 | 7.52 | 26.37 |
| 58 | netflix.com | 18.82 | 60.02 | 78.84 |
| 59 | nasa.gov | 18.56 | 36.18 | 54.73 |
| 60 | metacritic.com | 18.41 | 25.17 | 43.59 |
| 61 | people.com | 18.26 | 51.15 | 69.40 |
| 62 | visittheusa.com | 17.96 | 13.63 | 31.59 |
| 63 | cbsnews.com | 17.60 | 21.75 | 39.36 |
| 64 | www.nhs.uk | 17.57 | 76.72 | 94.28 |
| 65 | ikea.com | 17.56 | 47.33 | 64.89 |
| 66 | freepik.com | 17.14 | 25.01 | 42.15 |
| 67 | time.com | 16.89 | 20.53 | 37.43 |
| 68 | wordpress.com | 16.88 | 21.69 | 38.57 |
| 69 | hopkinsmedicine.org | 16.70 | 71.83 | 88.54 |
| 70 | poki.com | 16.36 | 30.24 | 46.60 |
| 71 | state.gov | 16.30 | 58.37 | 74.68 |
| 72 | wikihow.com | 16.00 | 74.78 | 90.78 |
| 73 | census.gov | 15.99 | 27.52 | 43.51 |
| 74 | lonelyplanet.com | 15.71 | 27.86 | 43.57 |
| 75 | coursera.org | 15.58 | 24.92 | 40.50 |
| 76 | apnews.com | 14.54 | 16.44 | 30.98 |
| 77 | unsplash.com | 14.46 | 88.18 | 102.64 |
| 78 | facebook.com | 14.31 | 1000.70 | 1015.01 |
| 79 | nerdwallet.com | 13.93 | 106.13 | 120.06 |
| 80 | themoviedb.org | 13.64 | 16.95 | 30.59 |
| 81 | harvard.edu | 13.53 | 74.87 | 88.40 |
| 82 | weather.gov | 13.52 | 23.00 | 36.51 |
| 83 | si.edu | 13.42 | 25.00 | 38.42 |
| 84 | softonic.com | 13.36 | 45.20 | 58.56 |
| 85 | crazygames.com | 13.31 | 46.43 | 59.74 |
| 86 | bls.gov | 13.03 | 41.15 | 54.18 |
| 87 | streetdirectory.com | 12.84 | 17.53 | 30.37 |
| 88 | noaa.gov | 12.83 | 23.21 | 36.03 |
| 89 | allmusic.com | 12.76 | 19.59 | 32.35 |
| 90 | drugs.com | 12.75 | 33.20 | 45.95 |
| 91 | screenrant.com | 12.71 | 13.37 | 26.08 |
| 92 | verywellhealth.com | 12.42 | 26.03 | 38.45 |
| 93 | who.int | 12.36 | 37.51 | 49.87 |
| 94 | healthdirect.gov.au | 12.18 | 6.80 | 18.98 |
| 95 | go.com | 12.10 | 45.63 | 57.72 |
| 96 | steampowered.com | 12.05 | 102.33 | 114.39 |
| 97 | food.com | 12.02 | 3.97 | 15.99 |
| 98 | kayak.com | 11.99 | 146.17 | 158.16 |
| 99 | health.com | 11.54 | 5.44 | 16.98 |
| 100 | yourdictionary.com | 11.52 | 29.58 | 41.10 |
One of the most notable trends among the winning sites is that six of the top 10 domains with the largest absolute increases in visibility predominantly rely on user-generated content (UGC).
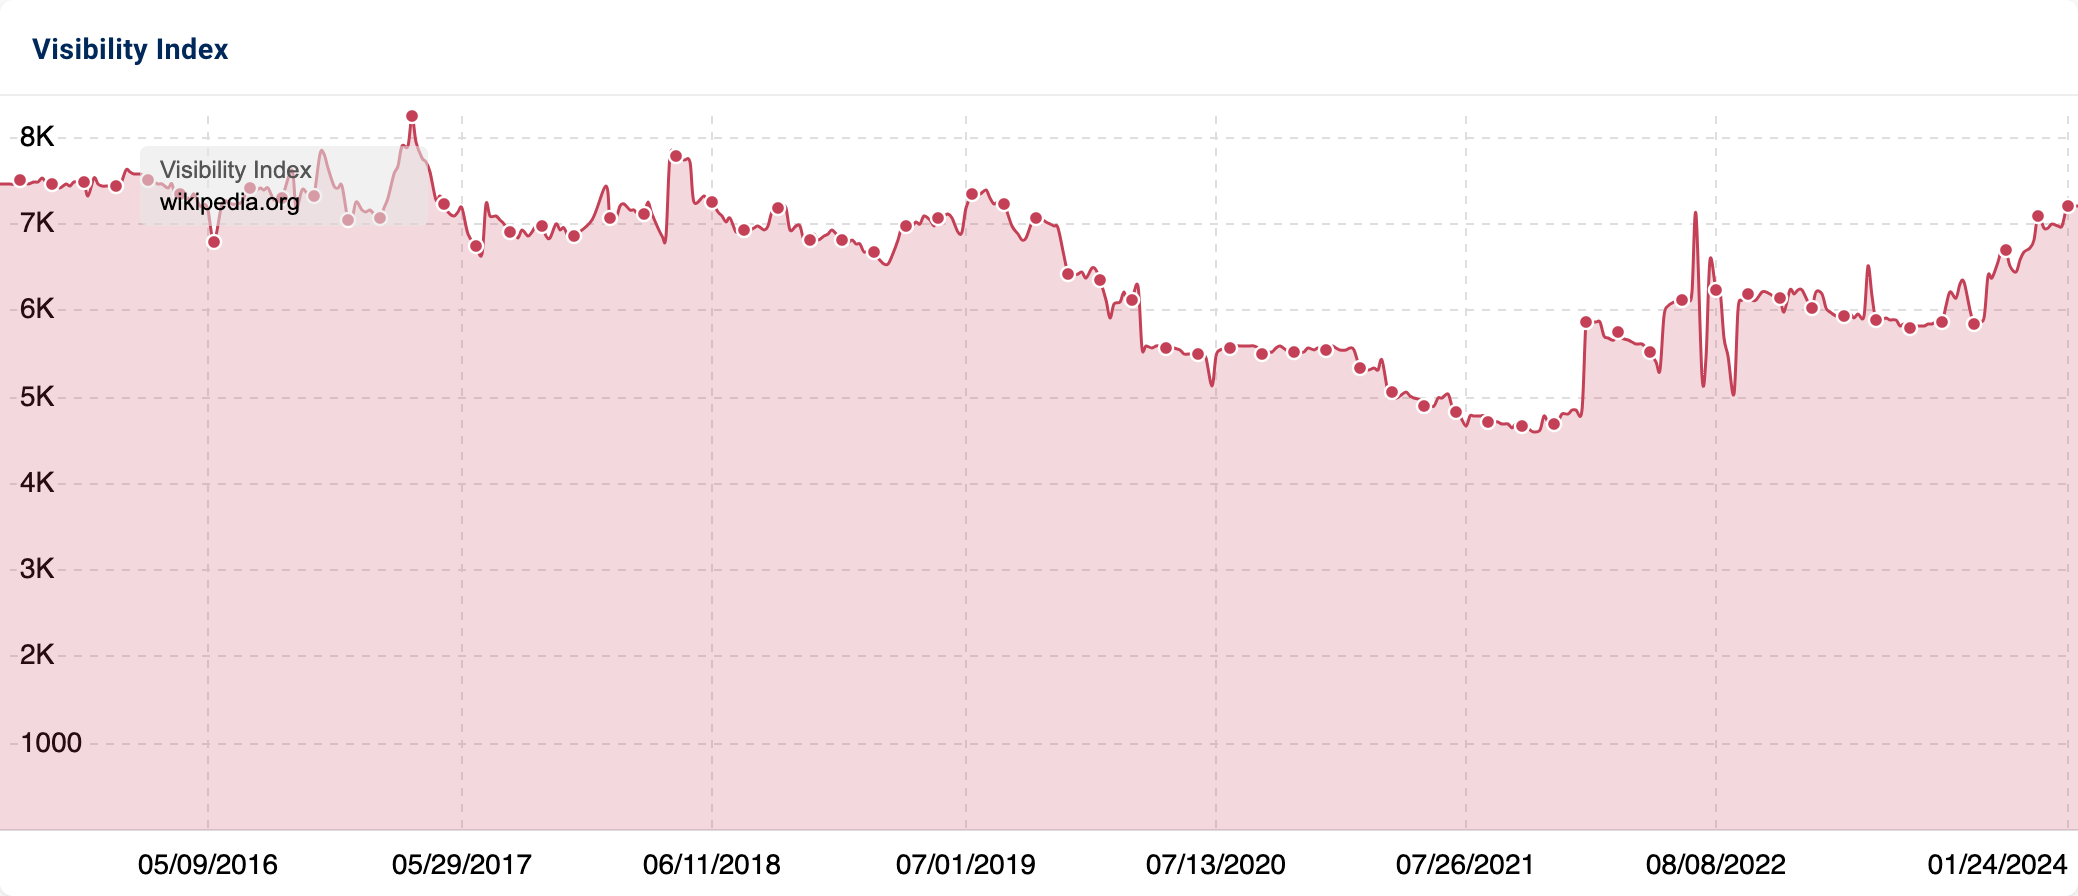
Wikipedia, which is technically composed entirely of user-generated content (albeit content that is notoriously hard for users to edit), was the greatest overall winner, with an increase of a whopping 973 visibility points. Wikipedia has not seen this level of visibility on Google.com since late 2019.
The most significant winner – and the one most talked about throughout 2023 – was Reddit, which saw an unprecedented spike in visibility beginning around the end of July. While the timing of the rapid growth does not closely align with a confirmed Google update, the SEO industry later learned from Google that the new “Hidden Gems” update likely launched around that same time.
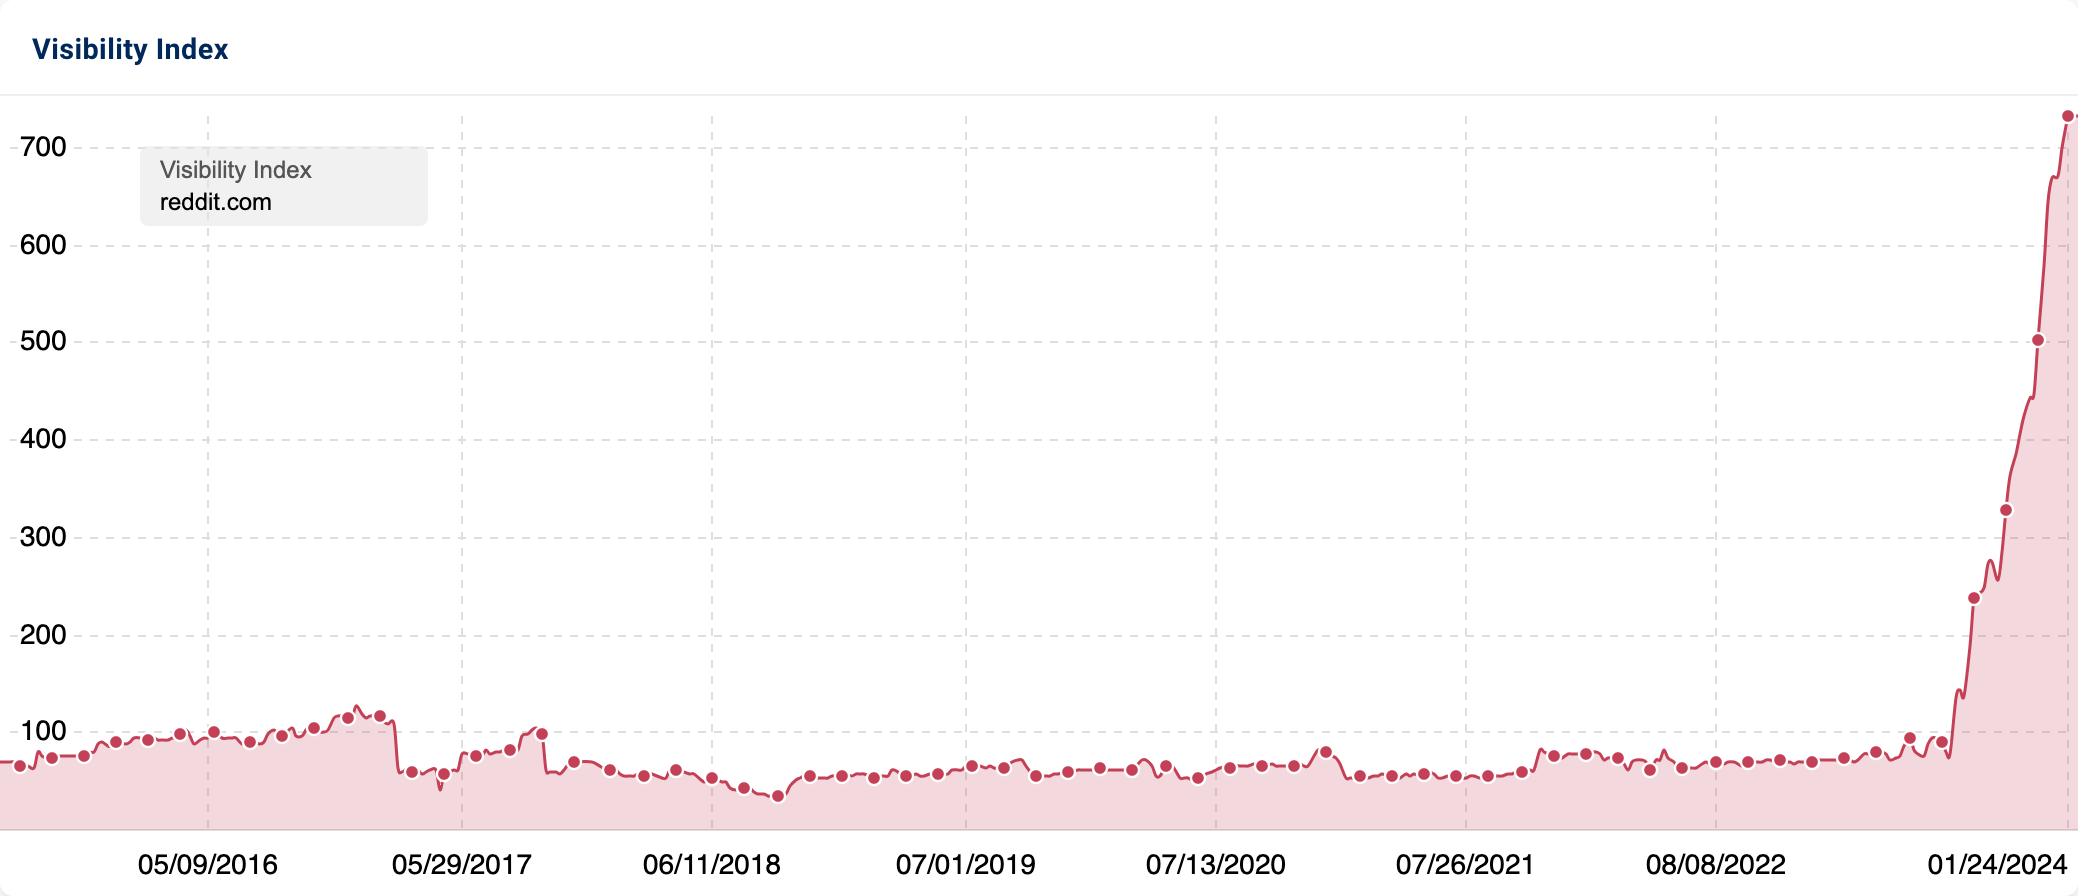
Hidden Gems – an adjustment to Google’s core ranking system – is aimed at surfacing hidden gems of information contained within social media posts, forums, and other places where users might share authentic experiences online.
While this effort was likely aimed at combating low-quality, homogenous, unhelpful and/or bland, AI-generated content, it seems to have resulted in such a significant swing in the other direction – including Reddit’s rapid growth – that many have since publicly complained about the results.
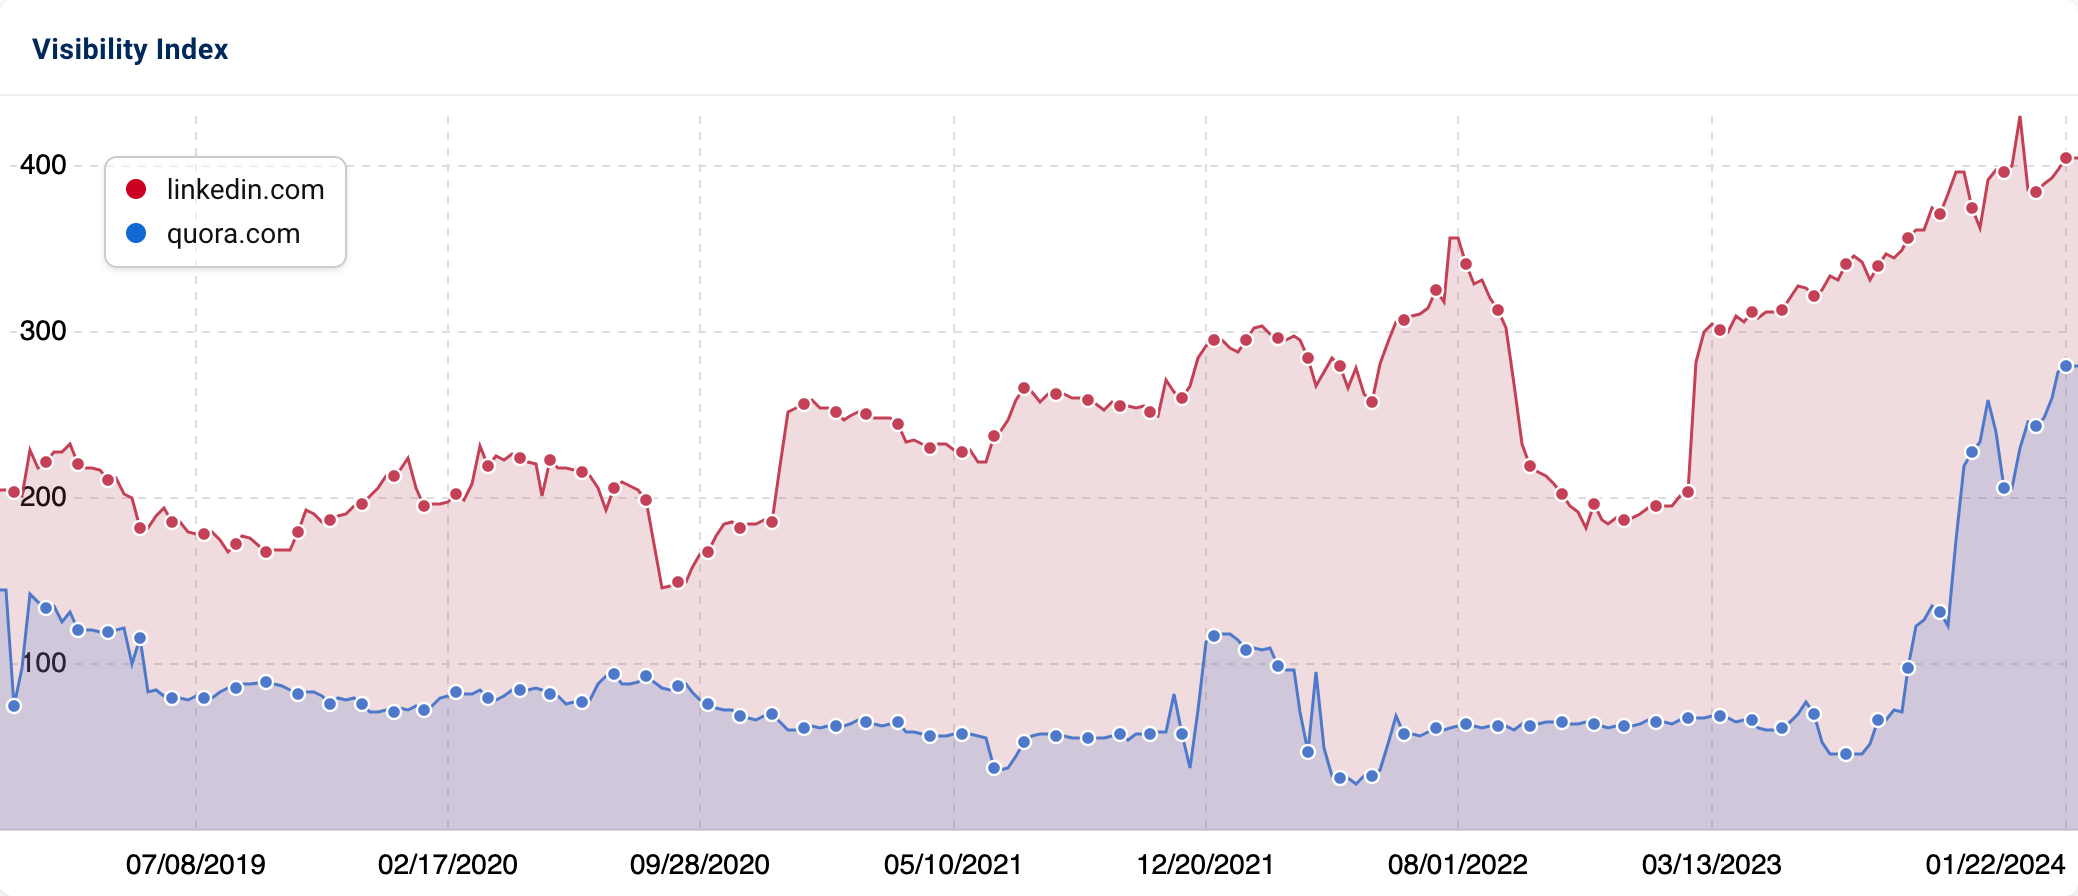
That said, Reddit was not the only UGC-driven content site that saw massive visibility increases toward the back half of 2023. Linkedin and Quora also made the top 10 list, with 201 and 185-point increases in visibility, respectively.
One might wonder what such an increase for a UGC website looks like from an individual ranking perspective.
For Quora.com, the answer is actually quite clear:
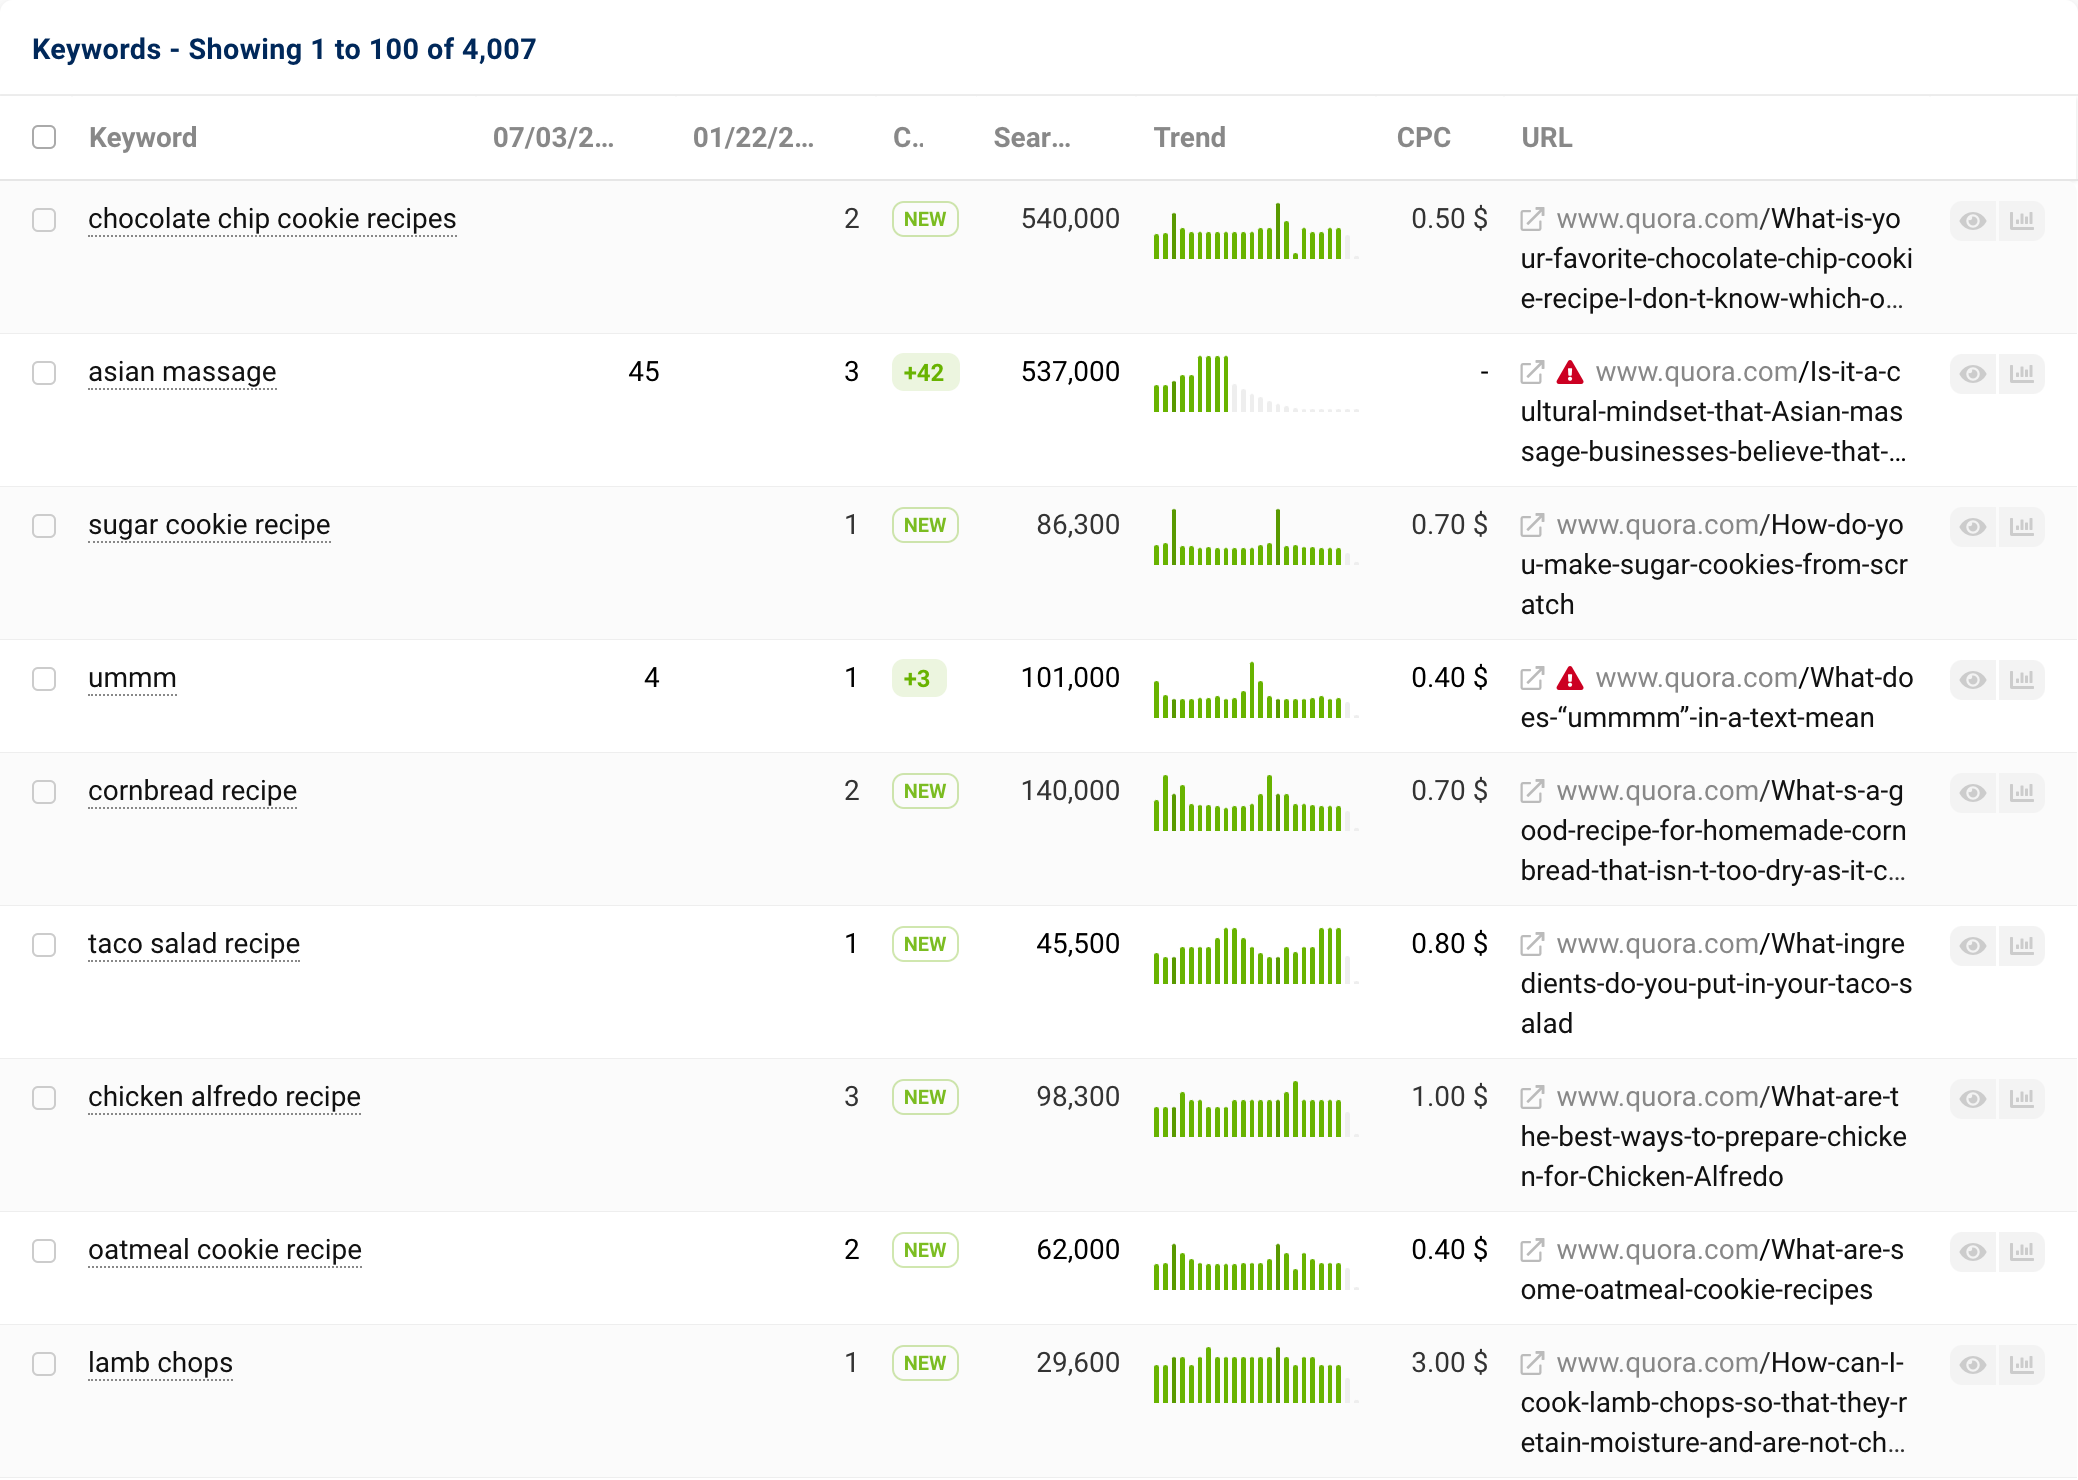
This ranking table shows keyword gains where Quora.com moved into the top positions on Google – positions 1-3 – between July 2023 and January 2024. These keywords each receive over 29,000 searches per month – and up to 540,000. Almost all of the keywords shown above relate to recipes and food.
The same exact pattern can be seen for Reddit.com, where filtering by the highest-volume keywords that moved into positions 1-3 during the same time period, almost all pertain to food and recipes.
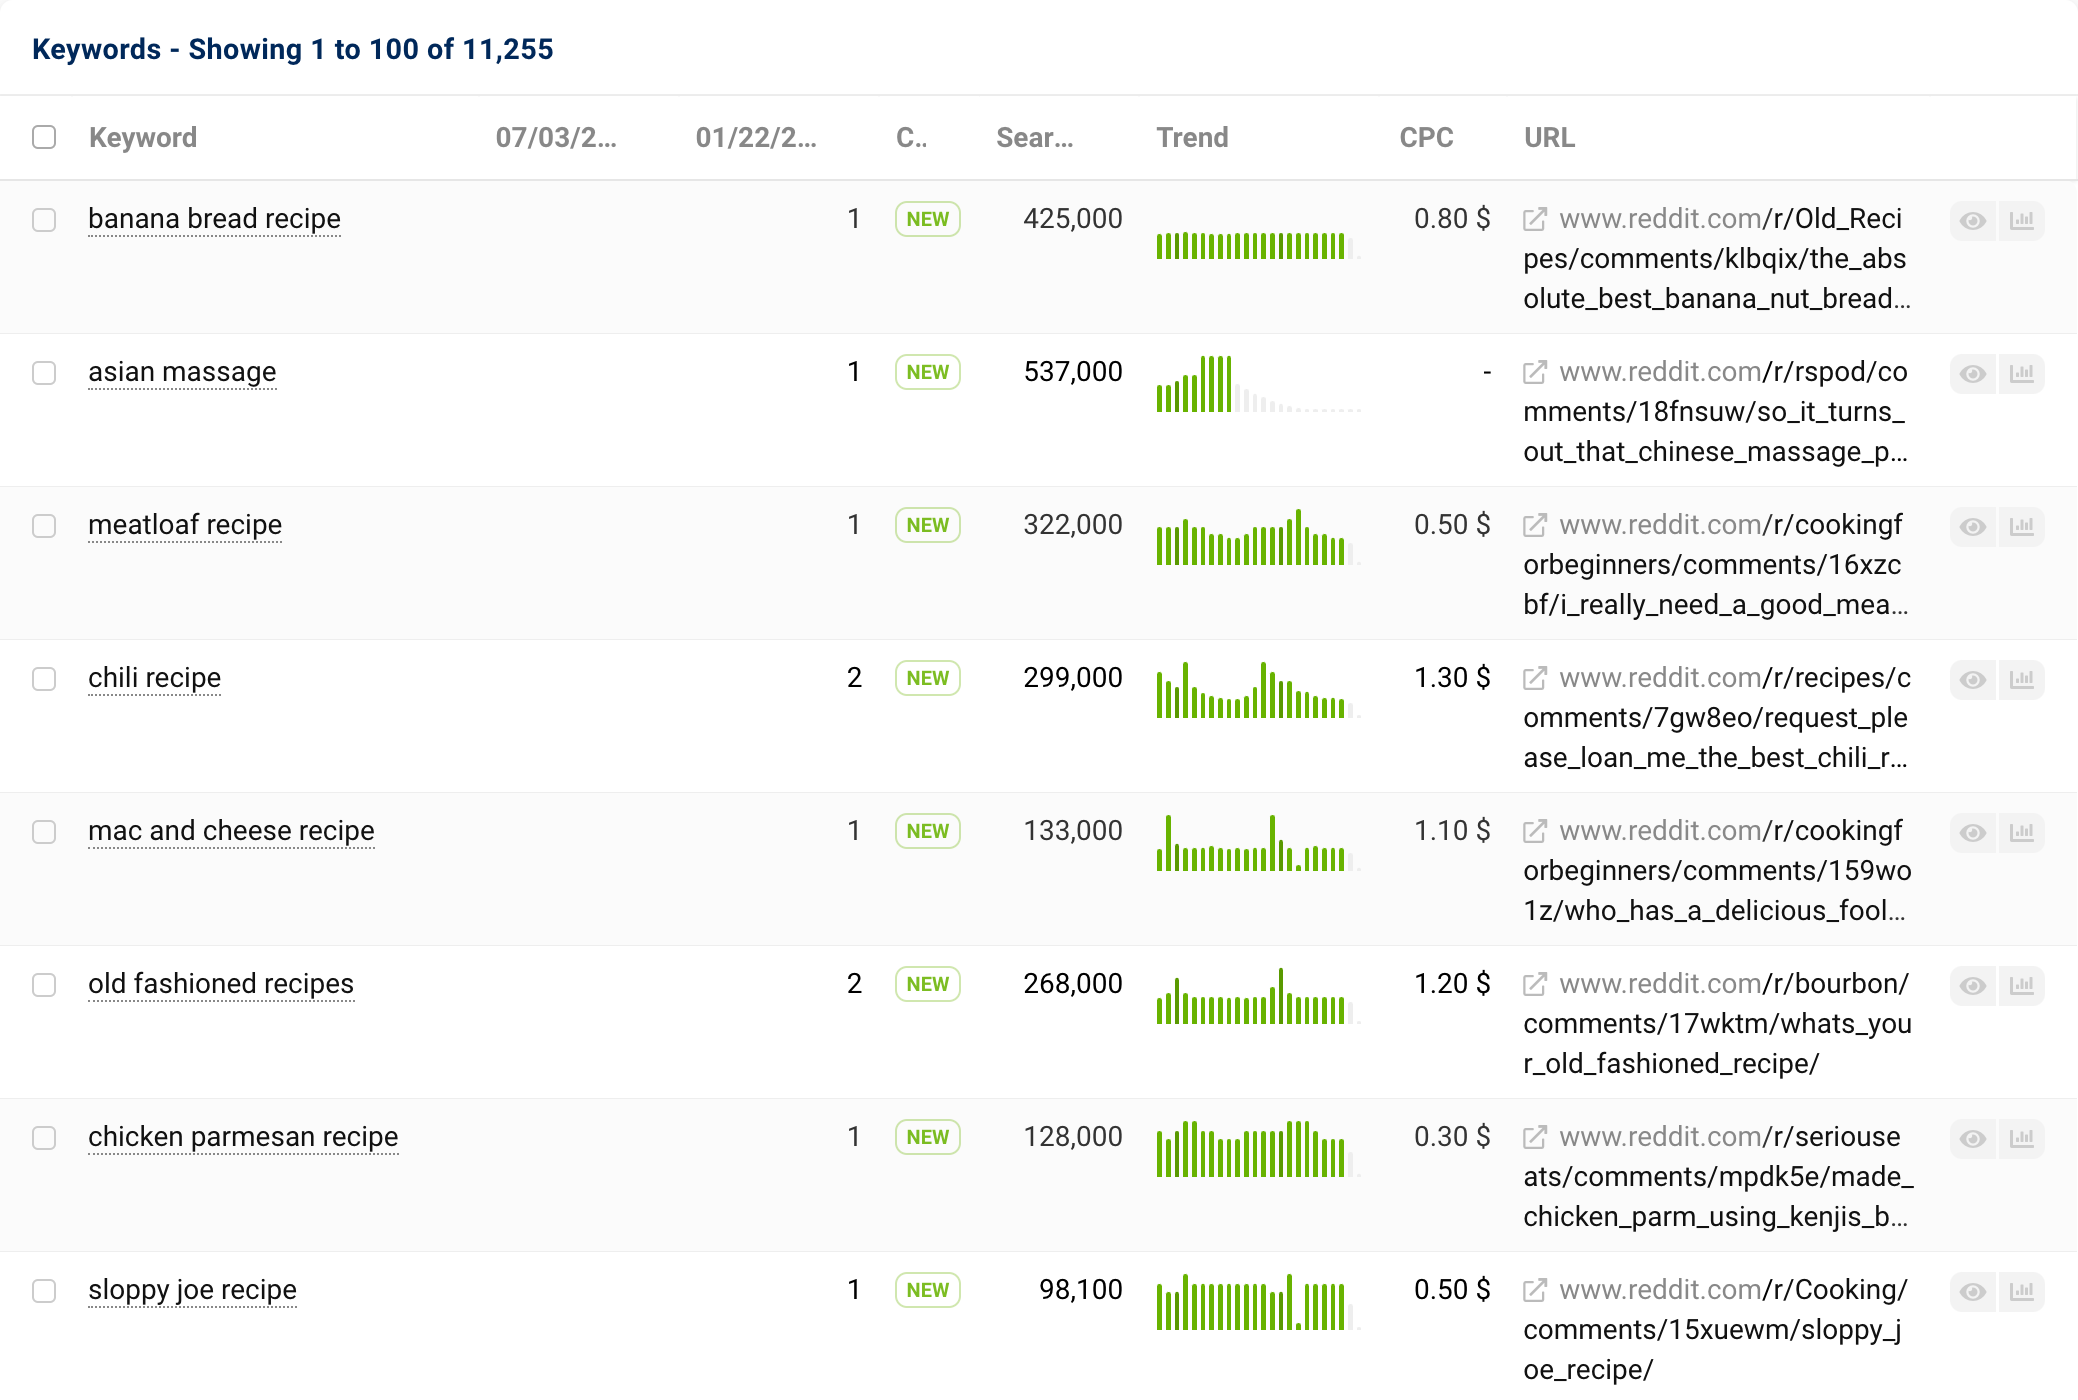
This is a big clue that Google’s Hidden Gems update heavily impacted the online recipe category of keywords. Google now shows more generic UGC sites like Quora and Reddit for top recipe queries (that were likely formerly held by recipe and food blogger websites). These keywords have enormous search volume, so being outranked by Reddit and Quora could significantly impact the amount of traffic and revenue flowing to various recipe sites from Google.
Biggest winners in terms of percentage visibility increases:
| # | Domain | 02 Jan 2023 | 01 Jan 2024 | Change Percent |
|---|---|---|---|---|
| 1 | cia.gov | 1.72 | 22.77 | 1223.89% |
| 2 | reddit.com | 69.04 | 667.79 | 867.18% |
| 3 | oed.com | 1.36 | 12.73 | 837.42% |
| 4 | yellowpages.com | 2.07 | 11.60 | 461.02% |
| 5 | factoryoutletstore.com | 2.17 | 12.17 | 460.12% |
| 6 | dialpad.com | 1.28 | 6.06 | 372.60% |
| 7 | truecaller.com | 1.12 | 5.16 | 360.53% |
| 8 | electronicexpress.com | 1.18 | 5.01 | 324.72% |
| 9 | cablestogo.com | 3.45 | 14.49 | 320.49% |
| 10 | datausa.io | 1.88 | 7.76 | 313.10% |
| 11 | nu.edu | 1.14 | 4.63 | 306.47% |
| 12 | food.com | 3.97 | 15.99 | 302.34% |
| 13 | osd.mil | 1.38 | 5.53 | 301.42% |
| 14 | avsforum.com | 1.30 | 5.19 | 298.63% |
| 15 | purina.co.uk | 2.14 | 8.44 | 294.62% |
| 16 | quora.com | 62.87 | 248.08 | 294.61% |
| 17 | sauder.com | 1.14 | 4.47 | 293.03% |
| 18 | advantech.com | 1.02 | 3.94 | 287.89% |
| 19 | bassettfurniture.com | 1.05 | 3.99 | 280.95% |
| 20 | vtechphones.com | 1.48 | 5.44 | 268.36% |
| 21 | skinnytaste.com | 1.43 | 5.25 | 266.84% |
| 22 | boomplay.com | 2.06 | 7.51 | 265.33% |
| 23 | targus.com | 2.01 | 7.08 | 252.36% |
| 24 | superuser.com | 7.52 | 26.37 | 250.80% |
| 25 | primevideo.com | 1.44 | 4.98 | 247.03% |
| 26 | mintmobile.com | 1.10 | 3.70 | 237.38% |
| 27 | proboards.com | 1.05 | 3.54 | 237.13% |
| 28 | helzberg.com | 1.16 | 3.91 | 236.60% |
| 29 | oxfordreference.com | 2.38 | 8.01 | 236.28% |
| 30 | lambsivy.com | 1.18 | 3.94 | 232.56% |
| 31 | calphalon.com | 2.60 | 8.56 | 229.69% |
| 32 | all-clad.com | 1.33 | 4.36 | 227.01% |
| 33 | kayoutlet.com | 1.08 | 3.37 | 212.85% |
| 34 | health.com | 5.44 | 16.98 | 212.25% |
| 35 | ludwig.guru | 2.64 | 8.20 | 211.01% |
| 36 | steamcommunity.com | 9.85 | 30.53 | 209.88% |
| 37 | walkoffame.com | 1.00 | 3.08 | 207.83% |
| 38 | jewishvirtuallibrary.org | 2.00 | 6.15 | 207.25% |
| 39 | ycombinator.com | 1.27 | 3.89 | 206.31% |
| 40 | semrush.com | 3.62 | 11.05 | 205.29% |
| 41 | cancer.ca | 1.02 | 3.10 | 205.27% |
| 42 | discountcomputerdepot.com | 1.10 | 3.34 | 204.49% |
| 43 | unitypoint.org | 1.08 | 3.28 | 202.14% |
| 44 | melissaanddoug.com | 1.95 | 5.85 | 199.75% |
| 45 | inkjets.com | 2.95 | 8.80 | 197.91% |
| 46 | luxuryhotel.world | 1.19 | 3.55 | 197.61% |
| 47 | hasbropulse.com | 1.40 | 4.16 | 196.99% |
| 48 | kidkraft.com | 1.38 | 4.06 | 194.95% |
| 49 | nrc.gov | 1.14 | 3.37 | 194.90% |
| 50 | lo4d.com | 1.78 | 5.14 | 188.76% |
| 51 | whitehousehistory.org | 1.28 | 3.65 | 185.79% |
| 52 | whirlpool.com | 1.64 | 4.67 | 185.27% |
| 53 | sigmaphoto.com | 2.36 | 6.70 | 184.14% |
| 54 | rawpixel.com | 1.36 | 3.86 | 183.24% |
| 55 | patagonia.com | 1.41 | 3.99 | 182.82% |
| 56 | avenue.com | 1.07 | 3.02 | 181.40% |
| 57 | healthdirect.gov.au | 6.80 | 18.98 | 179.00% |
| 58 | clickup.com | 1.60 | 4.45 | 178.81% |
| 59 | miniplay.com | 3.79 | 10.50 | 177.30% |
| 60 | teachmeanatomy.info | 1.42 | 3.91 | 174.80% |
| 61 | betterhealth.vic.gov.au | 17.08 | 46.28 | 170.95% |
| 62 | usphonebook.com | 2.69 | 7.23 | 168.66% |
| 63 | homedics.com | 1.42 | 3.80 | 168.02% |
| 64 | wordnik.com | 5.29 | 14.17 | 168.00% |
| 65 | visitcalifornia.com | 4.43 | 11.82 | 166.78% |
| 66 | calstate.edu | 1.52 | 4.03 | 164.51% |
| 67 | hellothinkster.com | 4.44 | 11.74 | 164.40% |
| 68 | twopeasandtheirpod.com | 1.35 | 3.56 | 163.53% |
| 69 | dirtdevil.com | 1.25 | 3.30 | 163.30% |
| 70 | kiddle.co | 1.39 | 3.65 | 162.50% |
| 71 | zalesoutlet.com | 1.35 | 3.53 | 162.17% |
| 72 | gbatemp.net | 1.31 | 3.38 | 158.71% |
| 73 | about.google | 1.26 | 3.24 | 158.01% |
| 74 | usaid.gov | 3.17 | 8.16 | 157.66% |
| 75 | askubuntu.com | 2.20 | 5.67 | 157.40% |
| 76 | auction.com | 1.08 | 2.78 | 156.83% |
| 77 | doordash.com | 2.62 | 6.71 | 155.90% |
| 78 | directauto.com | 1.31 | 3.33 | 154.65% |
| 79 | languagetool.org | 1.00 | 2.54 | 153.30% |
| 80 | kohler.com | 2.08 | 5.21 | 150.23% |
| 81 | texassports.com | 1.03 | 2.56 | 148.44% |
| 82 | pinchofyum.com | 1.63 | 4.02 | 147.02% |
| 83 | letras.com | 4.89 | 12.08 | 146.97% |
| 84 | damndelicious.net | 1.50 | 3.67 | 145.35% |
| 85 | swissgear.com | 1.06 | 2.61 | 145.33% |
| 86 | abcfws.com | 1.13 | 2.75 | 143.14% |
| 87 | smartsheet.com | 1.63 | 3.96 | 142.98% |
| 88 | ipqualityscore.com | 1.37 | 3.32 | 142.39% |
| 89 | americanstandard-us.com | 1.26 | 3.04 | 142.05% |
| 90 | njcourts.gov | 1.30 | 3.15 | 141.94% |
| 91 | nationalguard.com | 1.09 | 2.63 | 141.47% |
| 92 | wellplated.com | 2.76 | 6.65 | 141.16% |
| 93 | abc7chicago.com | 1.92 | 4.63 | 140.92% |
| 94 | tcm.com | 6.94 | 16.73 | 140.91% |
| 95 | numuki.com | 2.93 | 7.06 | 140.81% |
| 96 | fabricwholesaledirect.com | 1.16 | 2.80 | 140.62% |
| 97 | blackanddecker.com | 2.60 | 6.26 | 140.44% |
| 98 | tripod.com | 2.00 | 4.82 | 140.20% |
| 99 | crayola.com | 3.70 | 8.76 | 136.93% |
| 100 | bhf.org.uk | 1.96 | 4.64 | 136.85% |
In terms of greatest percentage increases in visibility, while Reddit unsurprisingly came in at #2, the actual #1 winner was the CIA: cia.gov. What does it look like when the U.S. government’s Central Intelligence Agency steals the top position for greatest percentage increase winner in 2023, when Reddit’s growth is off the charts?
Diving into the subdirectories across the CIA domain reveals an interesting trend: almost all of the SEO visibility, and particularly the growth seen in the past year, stem from the subdirectory called The World Factbook.
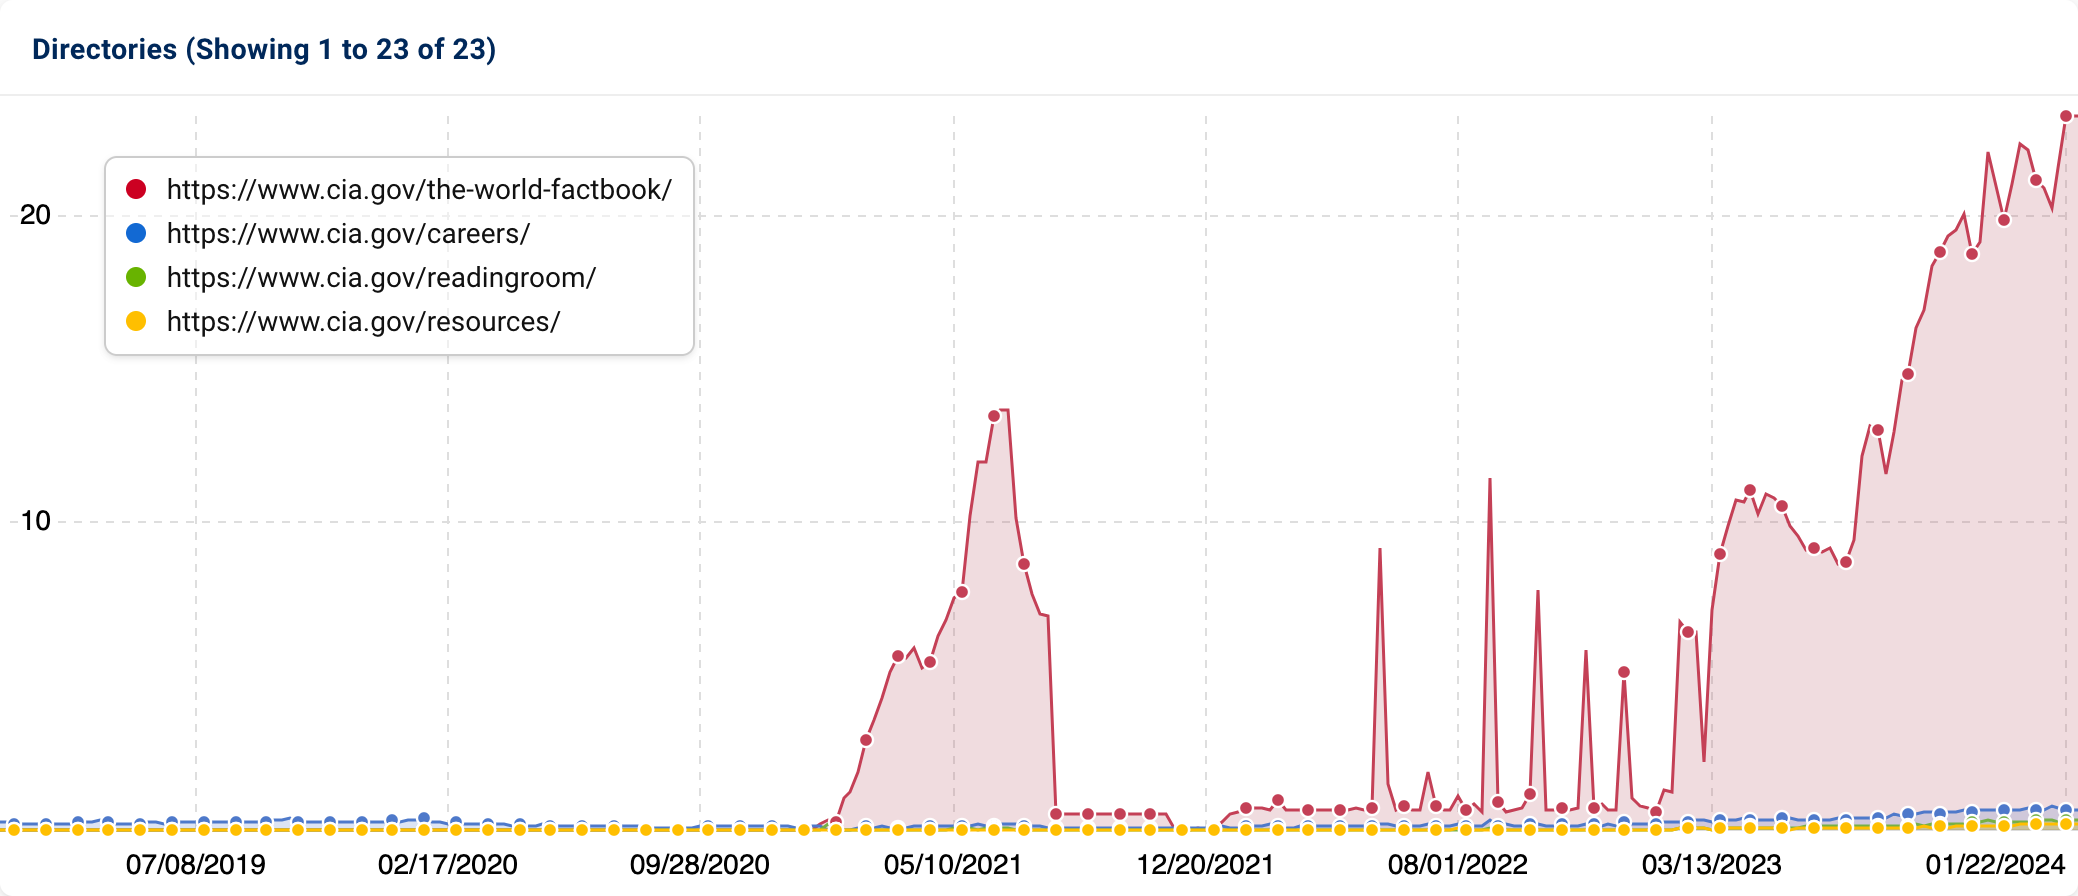
Drilling down into this particular subdirectory reveals how and why this site section has seen so much visibility growth:
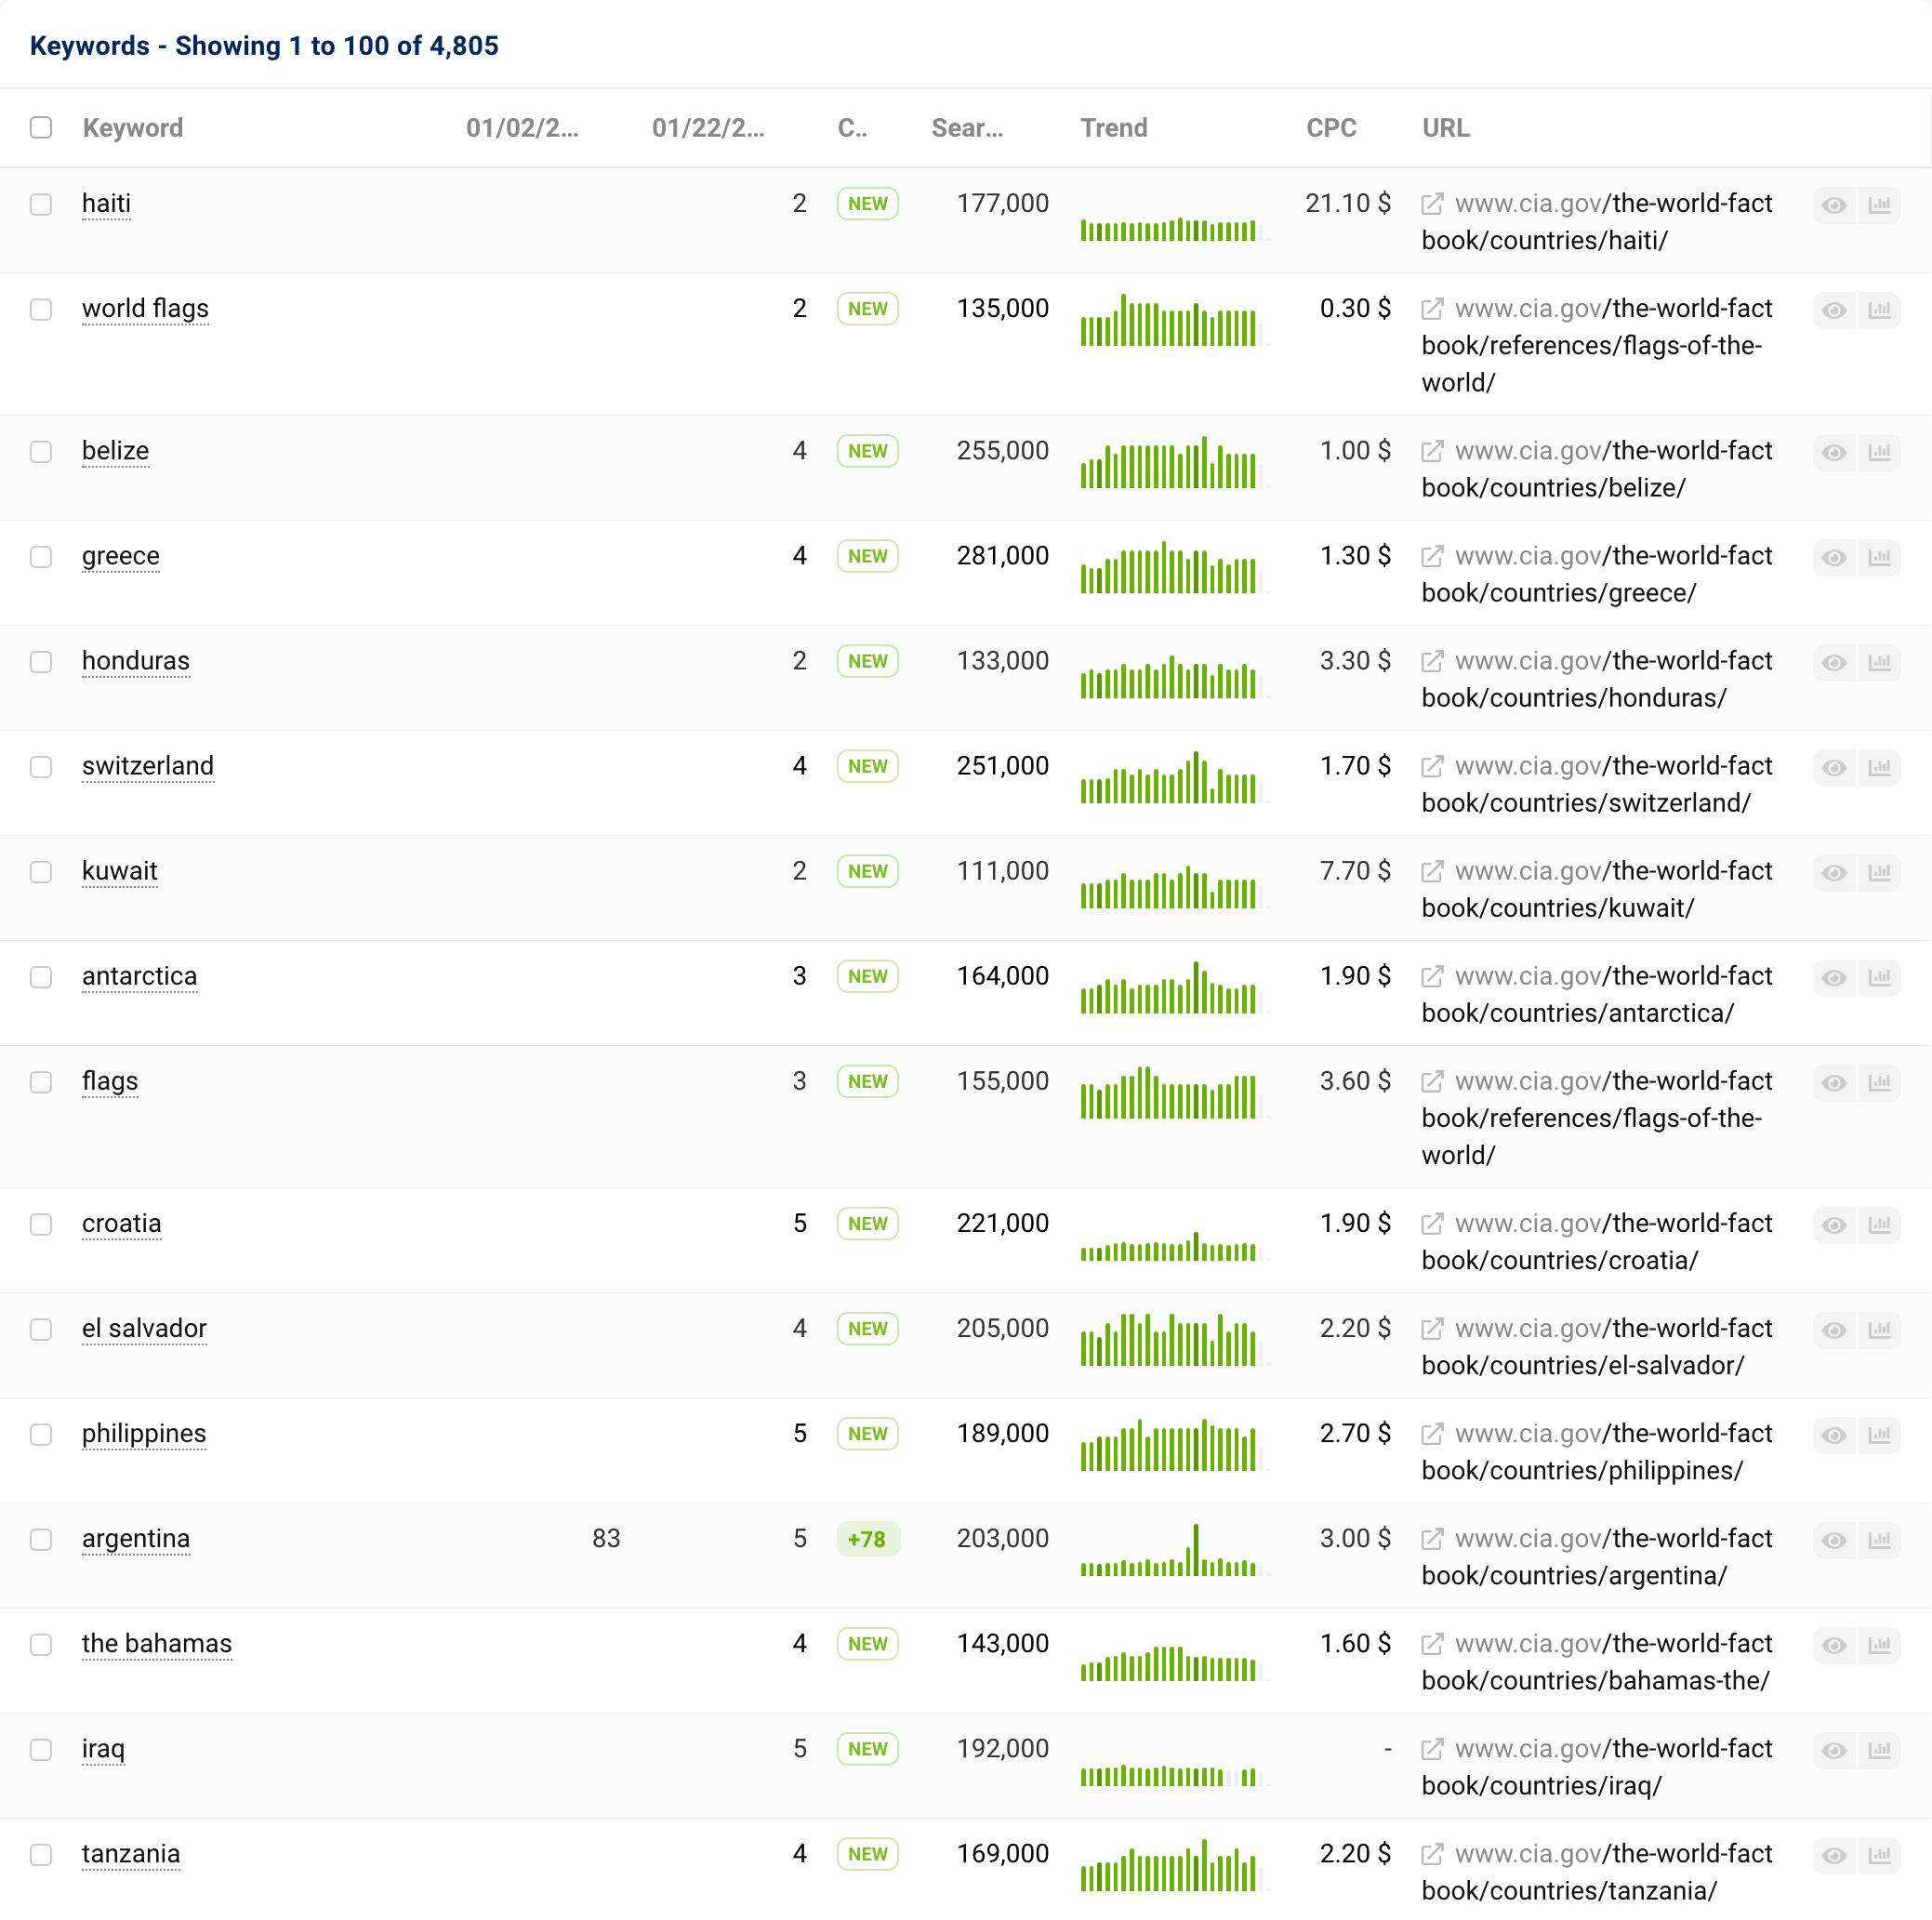
Nearly every keyword for which the cia.gov domain earned top positions (1-5) is the name of a country or a reference to world flags. These pages appear to have been indexed a couple of years before, and a quick Wayback Machine search does not show any major changes to the content that might have led to these pages quickly skyrocketing.
The change, however, coincides with the March 2023 Core Update, where various .gov domains saw a significant increase in visibility. Interestingly, in the UK, a similar trend took place, as several government (gov.uk) sites saw a big jump in visibility.
This type of behavior is common among government sites during core updates and is something I’ve covered in prior years of IndexWatch reporting.
Categories of Winners
The table below shows the categories of winning domains that saw the greatest increases, by percent, in SEO visibility in 2023. Some categories were removed due to low sample numbers.
| Category | Average % increase |
|---|---|
| Social Media, User Generated Content & Forums | 228.77% |
| Consumer Goods & Retail | 108.62% |
| Language Tools | 95.12% |
| Appliances | 93.72% |
| Law & Government | 89.50% |
| Technology & Computing | 88.17% |
| Authority Health Site | 86.45% |
| Lyrics & Music | 85.67% |
| Business & Finance | 85.19% |
| Baby & Kids Clothing | 85.04% |
| Hobbies & Collectibles | 84.86% |
| Gaming Blogs & Forums | 84.32% |
| Insurance | 78.97% |
| Entertainment & Social Media | 78.41% |
| Health & Nutrition | 77.89% |
| Home & Furniture | 77.88% |
| Information & Research | 77.01% |
| Education & Learning | 76.94% |
| Career & Job Search | 73.84% |
| Advocacy and Nonprofit | 72.89% |
The average increase among the 1000 winning-domain data-set was 88%. As always in IndexWatch, the data-set only includes established domains with Vi of over 1.0 at the start of the sample period.
Unsurprisingly, the category called “Social Media, User Generated Content & Forums” was by far the biggest category winner in 2023.
UGC & Social Media
The unprecedented Google organic visibility growth of the category below labeled as “Social Media, User Generated Content & Forums” was evident to the larger marketing community throughout the year, even without any formal reporting on the actual data.
But the data supports the story clearly: Not only did these domains increase by a large percent, the domains already had very large visibility.
| Domain | Increase |
|---|---|
| reddit.com | 867.18% |
| quora.com | 294.61% |
| superuser.com | 250.80% |
| tiktok.com | 120.05% |
| linkedin.com | 107.50% |
| medium.com | 85.39% |
| stackexchange.com | 57.04% |
| instagram.com | 47.56% |
Within this category, Reddit led with total visibility change, but other sites also experienced massive increases. Linkedin and Quora saw many of those gains stem from actual content contributed by users, as opposed to just a growing number of new indexed profiles, or stronger rankings from existing user profiles.
Law & Government
In the “Law & Government” category, many official state, federal and local government sites saw big increases, particularly the California and USA official sites, followed by the CIA.
| Domain | Increase percent |
|---|---|
| cia.gov | 1223.89% |
| osd.mil | 301.42% |
| nrc.gov | 194.90% |
| usaid.gov | 157.66% |
| njcourts.gov | 141.94% |
| nationalguard.com | 141.47% |
| militaryonesource.mil | 128.46% |
| gpo.gov | 122.94% |
| doc.gov | 117.55% |
| govloans.gov | 115.92% |
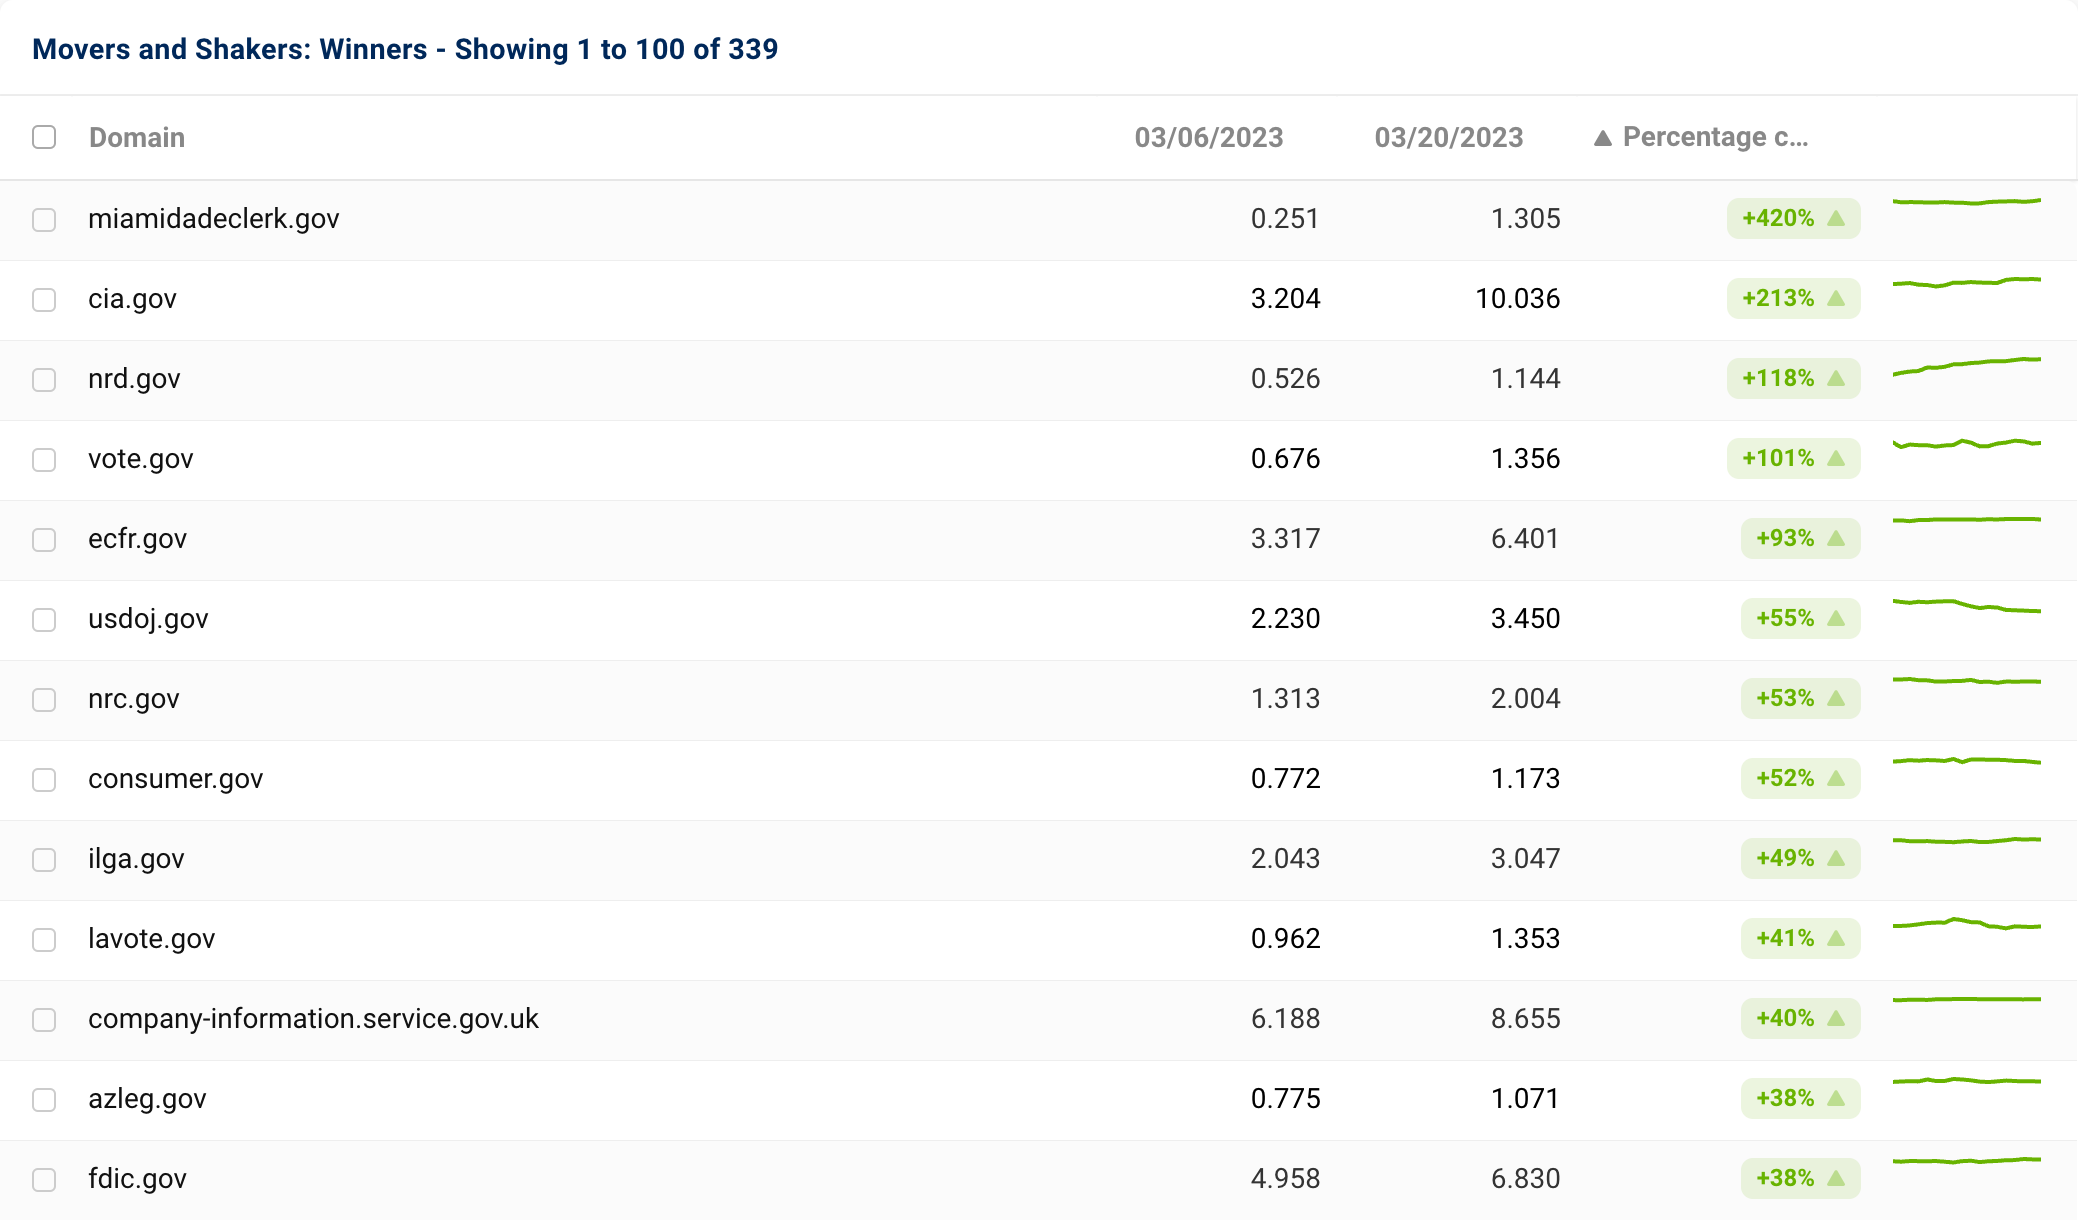
It’s always intriguing when seemingly unrelated sites move as a group during core updates.
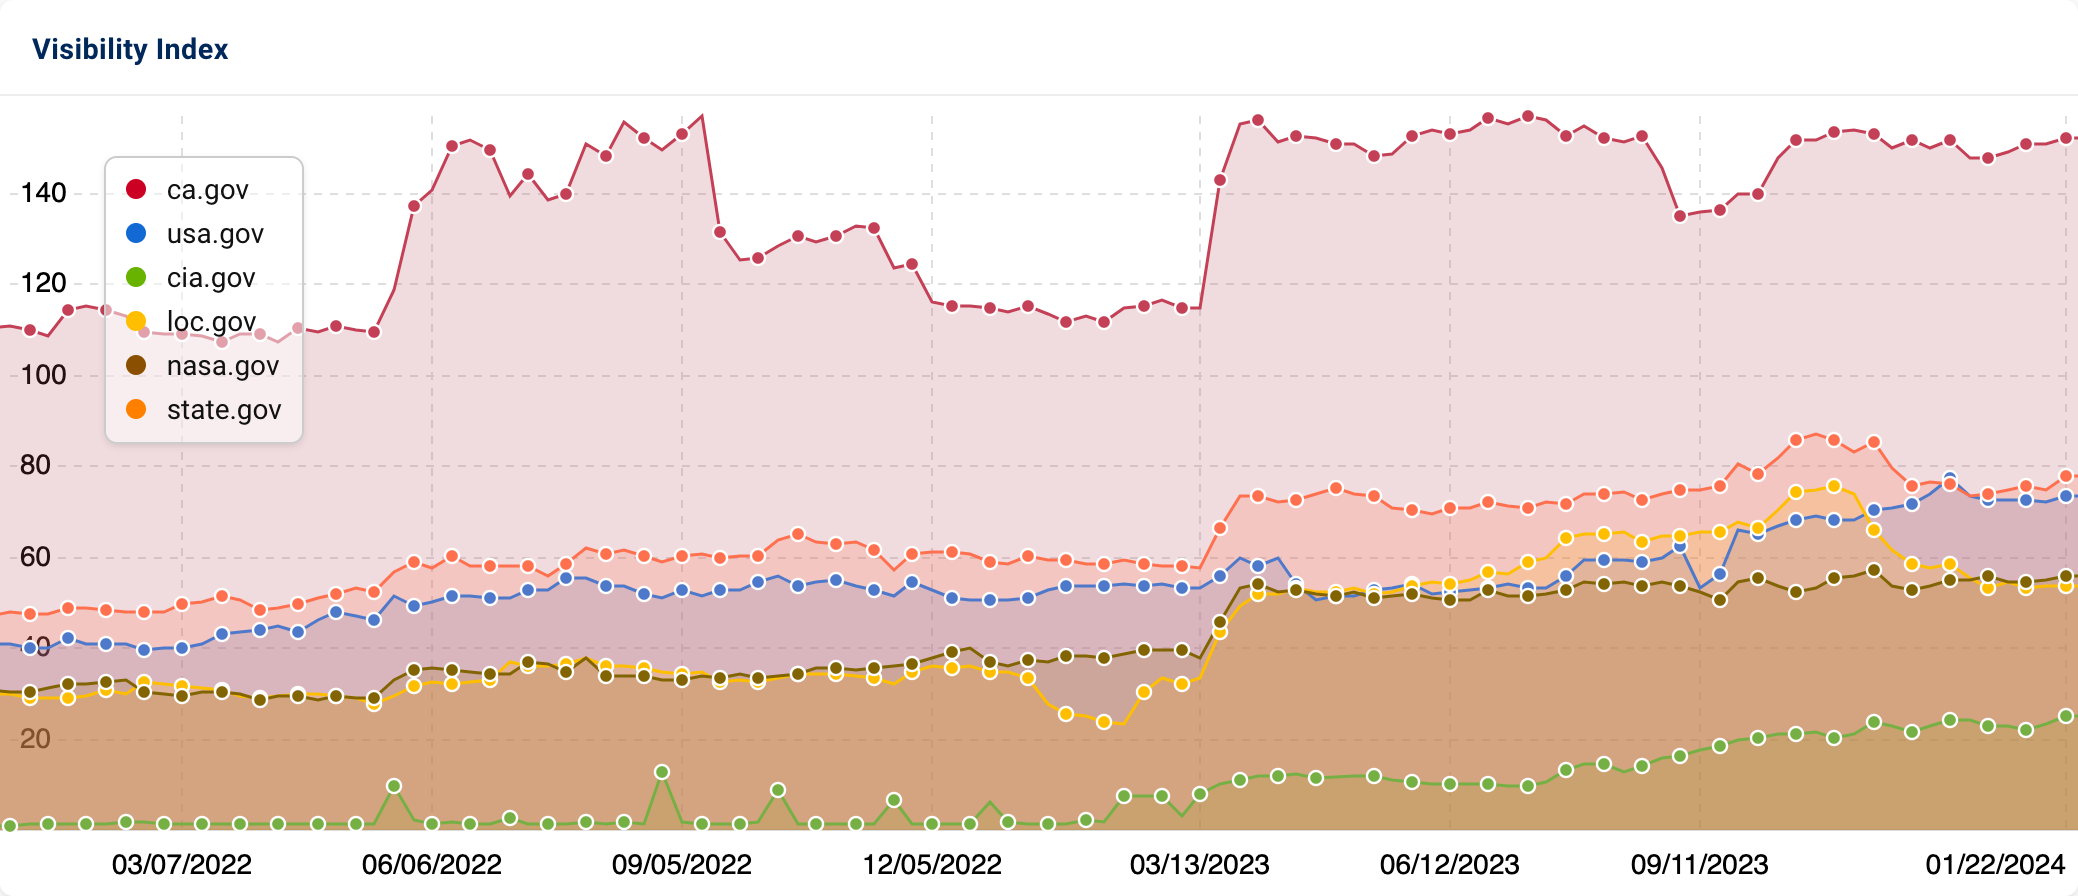
For example, in the above chart, the March 2023 Core Update led to the rapid growth of 6 different .gov domains, which maintained and gained more visibility throughout the year.
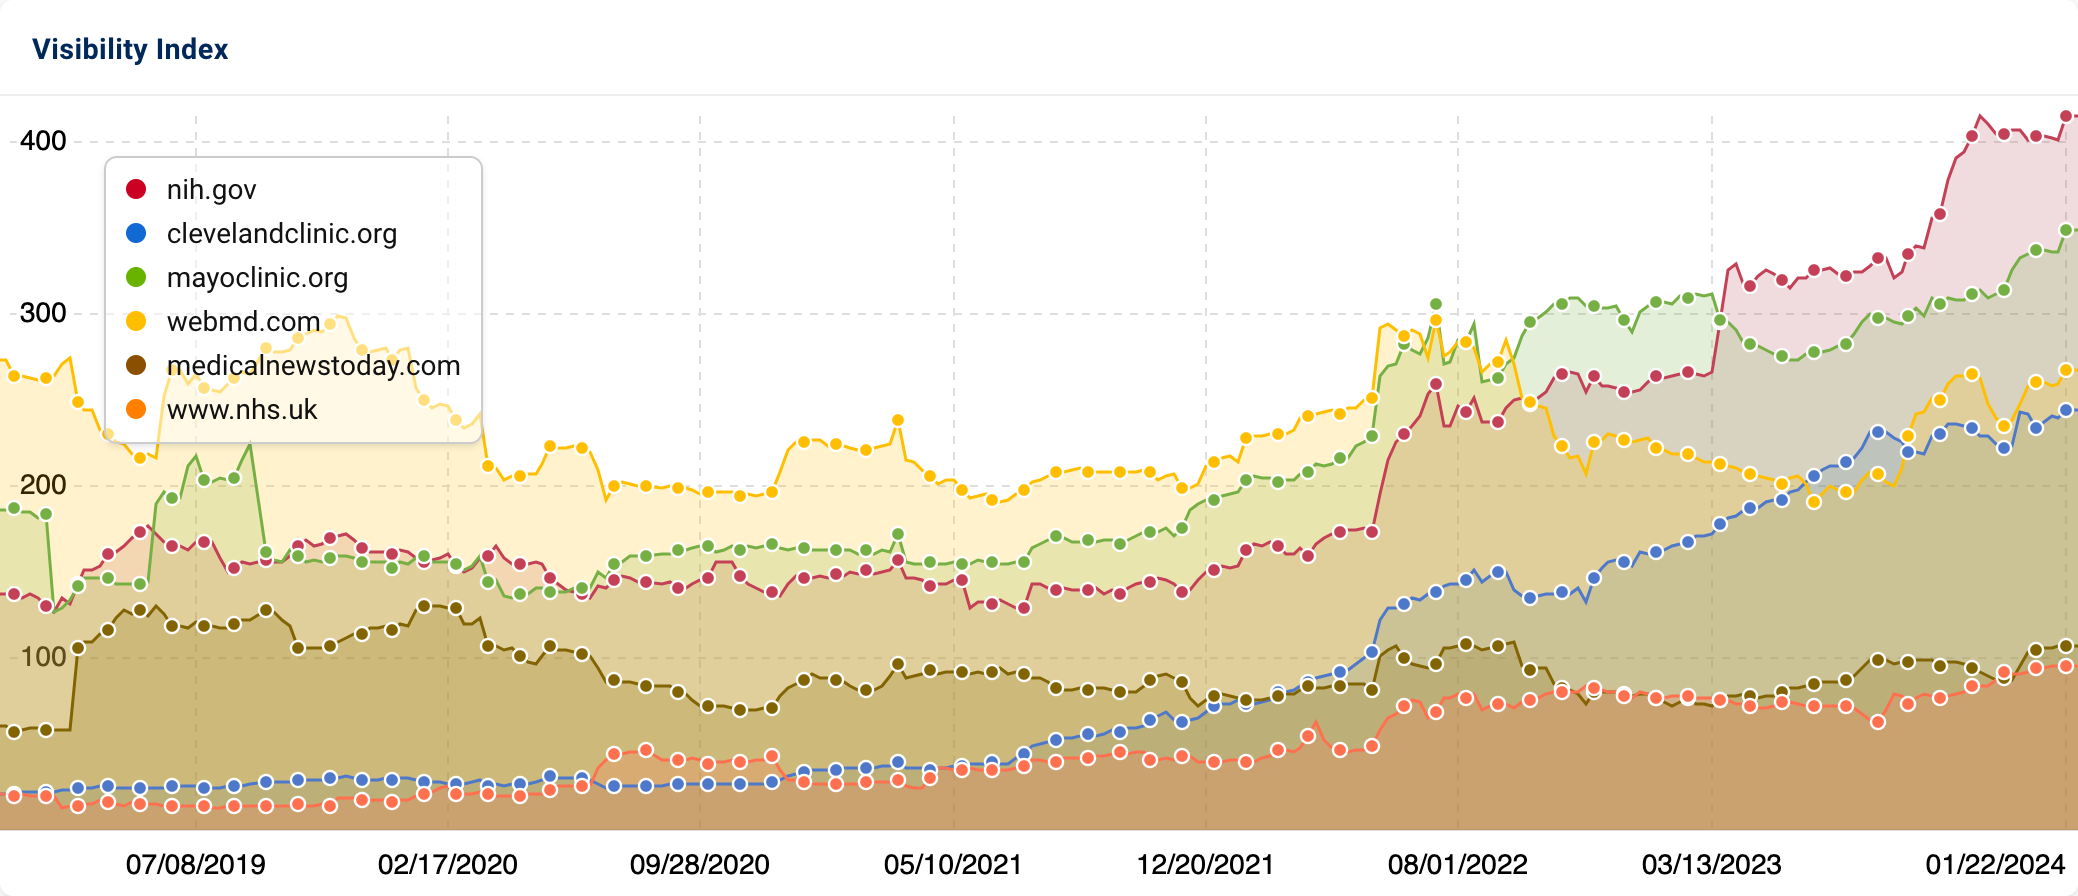
Health & Nutrition
Another category group that experienced significant wins is quite similar in nature to the domains in the above ‘Law & Government’ group.
The highly authoritative National Institute of Health (nih.gov), the Cleveland Clinic, the Mayo Clinic, WebMD, and Medical News today were among the top 5 greatest percentage winners in this group, as shown below:
| Domain | Increase percent |
|---|---|
| health.com | 212.25% |
| unitypoint.org | 202.14% |
| healthdirect.gov.au | 179.00% |
| betterhealth.vic.gov.au | 170.95% |
| childrenshospital.org | 133.42% |
| medline.com | 116.96% |
| ahd.com | 110.47% |
| facts.net | 107.33% |
| medicinenet.com | 106.09% |
| gymshark.com | 95.75% |
Interestingly, this group even contained authoritative health institutions from other countries, such as Australia and the UK.
This trend should not come as a surprise to many in the SEO industry, where such authoritative health publishers, institutions and organizations have seen consistent, enormous visibility growth in recent years:
Travel
Large absolute gains in the travel category are a bit misleading as the growth growth was largely driven by the top ~20 domains in the group.
| Domain | VI increase |
|---|---|
| tripadvisor.com | 125.4977 |
| hotels.com | 51.1878 |
| expedia.com | 28.0346 |
| visittheusa.com | 17.9611 |
| lonelyplanet.com | 15.7135 |
| kayak.com | 11.9861 |
| trivago.com | 9.8734 |
| ricksteves.com | 7.4625 |
| visitcalifornia.com | 7.3866 |
| cntraveler.com | 6.9913 |
| costcotravel.com | 6.8245 |
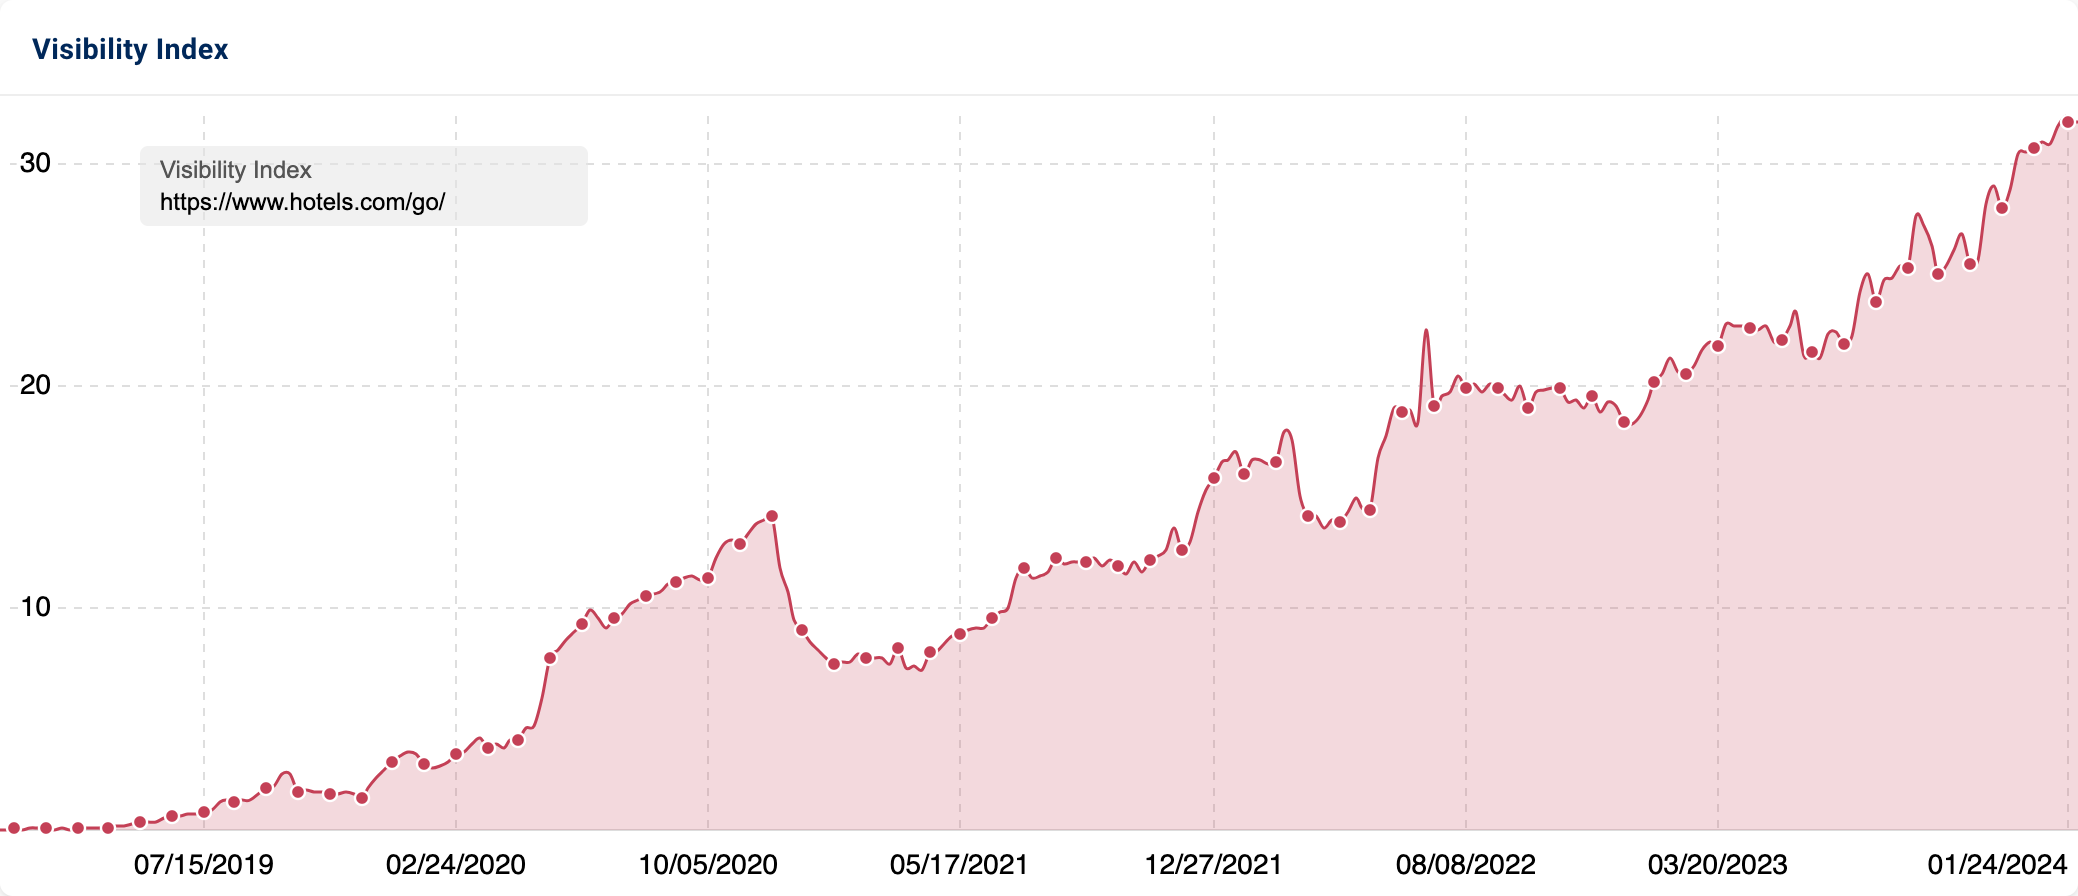
In absolute gains, Tripadvisor saw an enormous increase of 125.5 visibility points. Hotels.com came in at 2nd place in the group, but its absolute visibility increase was around one-third that of Tripadvisor (51.19 points). Expedia.com also came in as a strong winner, growing by 28 points.
One huge driver of new SEO visibility for hotels.com is its /go/ subdirectory, which experienced exceptional growth throughout 2023 (as well as in prior years).
The travel category also saw significant increases, largely driven from huge losses among many travel bloggers and niche travel sites during the September Helpful Content Update. This will be covered in the upcoming article about the biggest losers in 2023.
Reference & Dictionary Sites
Many dictionary websites saw significant growth, but the vast majority of the growth in this category came from one site: merriam-webster.com, which saw a whopping 250 point increase.
Merriam Webster, which saw the 4th highest absolute gain in visibility among all sites, derived half of that growth (~150 points) from its /thesaurus/ subfolder:
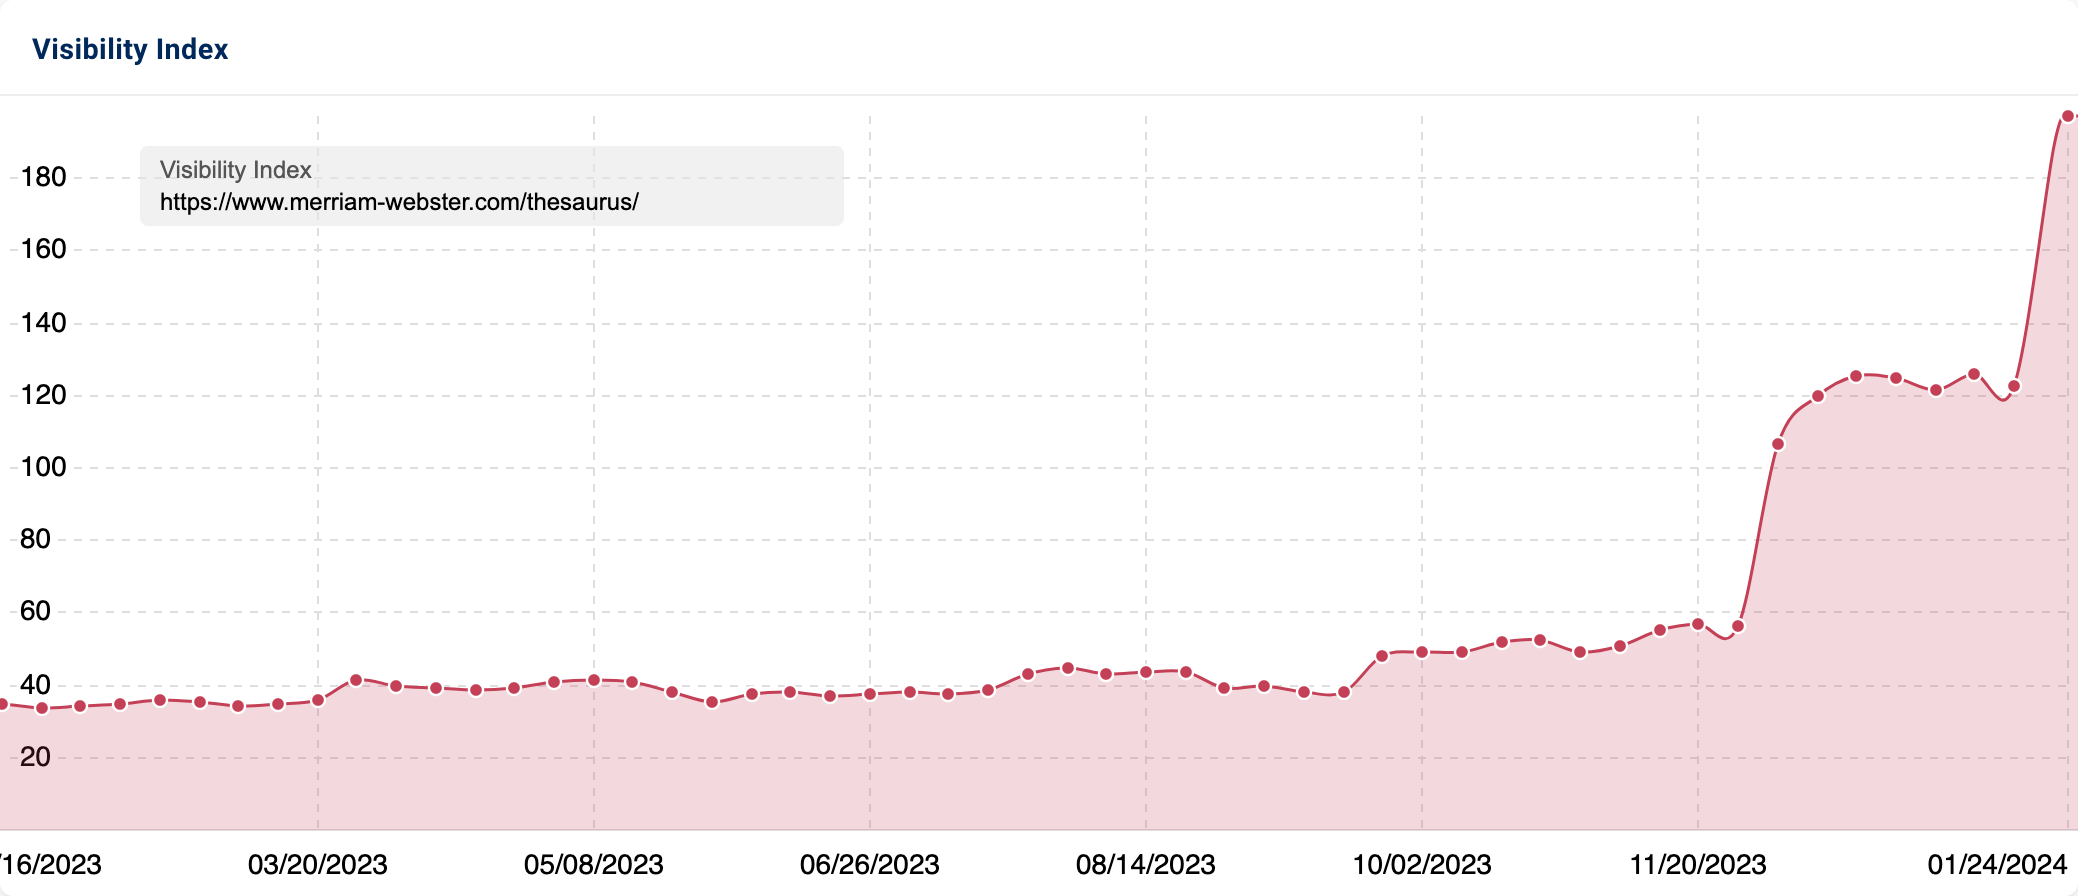
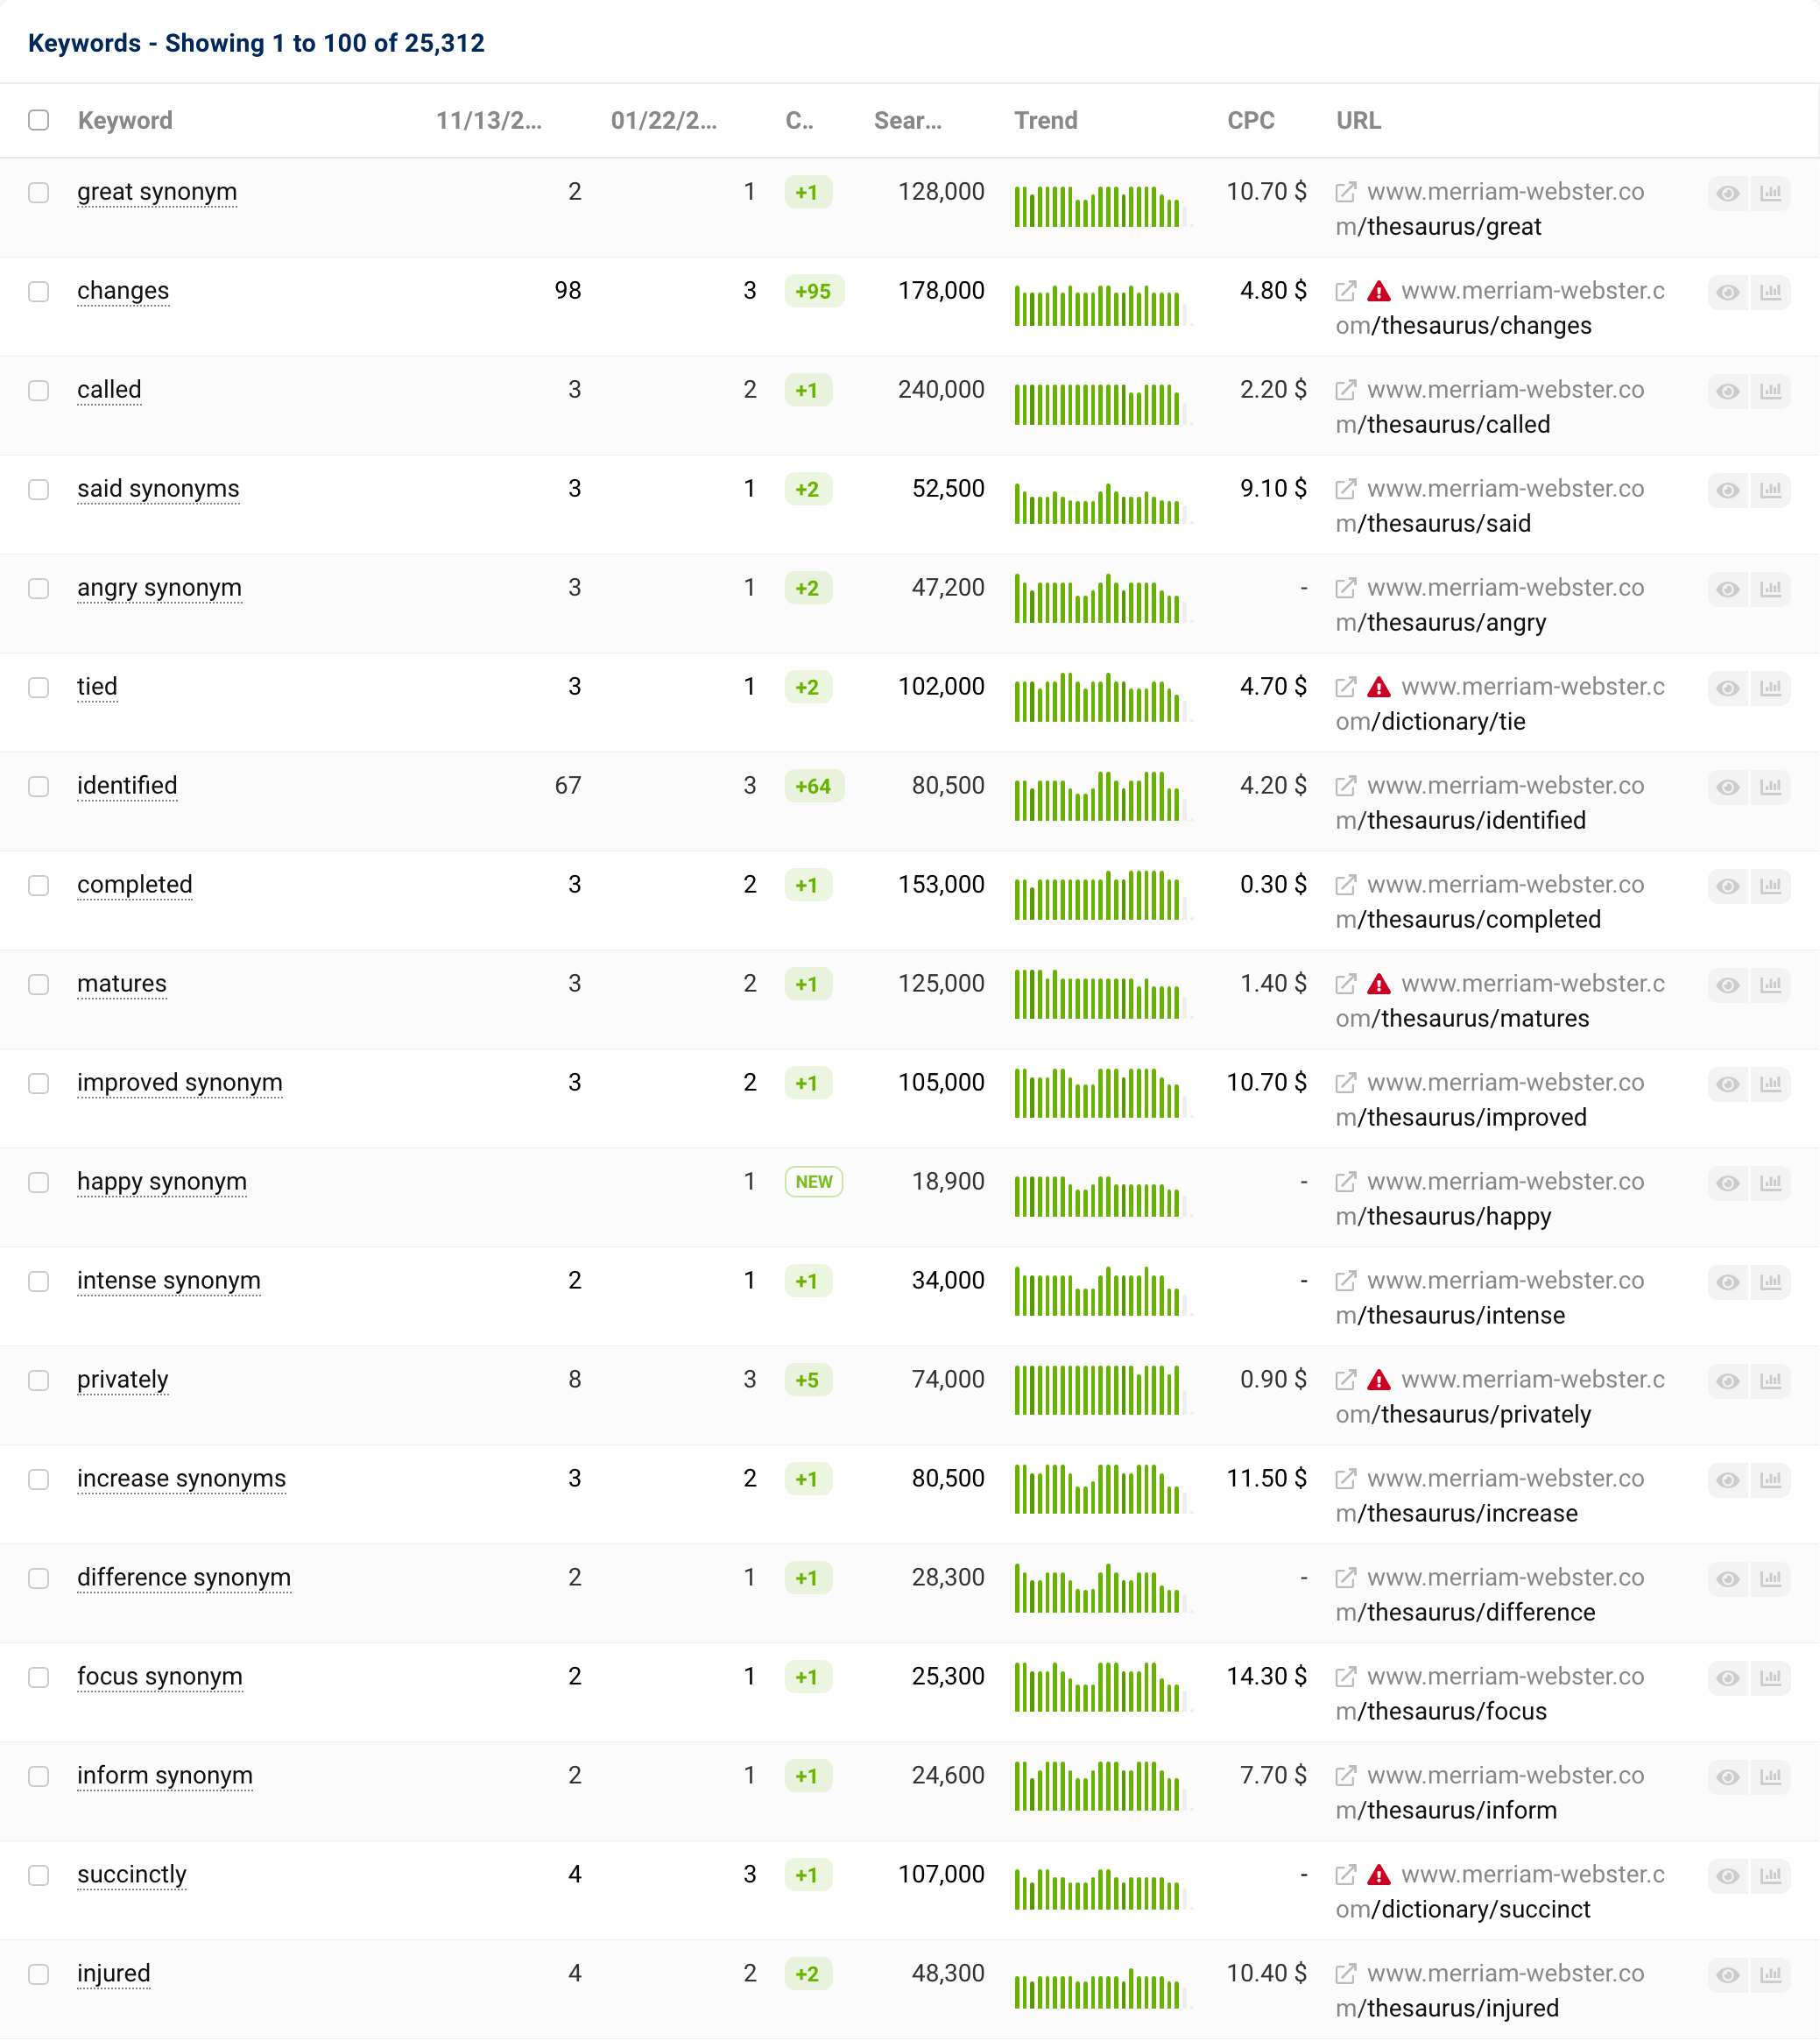
It would be hard to know specifically how or why this change took place – or whether or not it was due to external factors – without understanding what went on with the inner workings of the company.
Other dictionary and reference websites that experienced significant growth include: collinsdictionary.com (+9.23 points), wordnik.com (+8.88 points) and wordreference.com (+8.65).
Takeaways
Just like many have stated throughout the year, Google indeed rewarded many social media, forum, and user generated content (UGC) sites, with Reddit, Quora, Linkedin, and similar sites seeing massive gains with user-generated content. However, another important outcome was the substantial growth of highly authoritative government and health institutions, a trend that has remained consistent over the past few years.
List of domain categorisations generated via ChatGPT
First, ChatGPT was able to generate broad categories for the nearly 2,500 unique domains in the data-set, but it led to some redundant and repetitive category names (such as singular and plural versions).
Once the broad categories were generated, I then used ChatGPT to cluster similar terms into logical “parent” categories, which, with some tweaking, led to the following 55 category groups.
| Categories | |
|---|---|
| Adult Content | Information & Research |
| Advocacy and Nonprofit | Insurance |
| Appliances | International Organization |
| Art & Culture | Jewelry & Accessories |
| Automotive | Language Tools |
| Baby & Kids Clothing | Law & Government |
| Beauty & Fragrances | Lyrics & Music |
| Books & Literature | Marketing |
| Business & Finance | Museum |
| Career & Job Search | Music & Entertainment |
| Classifieds | News & Media |
| Consumer Electronics | Personal Care |
| Consumer Goods & Retail | Personal Development |
| Dating | Pest Control |
| E-commerce | Pets & Animals |
| Education & Learning | Product Reviews |
| Employment | Real Estate |
| Entertainment & Social Media | Religion & Spirituality |
| Environment | Science & Education |
| Family & Parenting | Social Media, User Generated Content & Forums |
| Fashion & Apparel | Sports & Outdoor Equipment |
| Food & Delivery | Sports Teams & Sports Publishers |
| Games & Puzzles | Streaming |
| Gaming Blogs & Forums | Technology & Computing |
| Graphics, Images & Stock Photos | Toys & Games |
| Health & Nutrition | Transportation |
| Hobbies & Collectibles | Travel Directories & Blogs |
| Home & Furniture |
Global IndexWatch 2023 reports
- IndexWatch UK Winners
- IndexWatch UK Losers
- IndexWatch DE Winners
- IndexWatch DE Losers
- IndexWatch ES Winners
- IndexWatch ES Losers
- IndexWatch IT Winners
- IndexWatch IT Losers
- IndexWatch FR Winners
- IndexWatch FR Losers
You can assess live data from all domains and grow your visibility with the Free SISTRIX Trial.