The SISTRIX Visibility Index is often mistaken for an SEO-traffic index. As a result, we see blogposts pop up on a regular basis which either show how well or how badly the Visibility Index development correlates with the actual SEO traffic. Most of these articles are based on a fundamental misunderstanding. The SISTRIX Visibility Index is no SEO-traffic index and does not want to be one, either. I would like to show you exactly why this is the case in this article, using a simple example.
What is the Visibility Index supposed to measure?
The SISTRIX Visibility Index was created to condense all of a domain’s ranking changes within the organic search results on Google into one key indicator. With the Visibility Index it is possible to quickly and easily measure ranking changes in total. When you have a case of extreme changes or when a trend is broken, you can immediately see the date where you should start your detailed analysis of what caused this situation.
You can also compare the values and history for a domain with competitors, which enables you to gain valuable information for a competition analysis.
You will find a detailed explanation on how we calculate the SISTRIX Visibility Index, and why you cannot compare the development with the visibility curves of other tools, in our Ask SISTRIX article “What is the SISTRIX Visibility Index?“.
Example “weather” – Comparison of the Visibility Index and the SEO-traffic index
I intentionally kept this example as simple as possible, in order to demonstrate how discrepancies between the Visibility Index development and SEO-traffic can occur and why this deviation is intentional. For this example, we will use the keyword “weather”.
The following graph shows the Google Trends history for the search interest for “weather” in the UK.
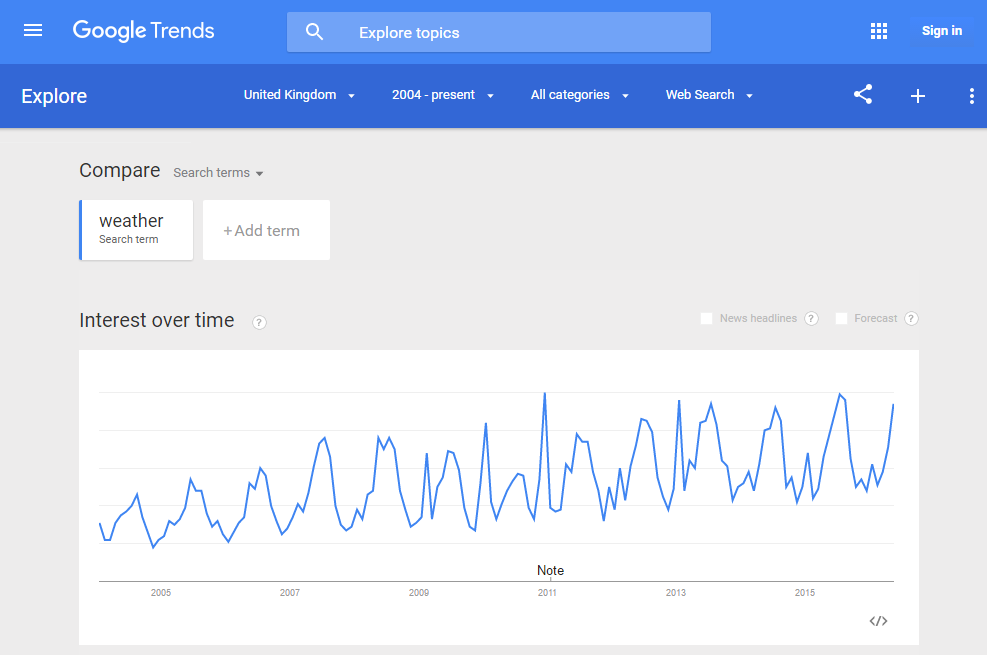
Google Trends does not supply any data on the absolute search volumes, but will use a proportional search volume to calculate their index value. To keep the example as simple as possible, I wanted to use data that is publicly available. Because of this, we will use the Google Trends data as search volume and look at the time frame April 2012 until March 2013. You can find these values in the table below.
Next, we will have a look at the fictional website A, as our example case. Website A starts a successful SEO strategy in September 2012. The rankings for “weather” increase on Google and hence the assumed Click-Through-Rate (CTR) in the search results will also go up. Over the next few months, the rankings continue to rise and, in January 2013, the rankings have reached a record high. Website A manages to successfully defend these rankings in the following months.
We can now also add the assumed CTR values into our table. If we wanted to use the available data to calculate the SEO-traffic index of website A for the keyword “weather”, we would multiply the individual monthly values from Google Trends (column A) with the assumed CTR (column C) and thereby get the results in column D.
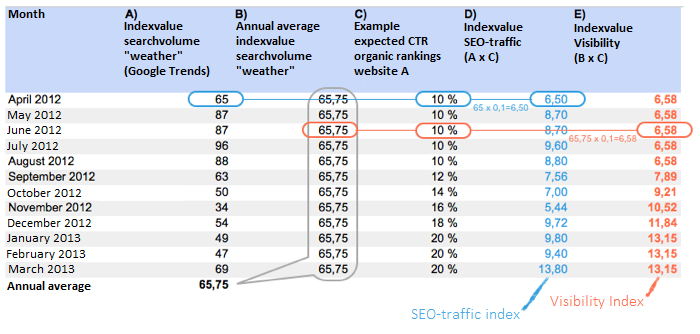
When we want to calculate a visibility index, we should clean up the large fluctuations within the search volume, in order to show the undistorted ranking changes as an indicator value. For this, we simply calculate a yearly average for the search volume. In our example, we get the value 65.75 – which we will use as the search volume for every month (in column B). This enables us to present the ranking changes as an isolated index value, assuming all other variables stay the same (ceteris paribus).
In this example, we could have done without the search volume entirely and only used the assumed CTR for the Visibility Index. Seeing how the Visibility Index is usually calculated on the basis of many keywords, we need a search volume value in order to attach a weight to the different keywords, so we know how strong they are in comparison to each other.
The following graph will show you the differences between the calculations for the SEO-traffic index and the Visibility Index. The SEO-traffic index will likely be much closer to the actual SEO-traffic, while the Visiblity Index will show the ranking changes much more precisely.
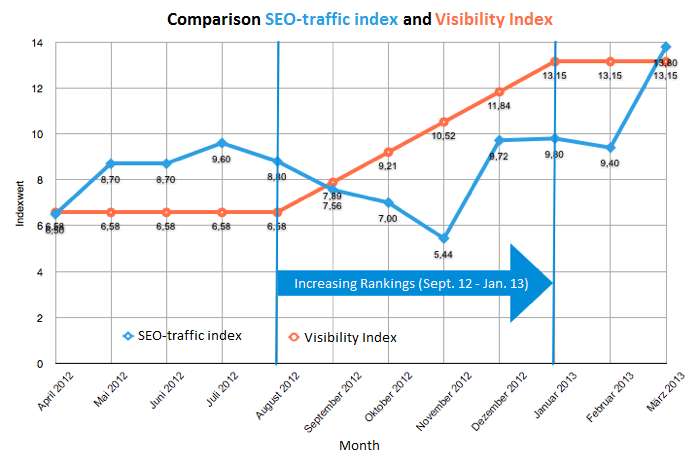
Depending on what you want to do, both index values have a raison d’être. If you want to specifically control the ranking changes, then the SEO-traffic index is unfit to help you achieve your goal. In our example we saw a decrease in SEO-traffic until November 2012, even though the rankings were rising since September 2012. The traffic suddenly jumps in March 2013, while the rankings did not change anymore. The SEO-traffic index does not yield any reliable signals for your SEO-controlling, because it mixes the effects of a temporary search volume with the rankings. There is a high risk of arriving at the wrong conclusions from the data and making ill-advised decisions.
The SISTRIX Visibility Index, on the other hand, was designed exactly for controlling of your search engine optimization strategy and gives you precisely accurate, strong signals, at exactly the right moment.