
Ask ChatGPT the same question today and tomorrow, and you will often get two different answers. Sometimes your brand is mentioned, sometimes it isn’t. So can AI visibility be measured at all?
It can be measured reliably, just not in the way many tools and guides suggest. We analysed 10,826 daily measurement series from SISTRIX data, across four AI models and eight countries. The result is clear: if you want reliable figures, you shouldn’t query the same prompt over and over, but as many different prompts as possible.
Here is an example from our Prompt Tracking. Every day, we ask ChatGPT: ‘Which robot vacuum is currently the best?’ Over four weeks, Roborock and Dreame are mentioned almost every day. Ecovacs appears on 12 of 28 days, Mova on 11 and Xiaomi on 3, with no discernible pattern. Checking on any single day therefore tells you practically nothing about these three brands.
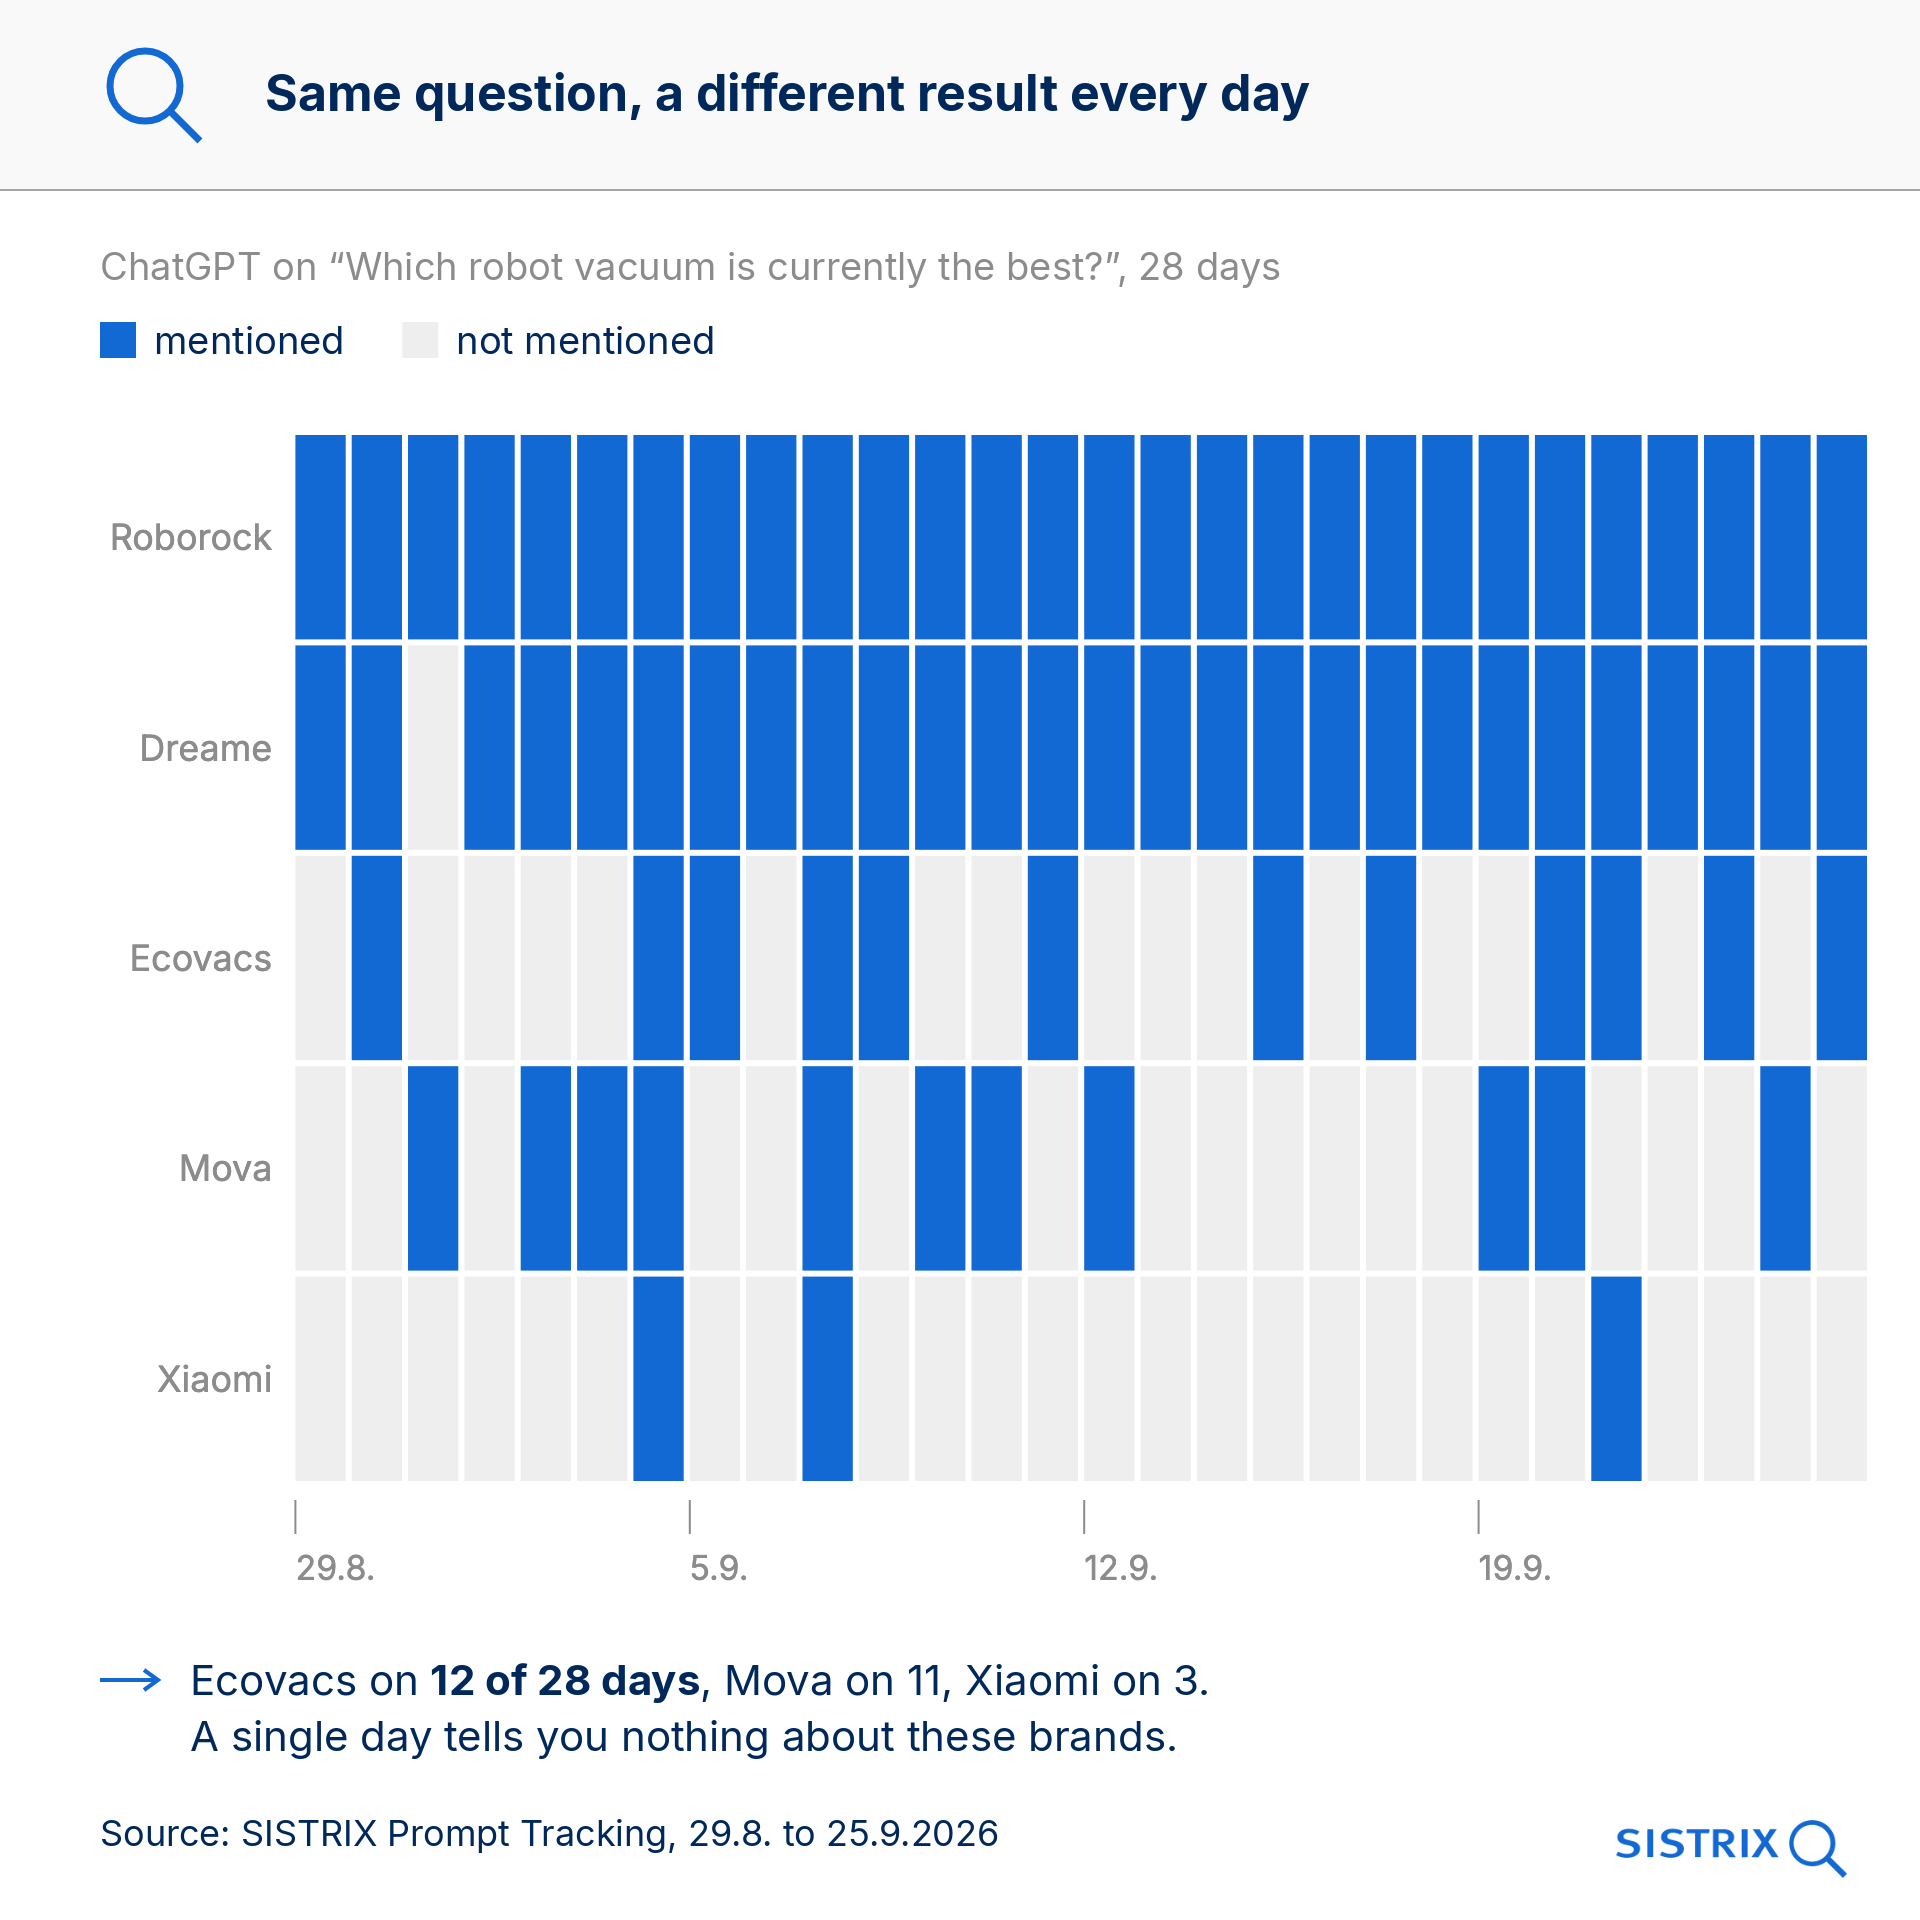
Individual AI answers really are random
Mike King of iPullRank recently published an article well worth reading, titled ‘There Is No “Accuracy” in AI Search Tracking – Only Precision’, showing how much AI answers vary from run to run. He draws on an experiment by Mike Sonders with 12 prompts and 100 runs each in ChatGPT: 72 per cent of brands appeared in fewer than one in five answers.
Our data confirms this on a much broader basis. Of all the brands that appear in a prompt’s answers, 70 per cent show up on fewer than one in five days. Only 6 per cent appear on at least four out of five days. This applies equally to ChatGPT, AI Overviews, AI Mode and Perplexity.
A single answer, then, tells you very little. The question is how to turn many uncertain answers into one reliable figure.
The key question: repeat or broaden?
Suppose you have a budget of 20 queries. You can query one prompt for 20 days, 20 different prompts once each, or anything in between. Which split gives the most accurate answer to the question ‘In how many answers does my brand appear?’
The answer from 10,826 measurement series is clear. Suppose a brand actually appears in 25 per cent of answers. If you query one prompt on 20 days, your measurement could land anywhere between 0 and 59 per cent. With 20 different prompts on a single day, it falls between 16 and 35 per cent, and with 100 prompts between 21 and 29 per cent.
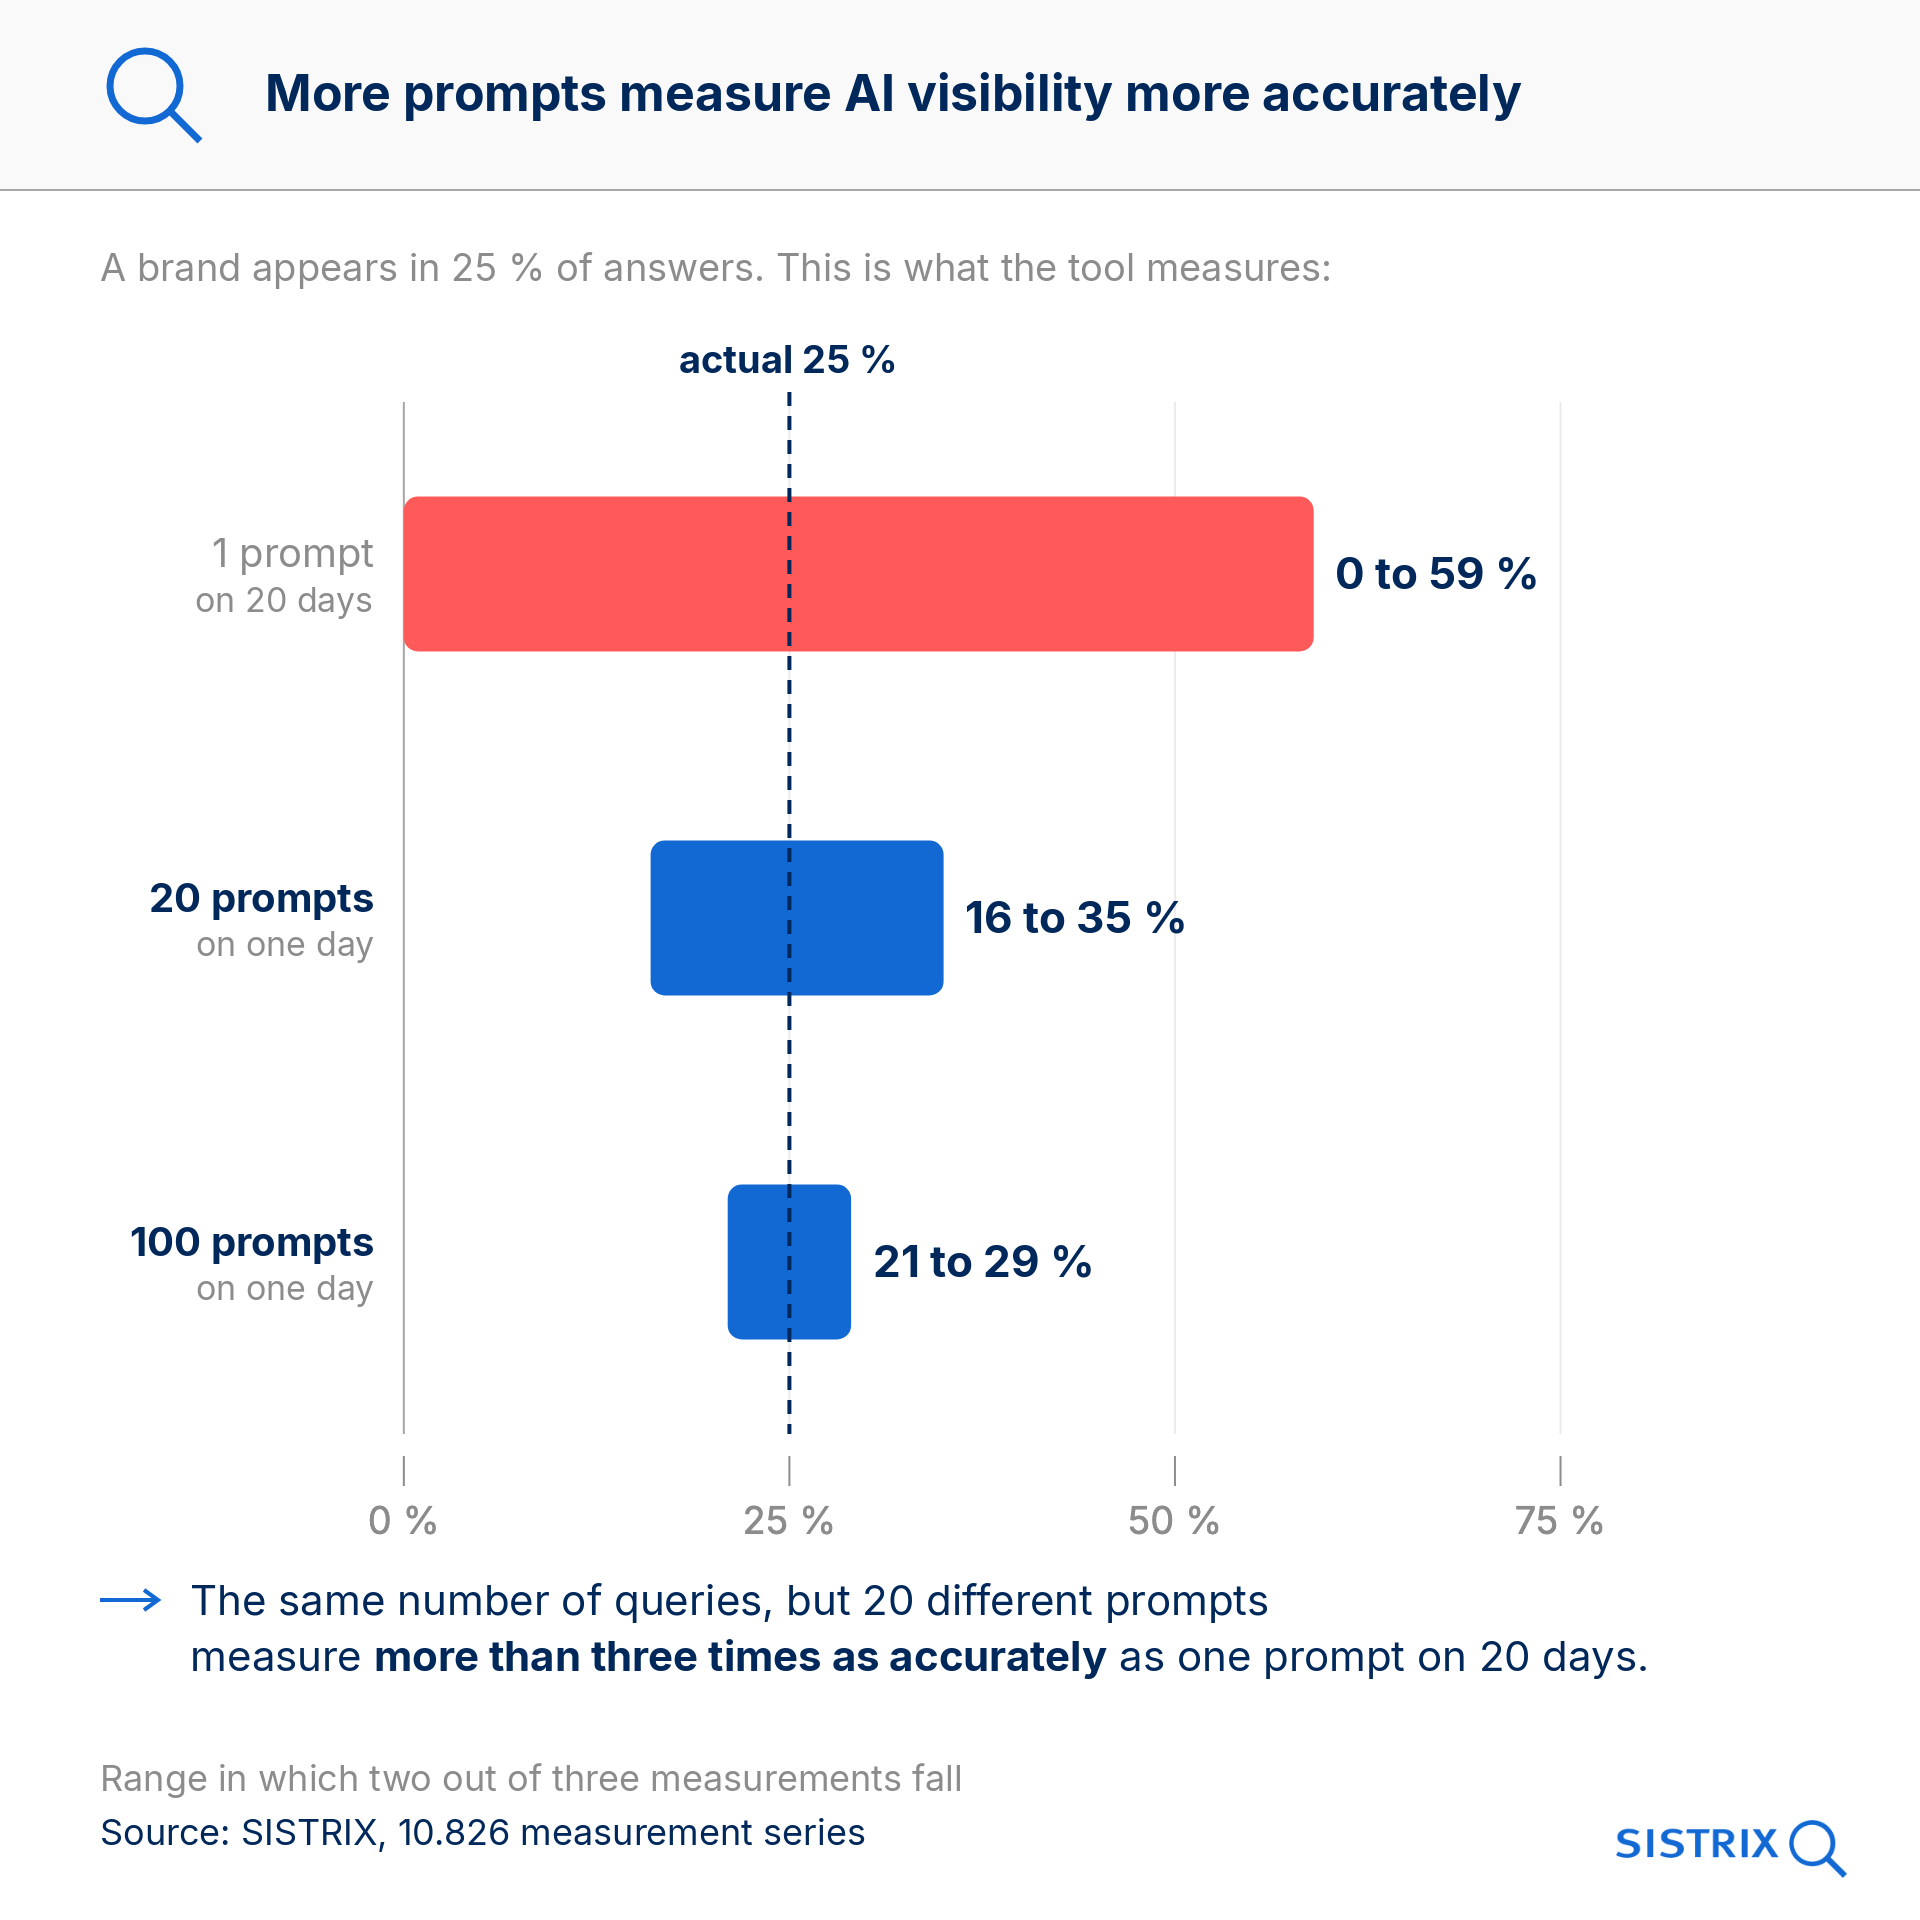
Behind these ranges are typical deviations from the true value: ±34 percentage points for one prompt, ±9.5 for 20 prompts and ±4.2 for 100. Typical deviation means that in around two out of three cases the measurement lies within this range, and in 95 per cent of cases within twice the range.
For the same effort, measuring with 20 different prompts is more than three times as accurate as measuring one prompt on 20 days. The picture is almost identical across all four models and all eight countries: with 20 prompts, the deviation is between ±9 and ±10 points everywhere.
Why breadth wins
The reason lies in two kinds of fluctuation. The same prompt produces different answers from day to day. Different prompts, however, produce answers that differ far more: for one question the brand is almost always included, for the next almost never. On average, the differences between prompts are 2.4 times as large as the fluctuation of a single prompt over time.
Repetition only tackles the smaller of the two. With 20 prompts, a floor of ±7.6 points remains, however many repetitions you add. The only way below it is more different prompts.
In practice, this means that if you want to measure AI visibility for a brand, you are better off querying 100 prompts weekly than 15 prompts daily. The effort is similar, but the result is far more robust.
Many prompts average out the fluctuation
The SISTRIX AI Check shows how well this works in practice. For 60 brands per country in Germany, the US, the UK, France, Italy and Spain, we tracked how their figures move from week to week.
Of the prompts in which a brand is mentioned, between 20 and 55 per cent change every week: the brand drops out of some answers and appears in new ones. For ChatGPT and AI Mode it is around half, for AI Overviews roughly one prompt in five. Yet the net total of mentions usually changes by only 4 to 10 per cent. And the more prompts a brand has, the smoother its curve. For brands with fewer than 100 prompts, AI visibility fluctuates by a median of ±5.7 per cent from week to week. From 10,000 prompts upwards, it is only ±1.9 per cent.
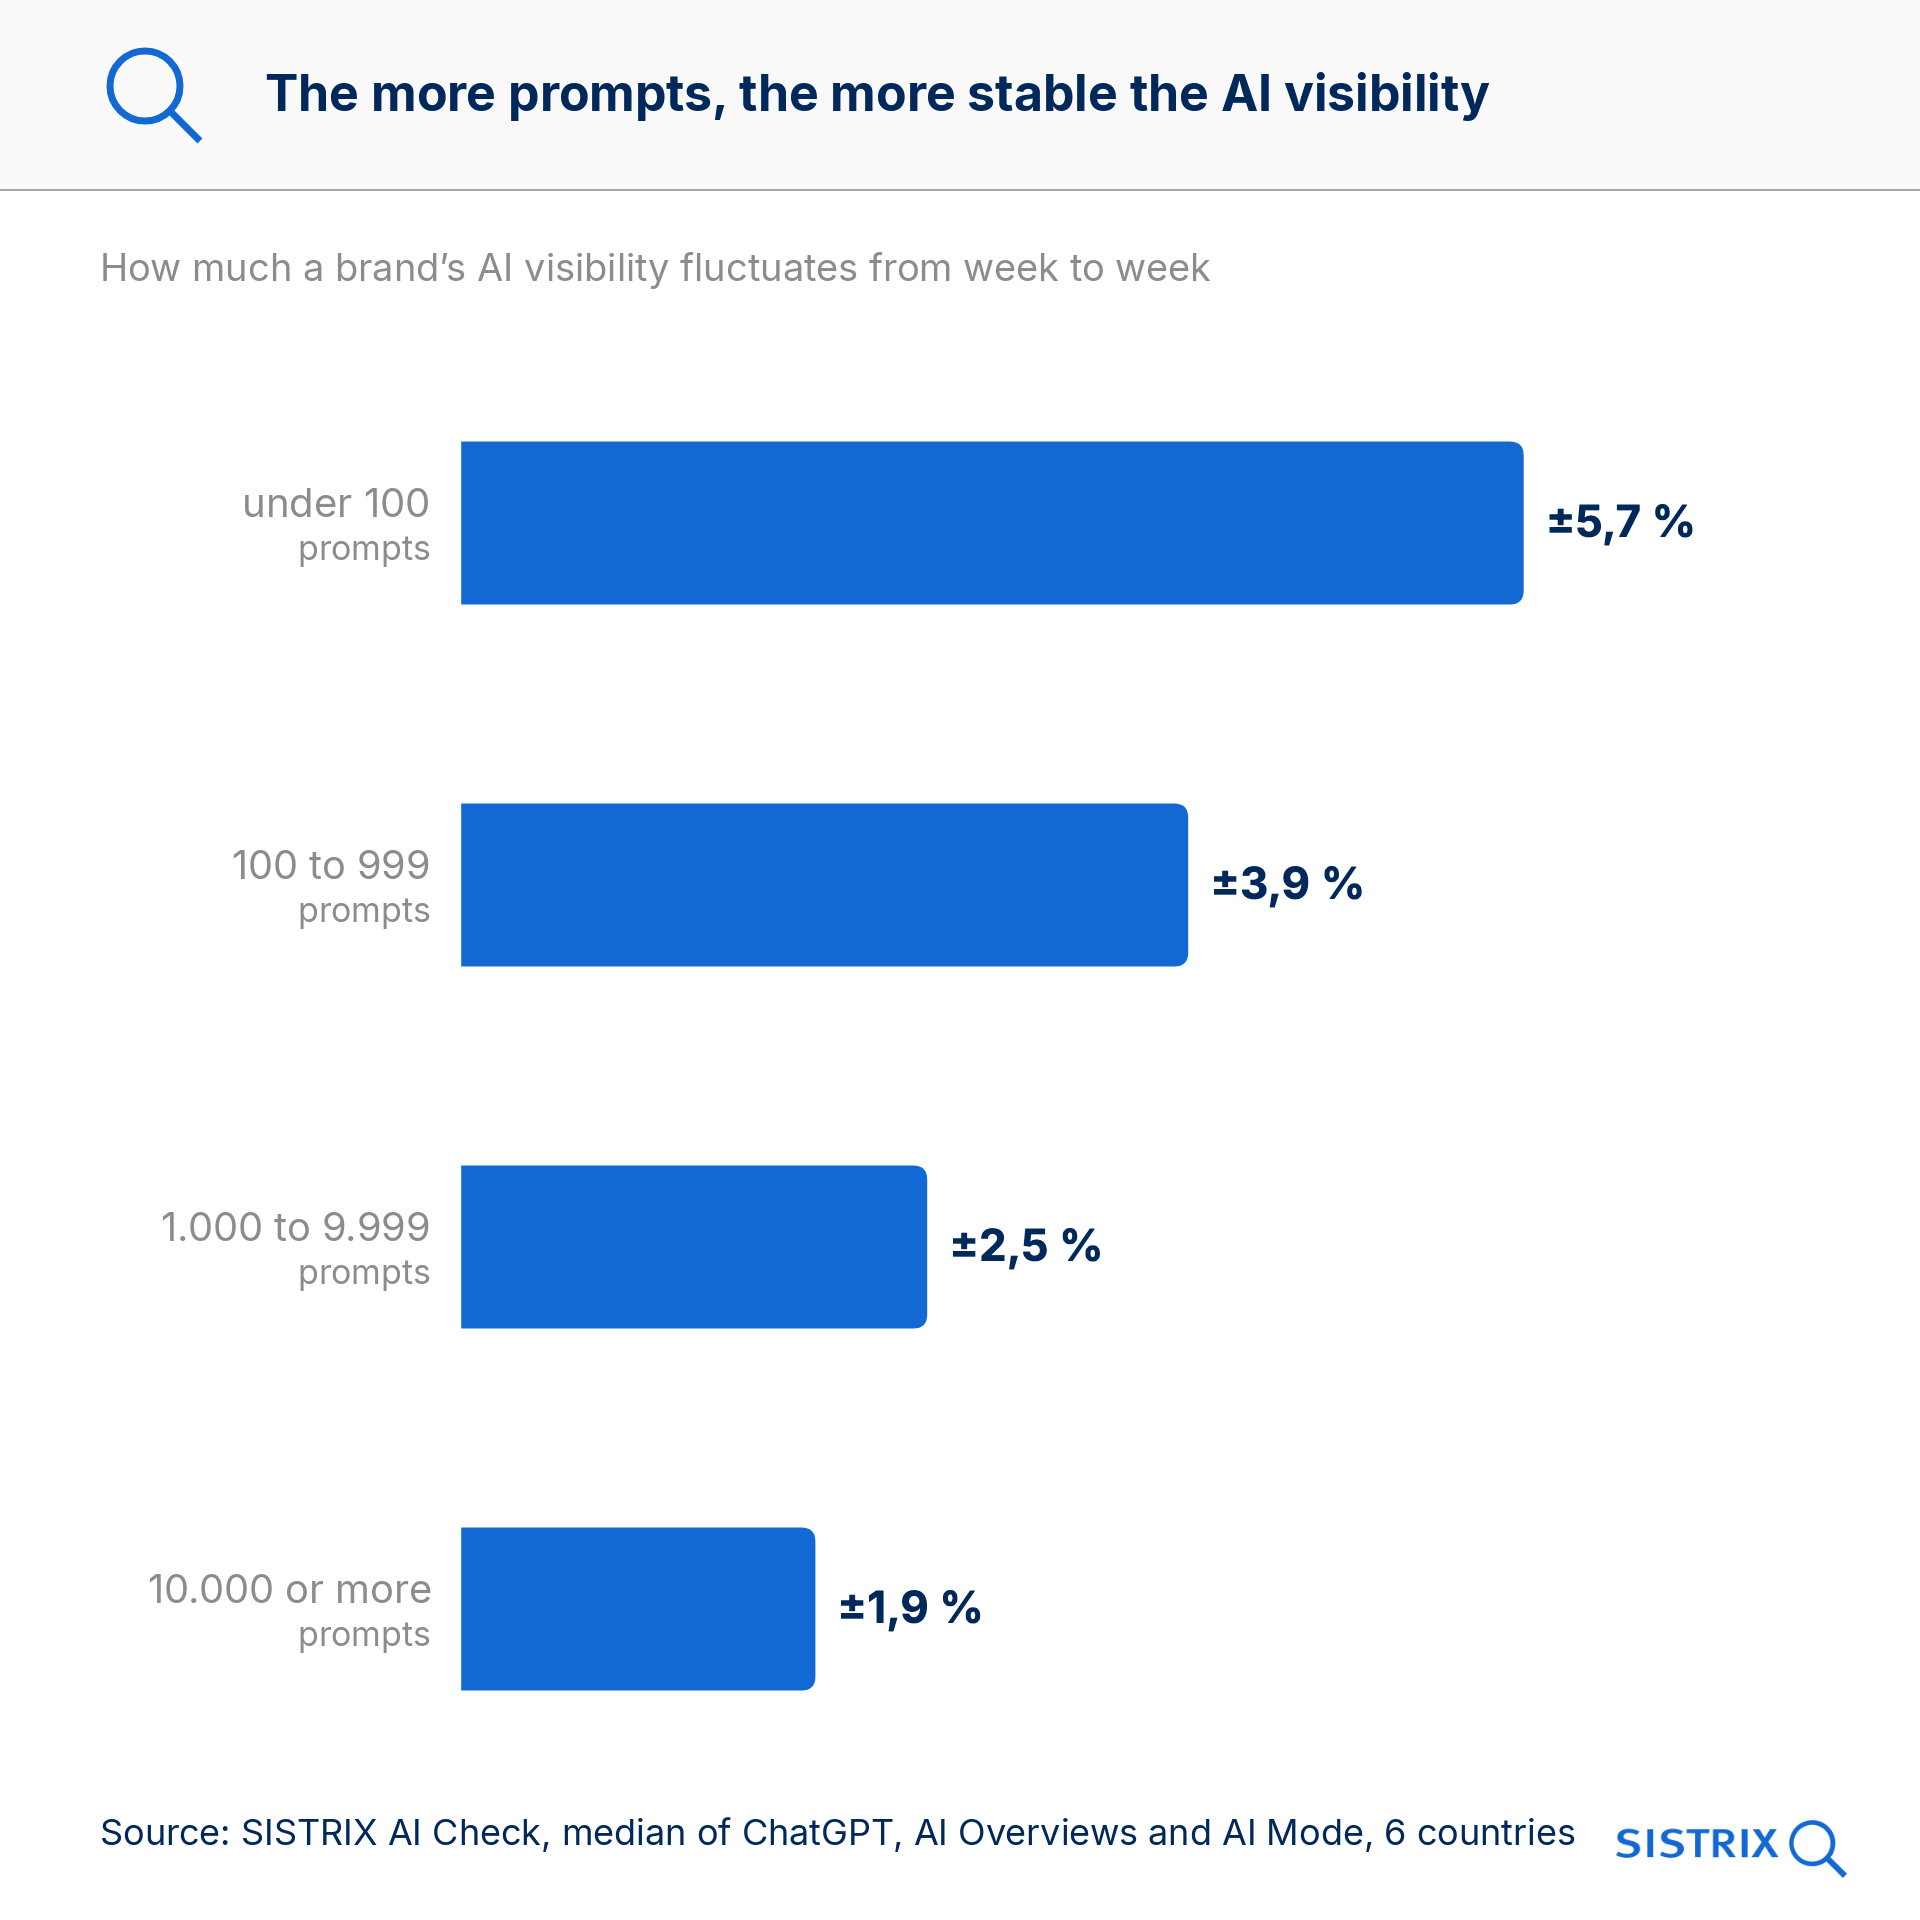
What we measured is the deviation from each brand’s own trend, adjusted for changes in the overall prompt pool. The only exception is very large brands in AI Overviews, at ±3.1 per cent: there, changes in the prompt pool have a stronger effect than the randomness of the answers.
Individual answers fluctuate heavily, but the figure across many prompts stays stable. That is exactly the effect you need for reliable measurement.
When daily queries still make sense
On one point, iPullRank is right: repetition isn’t worthless. It just answers a different question.
‘How visible am I?’ is answered with breadth. ‘Has anything changed?’ is answered with repetition. If the prompt set stays the same, the differences between prompts cancel out in the comparison, leaving only the day-to-day fluctuation. With 20 prompts, the daily value is accurate to ±4.8 points, the weekly average to ±1.8 points.
So if you want to know whether something has shifted after making a change, compare weekly averages rather than individual days. The daily average across 20 prompts typically jumps by 4 to 5 points, and on one day in ten by 10 points or more, without anything having changed at all.
That is why many tools average daily values over a rolling 7-day window. This makes sense for tracking changes, but does little for the level. Measured over seven days, 20 prompts are accurate to ±7.9 points, barely better than on a single day (±9.5). Even an unlimited number of days won’t get you below ±7.6, because the window only averages out the day-to-day fluctuation, not the choice of prompts. The same 140 queries run as 140 different prompts on a single day, by contrast, reach ±3.6 points.
Precise isn’t the same as accurate
iPullRank distinguishes between precision (how widely does a measurement scatter?) and accuracy (does it hit the true value?), and concludes that with AI visibility there is no true value against which accuracy could be measured.
We see it differently. If you define the true value as the mention rate across all prompts in a market, as captured by the AI Check, accuracy can be measured. And it turns out to be the bigger source of error.
We compared brands’ visibility in self-selected prompt sets with their visibility in the AI Check, in each case as a share relative to their competitors. Without a selection effect, a brand’s own set would sometimes come out higher and sometimes lower, so it would look better in roughly half of all cases. In fact, the brand performs better in its own set in three out of four cases, usually by a clear margin. Depending on which competitors are used for comparison, the figure ranges from 63 to 80 per cent.
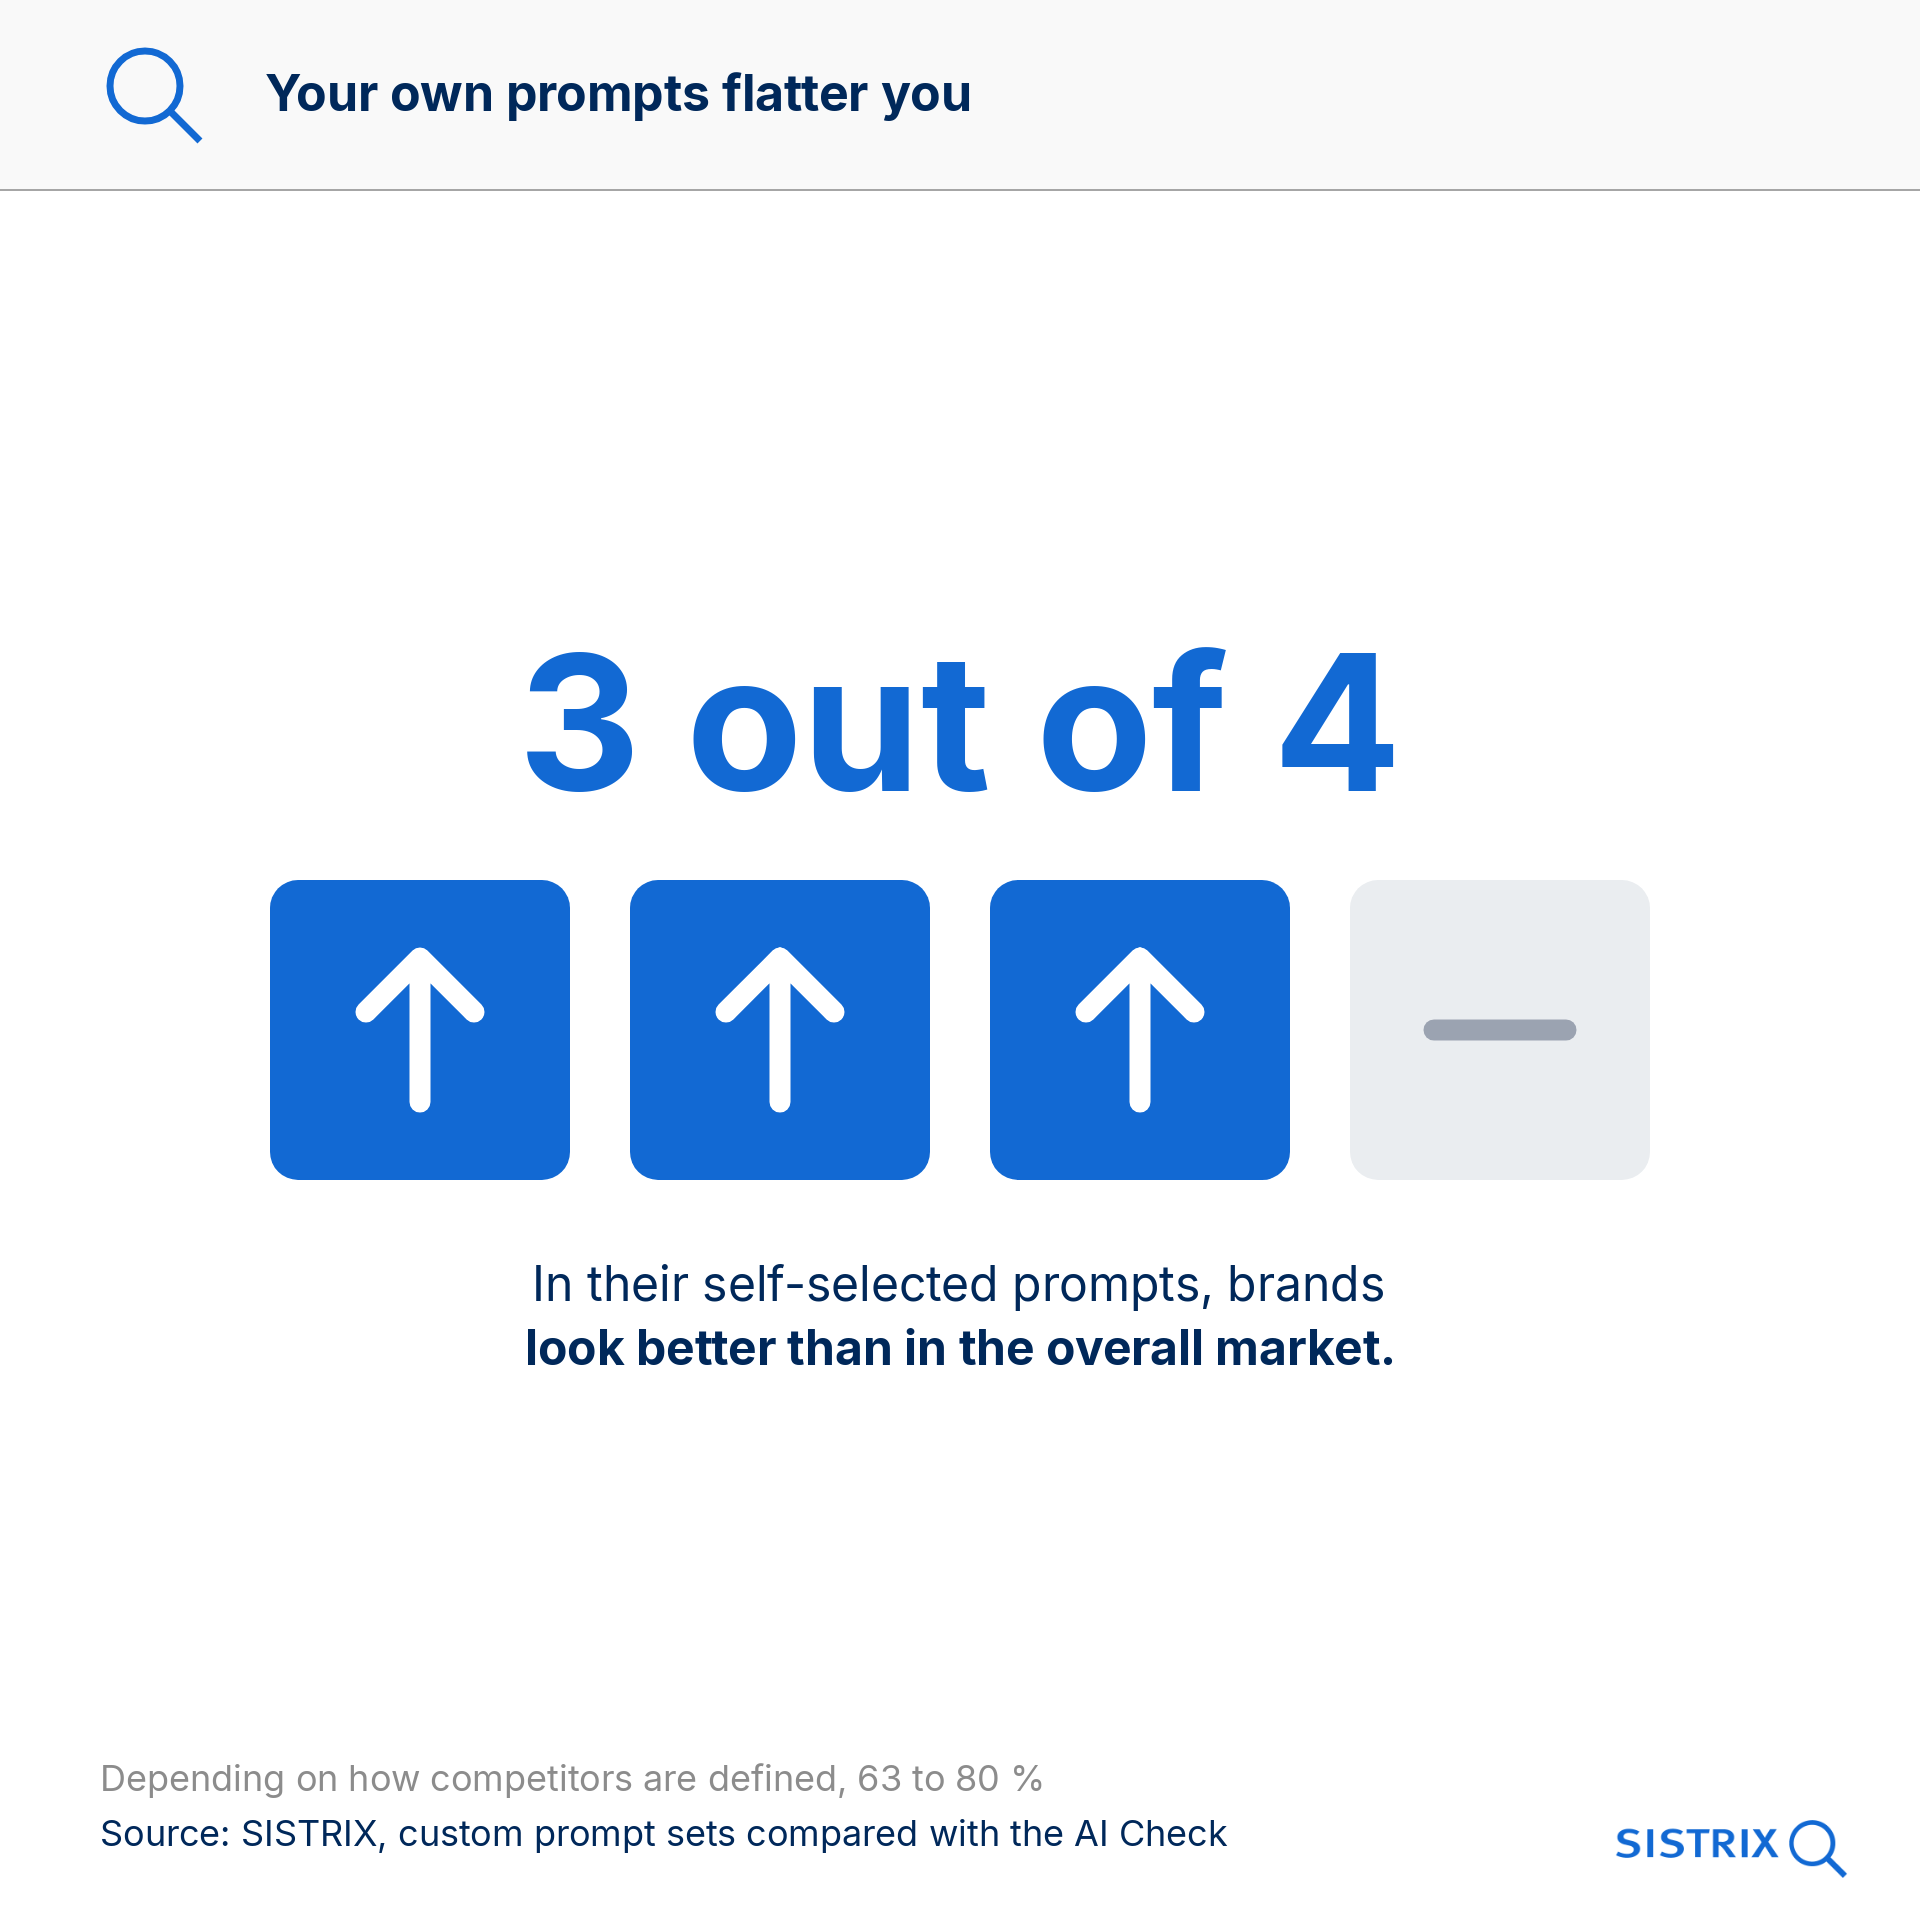
This isn’t a measurement error but a selection effect. Anyone who picks their own prompts picks questions that are close to their own brand. The instrument is precise but misses the target, like the second darts player in the image from the iPullRank article.
In your own set: stable for your brand, uncertain for competitors
One final finding puts the ‘roll of the dice’ picture into perspective. In self-selected prompt sets, a brand deviates from its usual result in only 6 per cent of daily runs. Most prompts mention it either almost always or almost never.
This, too, is partly down to selection: if you build your prompts around your own brand, you measure your own brand well and everyone else only at the margins. The most uncertain statements are therefore those about competitors and fringe brands, that is, the 70 per cent that only appear on a few days. If a small, self-selected prompt set suggests that a competitor has gained ground, treat that with caution. For comparisons with competitors, a prompt pool that wasn’t chosen with one particular brand in mind is the better basis.
What this means
Five recommendations for anyone measuring AI visibility:
- More prompts rather than more runs. For the question ‘How visible am I?’, the number of different prompts is the decisive lever. With 20 prompts, you only get a rough estimate (±10 points). For ±5 points you need around 70 prompts, for ±3 points around 200. As a rule of thumb, halving the uncertainty takes four times as many prompts.
- Weekly is enough for breadth. A large prompt set queried weekly is more reliable than a small one queried daily. With the same number of queries, 140 prompts once a week are accurate to ±3.6 points, whereas 20 prompts daily with a 7-day window only reach ±7.9. If you have the budget, put it into additional prompts, not more frequent queries.
- Assess changes using weekly averages. Daily values jump by 5 to 10 points for no reason. If you want to know whether an action is working on a fixed prompt set, compare weekly averages. With 20 prompts, their uncertainty is ±1.8 points, compared with ±4.8 for a single day.
- Measure the level across the market, and changes in your own set. Self-selected prompts show trends reliably, but usually paint too favourable a picture of the absolute level. To find out how visible your brand really is, a broad prompt pool like the SISTRIX AI Check is better suited than any self-selected set. The most meaningful metrics there are shares such as Share of Voice, because they balance out changes in the overall pool.
- Read competitor figures from your own set with caution. A self-selected prompt set is tailored to your own brand. Competitors only appear at its margins and fluctuate considerably more. This doesn’t apply to the AI Check: there, every brand is measured in the same way, and how stable its figure is depends only on how many prompts it appears in.
This leads to a simple division of labour. How visible a brand is becomes clear when you look across a very large number of prompts that weren’t chosen around that brand: in the AI Check, AI visibility for brands with more than 1,000 prompts fluctuates by only ±1 to 3 per cent per week. Whether an action is working is shown by a fixed prompt set in Prompt Tracking, queried daily and averaged over weeks. Keep the two apart, and you get a figure that is right and a curve that reliably shows changes.