The Competition Table shows you which brands the AI mentions in the same context as your entity, but not yet how it assesses those brands in comparison. That’s exactly where Competitive Perception comes in: you can see which topics AI models use to praise or criticize your brand compared to your competitors. This helps you understand which topics you’re already perceived positively for in AI search, and which topics your competitors are doing better on.
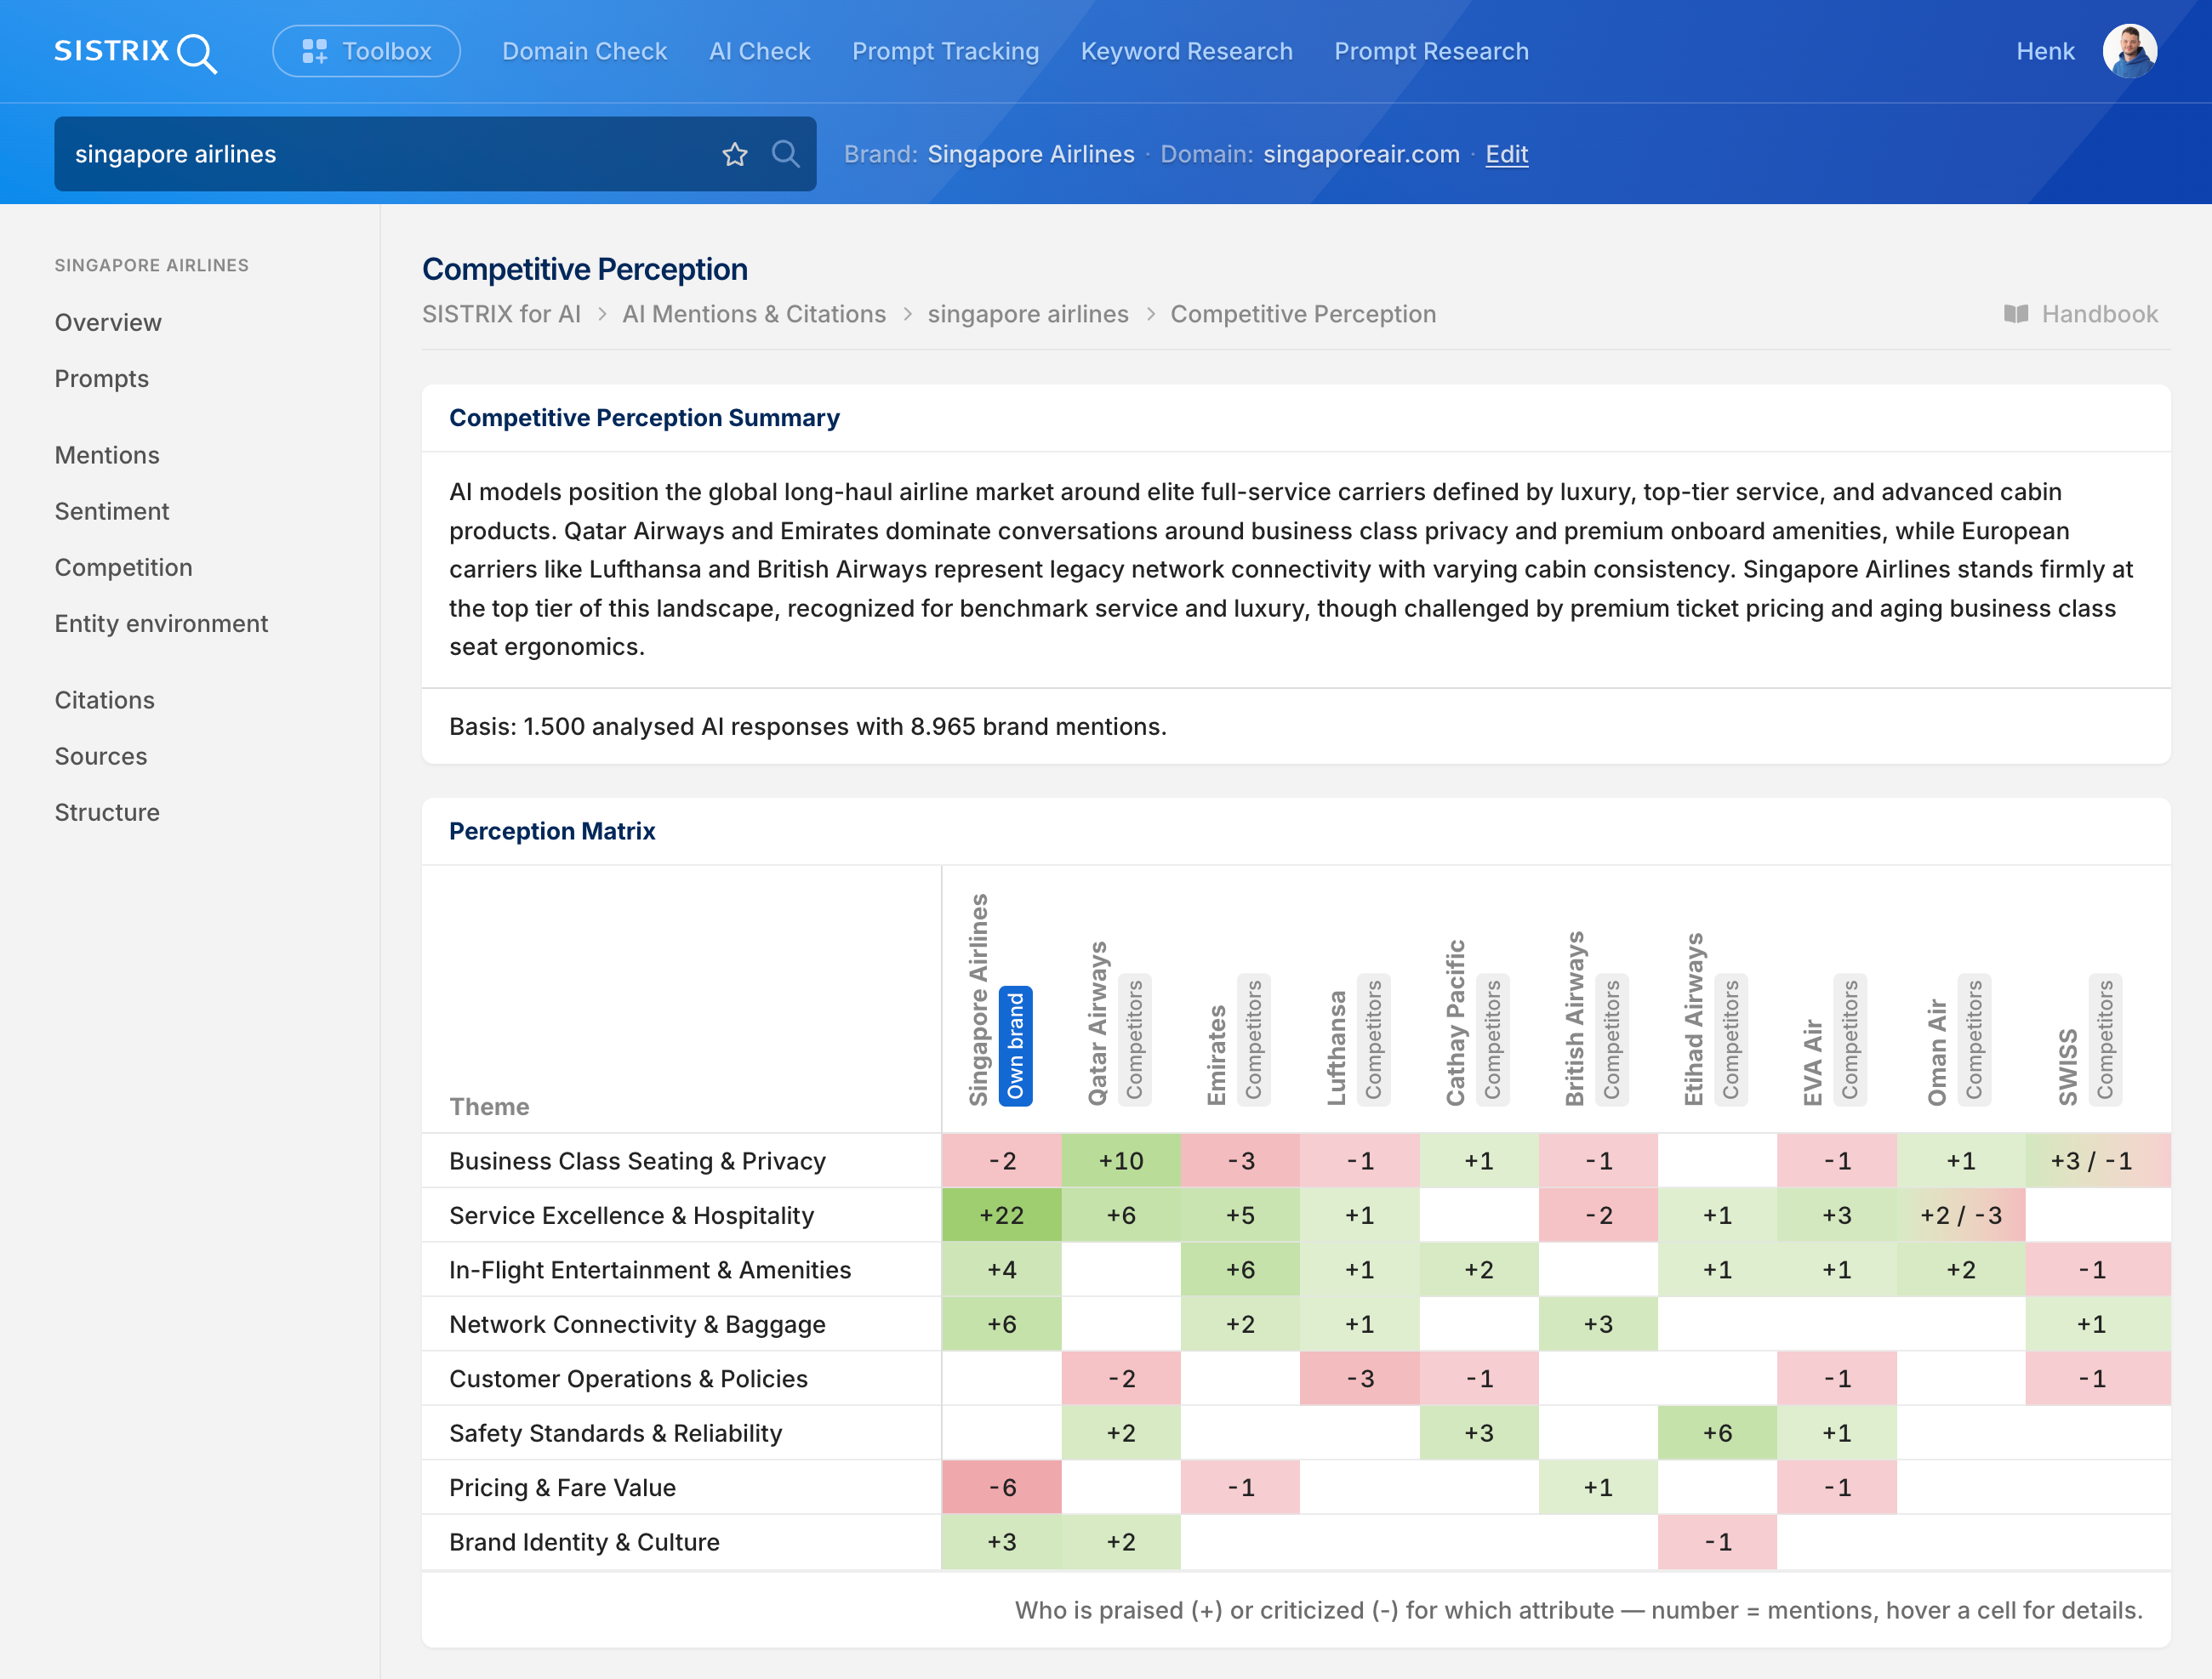
For this analysis, AI models are surveyed industry-wide, not just about your own brand, and every statement found is assigned to a topic and a brand. This means the responses about the competitors identified in the Competition Table are evaluated as well, making them visible where they’re criticized too, not only where they’re praised.
Summary
At the top, a short text puts the overall competitive landscape into context: which topics AI models use to structure the market environment, and where your brand stands within it. A baseline below states how many analyzed AI responses and brand mentions the evaluation is based on.
Perception Matrix
The rows of the Perception Matrix list the topics, such as price-to-value, customer service, or feature set, while the columns list the brands, with your own brand and the competitors clearly marked.
Each cell shows, for the given topic and brand, how many praise mentions (marked with a plus) and how many criticism mentions (marked with a minus) were found. This makes it visible at a glance which topics your brand is perceived as strong or weak in compared to the competition. Hovering over a cell shows the detail of which quotes it’s based on.
Where your brand leads
This lists the topics where your brand already performs strongly compared to the competition, each with the corresponding praise and criticism figures. This shows the topics where AI models already highlight your brand positively today.
Where competitors lead and your brand does not (yet)
Conversely, this covers topics where competitors are praised but your brand doesn’t yet keep pace. Next to each topic, you can see which competitors occupy it and with how many mentions. This makes visible the topics that AI models have so far rarely connected with your brand in a positive way.
Next Steps
Based on the topics where your brand performs strongly or weakly compared to the competition, this section derives concrete recommendations for action, already sorted by relevance.
Brand Overview
For every brand, your own as well as each competitor, there’s a dedicated card with the perceived strengths and weaknesses as individual statements. Next to each statement is the number of mentions. If the analysis finds no weaknesses for a brand, it shows “Not determinable.”
Each statement can be expanded. Underneath, you’ll find the original quotes per AI platform along with the corresponding prompts, so every classification can be traced back to its source.
Related features
Together with the Competition Table and the Recommendation Map, Competitive Perception forms the Competitors area of AI Search. While the table shows who’s mentioned alongside you, and the Recommendation Map shows on which occasions, this analysis shows which topics set you apart in substance.
For a different angle on the same data, you also have access to:
- Sentiment Analysis: The overall tone AI models use when talking about your brand, independent of any specific topic or competitor.
- Prompts: The specific questions and full answers that these mentions come from.