The Competition Table shows you which brands the AI generally mentions in the same context as your entity. The Recommendation Map goes a step further and breaks this down into specific positions: which tasks or purchase situations AI models recommend your brand for, and which ones they instead mention someone else for or advise against you. A position, in this context, is a specific task or purchase situation for which users are looking for a recommendation. For each position, the analysis assigns your brand a role, showing how present you are in the AI’s recommendations.
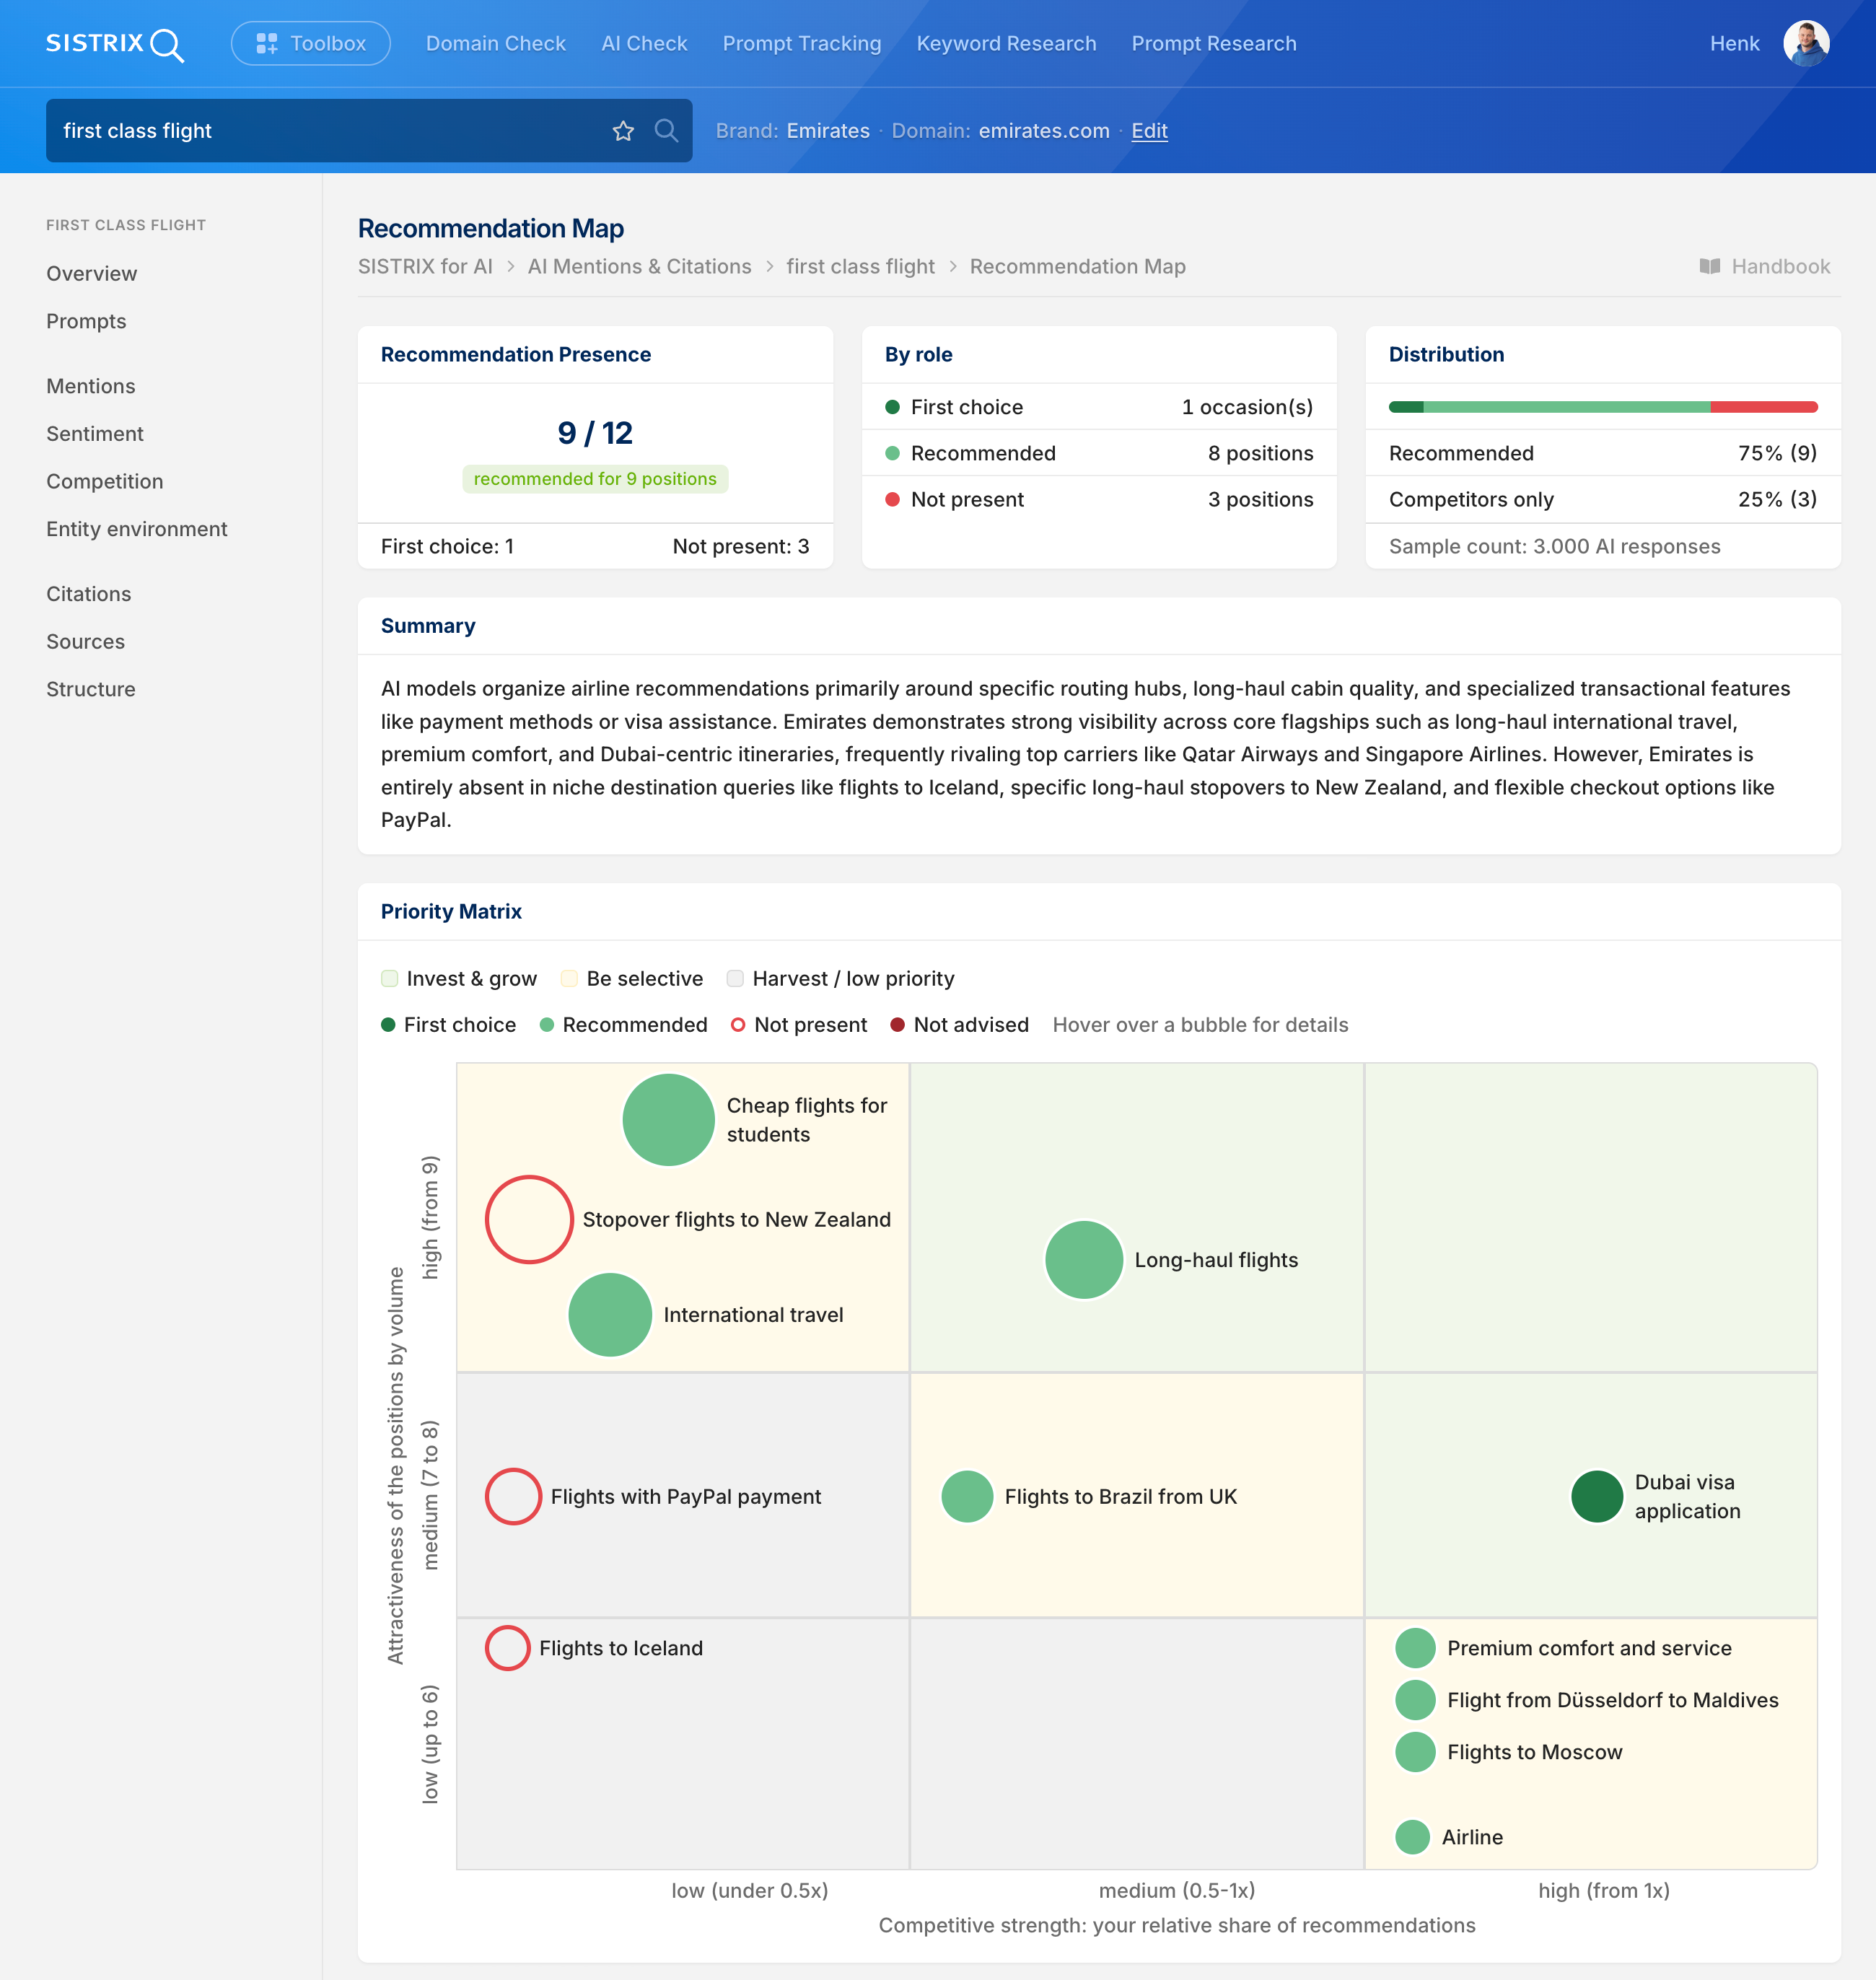
The data basis is deliberately broad. Alongside the responses about your own brand, the response pools of the key competitors from the Competition Table are also included. This makes visible positions where only competitors are recommended and your brand would otherwise not have shown up at all. You start the analysis via the button on this page; after that, it’s saved as a completed analysis.
The four roles
For each position, i.e. each specific task or purchase situation, the analysis assigns your brand one of four roles, depending on how it performs in the AI responses for it. The color coding is consistent across the entire Recommendation Map:
- First choice (dark green, filled): Your brand is named as the best or top recommendation.
- Recommended (light green, filled): Your brand is mentioned, but not as the top recommendation.
- Not present (red, hollow): Your brand doesn’t appear for this position, others lead.
- Not advised (dark red, with a prohibition sign): Your brand is actively advised against for this position.
Recommendation Presence
In the format “X / N,” this metric summarizes how many of the examined positions your brand is recommended for at all, i.e. the sum of First choice and Recommended. Below that are the number of positions where you’re the First choice, and the number of positions where you’re Not present.
By role
Broken down by the four roles, this shows how many positions fall into First choice, Recommended, Not present, and, where applicable, Not advised. This makes it visible at a glance how your presence is distributed across all positions.
Distribution
The bar splits the positions into two shares: those where your brand is recommended, and those where only competitors are mentioned, each with a percentage and an absolute number. The baseline below states the size of the evaluated sample of AI responses.
Summary
In words, the summary puts into context how AI models structure the category overall, and where your brand is recommended within it.
Priority Matrix
As a scatter plot, the Priority Matrix represents each position as a point. The color and shape of the point show the role your brand holds for that position.
The y-axis represents the attractiveness of a position, i.e. its recommendation volume: how often that position is recommended for at all. The x-axis represents your competitive strength, i.e. your share of recommendations relative to your strongest competitor.
The background is divided into three zones: Invest & grow, Be selective, and Harvest / low priority. Based on a point’s position, you can read off how important a position is and how strongly you’re already represented there. Hovering over a point shows the leading brand, the number of recommendations, your share, and the AI’s assessment.
Positions without your brand: who’s leading instead
This section shows exclusively the positions where your brand is missing. For each one, it notes which brand leads there, with the corresponding recommendation and first-choice figures, plus a suggested content approach and a supporting quote from the competitor. If there’s no position where you’re missing, the box is hidden.
All positions
Complete and grouped by role, with the best first, this section lists all positions, for example under “You’re recommended” and “You’re missing.” For each position, a bar shows the recommendation volume, and next to it, depending on the role, the strongest competitor or the leading brand with their mention counts.
Each position can be expanded. Underneath, you’ll find all brands involved with their mention counts and role labels, the AI-generated finding, and a supporting quote. For quotes in other languages, the English translation appears directly below.
Related features
Together with the Competition Table and Competitive Perception, the Recommendation Map forms the Competitors area of AI Search. While the table shows who’s mentioned alongside you, and Competitive Perception shows which topics set you apart, this analysis shows the specific positions you’re actually recommended for.
For a different angle on the same data, you also have access to:
- Sentiment Analysis: The overall tone AI models use when talking about your brand.
- Prompts: The specific questions and full answers that these recommendations come from.