
Your target audience no longer uses just Google. They ask ChatGPT for product recommendations, use Perplexity for research, get answers from Google AI, and use AI Overviews to understand topics and compare options.
- What the AI Prompt Tracker does
- Who is the AI Prompt Tracker suitable for?
- How Prompt Tracker collects data
- Quick start: Your first AI project
- Manage projects & prompts in detail
- Understanding the project overview
- Create new project in detail
- Import prompts (CSV / list)
- Project settings
- Dashboard: Your command centre for AI visibility
- Prompts: The foundation of your AI tracking
- Prompts overview and metrics
- View prompt details
- Grouped vs. Detailed
- Add & manage prompts
- Sentiment analysis: How AI talks about your brand
- Competitors: who gets recommended instead of you
- Entity Environment: The thematic context of your brand
- Sources: Where AI gains its knowledge from
- Coverage: Performance by AI platform
- Frequently Asked Questions (FAQ)
- Glossary
What the AI Prompt Tracker does
The SISTRIX Prompt Tracker monitors whether your brand appears when people ask AI tools questions about your industry, your products, or the problems you solve. The core functions:
- Multi-platform monitoring: Automatically tracks your brand 24/7 across all relevant AI models, including ChatGPT, Perplexity, and Google AI Overviews.
- Detailed sentiment analysis: See at a glance how AI talks about you (positive/negative) and which aspects it highlights.
- Direct competitor comparison: Find out which competitors are mentioned in your most important prompts and how often they appear instead of you.
- In-depth source analysis: Discover which websites AI uses as trusted sources to formulate answers to your topics.
- Efficient project workflow: Organise your work in unlimited projects, use automatic prompt suggestions and access historical data from day one.
Who is the AI Prompt Tracker suitable for?
The SISTRIX Prompt Tracker is suitable for anyone who wants to understand how AI talks about their brand. It is ideal for marketing teams who want to understand their AI visibility, SEO managers who optimise for AI search, and brand managers who monitor their brand perception. It also helps PR departments track their presence in AI responses and agencies that manage multiple client projects. The tool is particularly valuable for all companies that actively manage their online presence.
How Prompt Tracker collects data
Unlike many other tools, SISTRIX uses automated crawling instead of APIs. This means we simulate real user queries and capture the actual responses that your target audience sees. This gives you authentic insights from real user experience. Depending on your settings, all prompts are tracked daily or weekly across all supported AI platforms, so you always have fresh data on the development of your AI Visibility.
Visibility in AI works in two ways: firstly, through brand mentions, where your brand is mentioned by name in AI responses, and secondly, through source citations, where your content is used or referenced as a source, even without directly mentioning your brand.
Quick start: Your first AI project
To get started, navigate to Projects in the main navigation bar and click on “Create New Project“. Enter your project name there. Important: This name should match your brand (exactly as it should appear in AI responses), as the system searches for this term in AI responses.
The next step is to define competitors and prompts. You have two options: the recommended automatic option allows SISTRIX to suggest prompts and competitors for you based on an industry analysis. Alternatively, you can manually define your competitors and the first 10 to 15 prompts yourself. Prompts are the questions your target group might ask an AI, such as “Which accounting software is best for start-ups?”.
Once you have created the project, the first data collection begins immediately. Depending on the number of prompts, this may take a while, but you will often see your first data in the dashboard after just a few minutes (or an hour at the latest). There you will see your AI Visibility Index (how often you appear), the competitor comparison (who is mentioned instead of you), the sources used and the sentiment with which the AI talks about you.
That’s it – you’re ready to go! For detailed instructions on all import options, such as CSV upload, and other settings, simply continue reading the next chapter.
Manage projects & prompts in detail
Understanding the project overview
The Projects main page is your central project overview. Here you can see all your created projects at a glance, including the project name and the number of active prompts per project.
The statistics box is particularly important, as it shows you an overview of your prompt usage and your most important quota metrics. This includes your total available credits (“Prompt updates included in the package”), the capacity reserved for automatic system suggestions, your manually triggered queries (“Prompt updates requested by the user”) and your remaining quota.
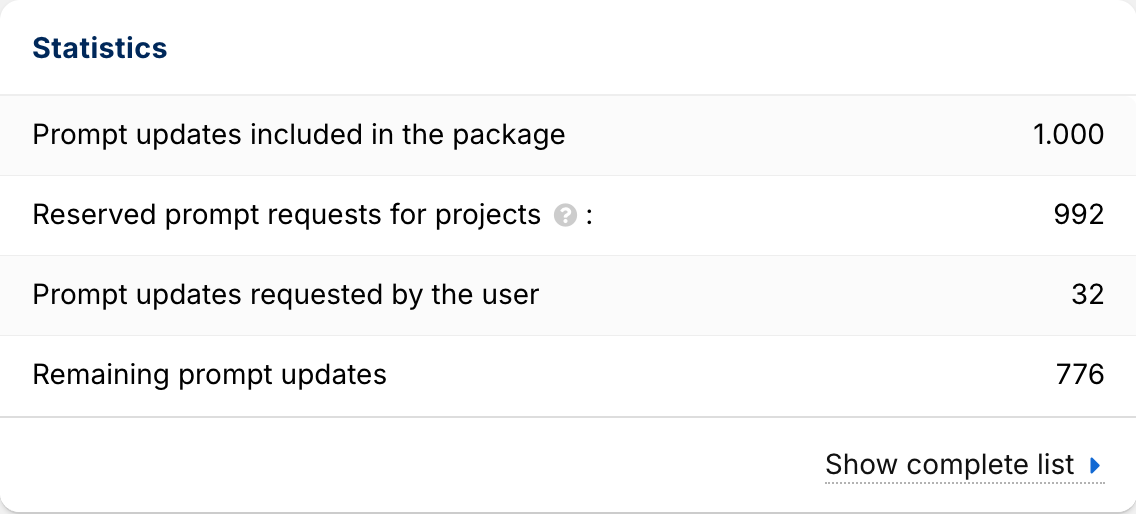
Note: A “prompt update” is counted each time a prompt is queried via one AI model. A prompt that runs across 3 models therefore consumes 3 updates per day or week.
Create new project in detail
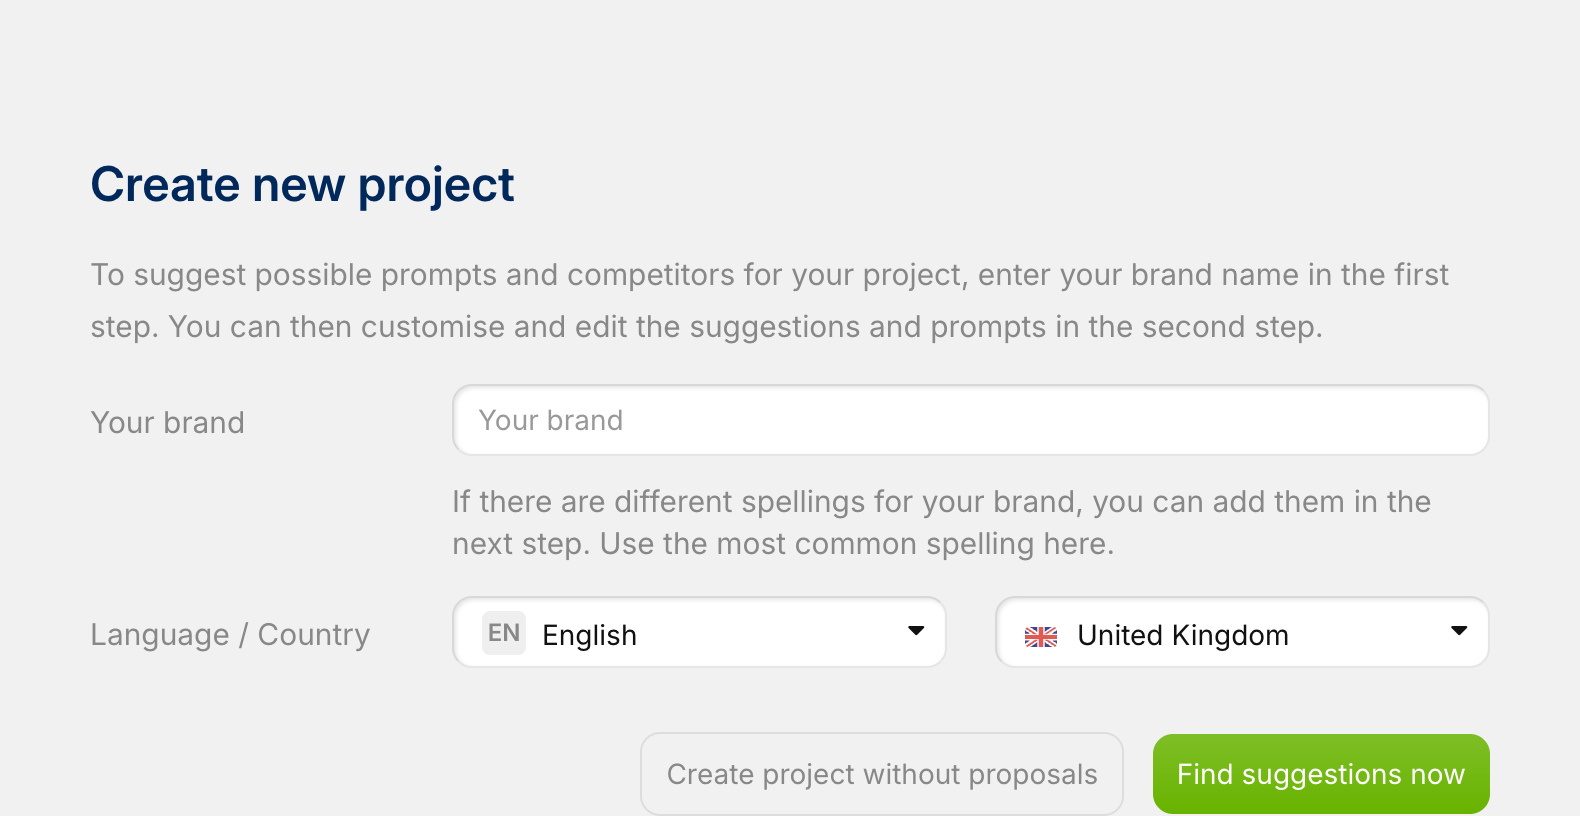
The project creation assistant guides you through the setup process in detail. In the first step, you define your brand by entering your brand name in the input field and selecting the desired language and country (e.g. English/United Kingdom). You then have a choice: Click on “Generate suggestions now” to receive automatic prompt suggestions, or select “Create project without suggestions” if you prefer to start completely manually.
If you have selected “Generate suggestions” (step 2), the system will suggest prompts based on your industry, frequent search queries and a competitor analysis. You can easily activate the relevant questions using the checkbox; you will also see icons for the AI models (such as ChatGPT, Perplexity, Google) and the language (UK flag). At the bottom of the page, a budget calculation shows you your resource consumption, for example: “75 prompts with 2,325 AI updates (55,655 of 250,000 AI updates in use).”
In the third and final step, you add your competitors. You can define up to 9 competitors (e.g. “Shell” or “Esso”). Clicking on “Create project now” completes the process and starts the first data collection.
Import prompts (CSV / list)
If you want to add many prompts at once, you can use the import functions. You can find these either in the setup assistant (during step 2) or later at any time in the prompts module. You have two options: With CSV import (import from file), you upload a CSV file with a specific format. With list import (import from list), you add your prompts from a prompt list in SISTRIX. You can fill this list beforehand in the research area, for example.
Project settings
Within a project, you can switch to the Settings menu item at any time to adjust your configurations. In the Brand section, you can define how your brand should be recognised in AI results by specifying a “main spelling” (e.g. “shell”) and “alternative spellings” (e.g. “Shell” or “SHELL”).
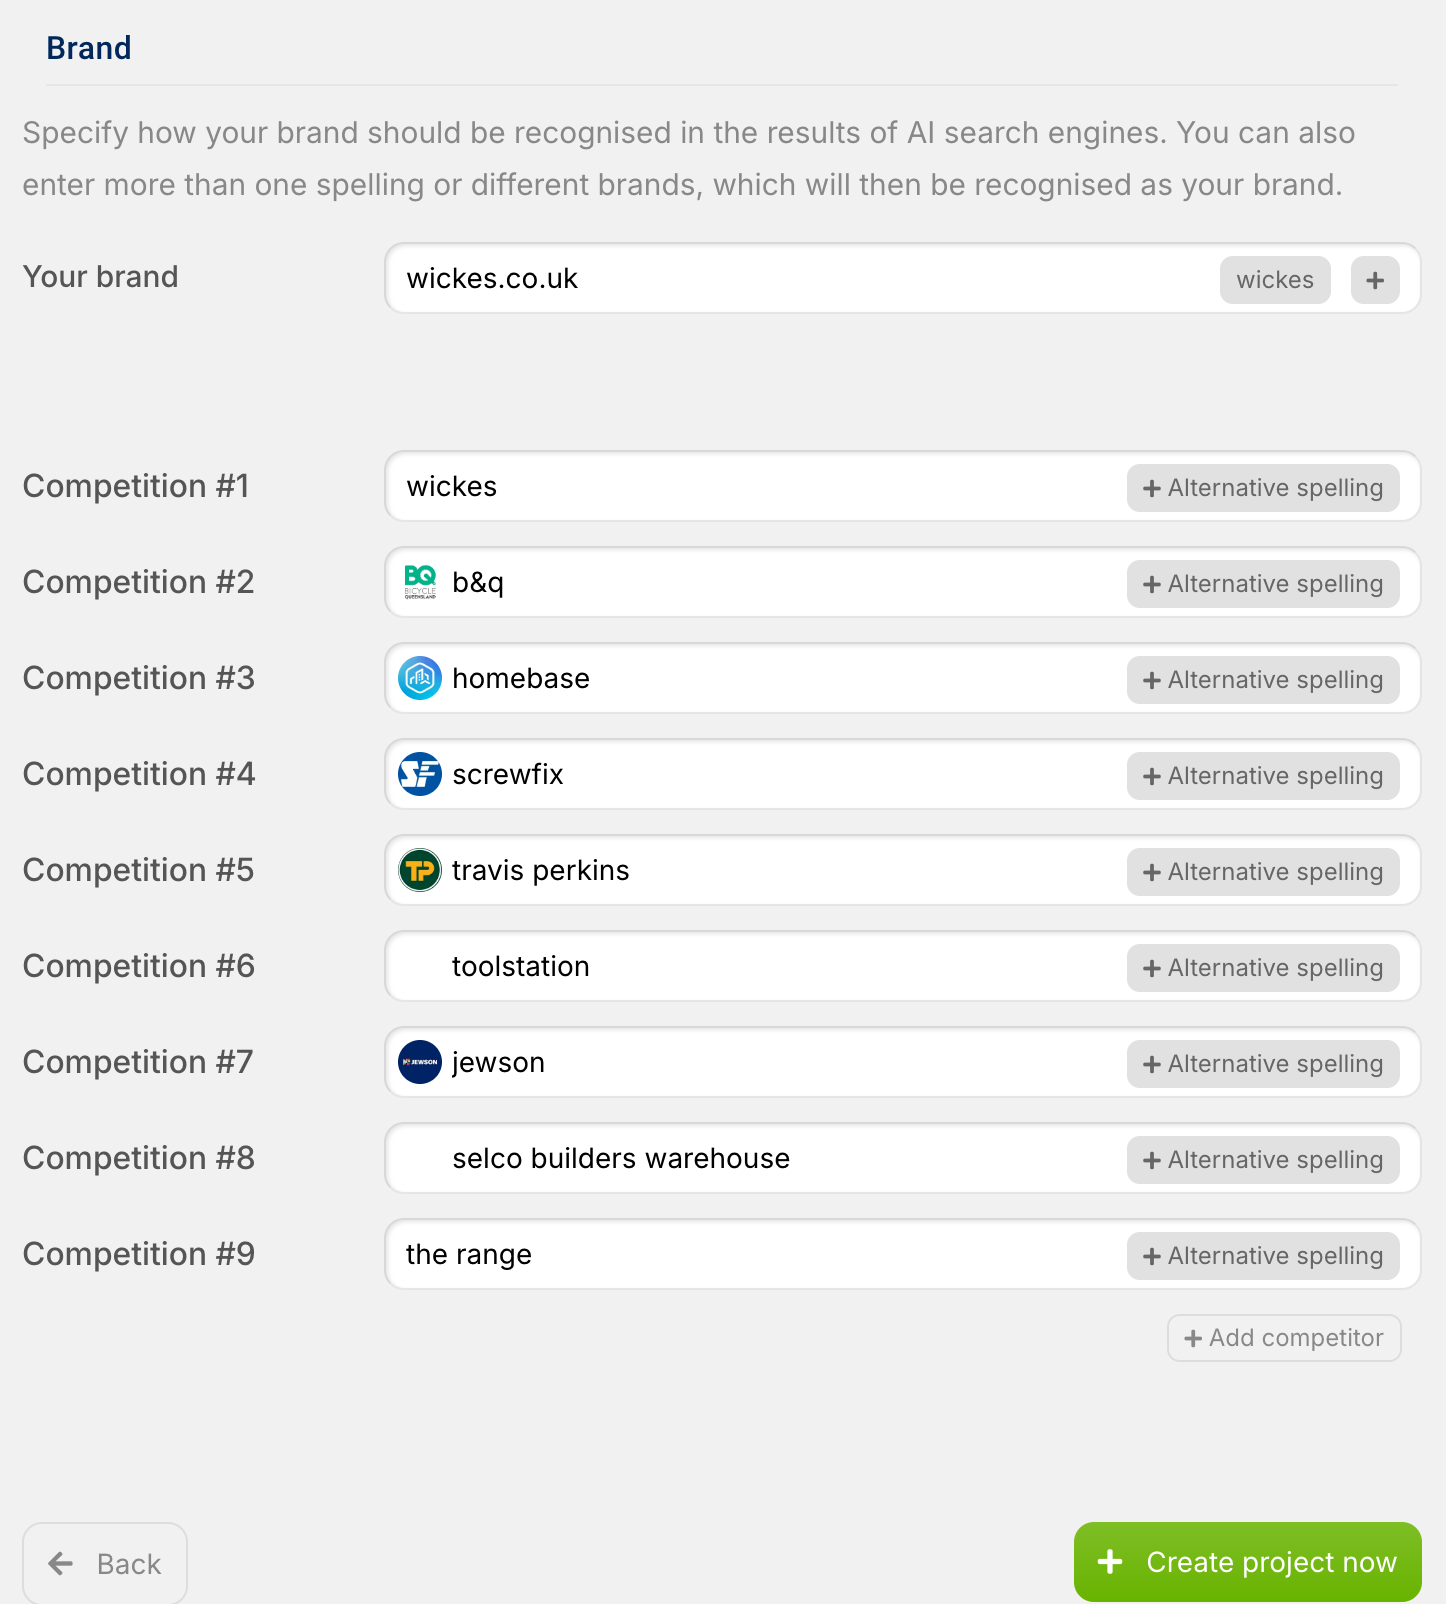
Similarly, you can add or edit as many competitors as you like under Competitors. Here, too, use the “Alternative spelling” function if a brand is known under different names, such as “Dr.Martens” and “Doc Martens”. Finally, under Actions, you will find the options to “Save” your changes or “Delete project”, which will permanently remove it along with all historical data.
Dashboard: Your command centre for AI visibility
The dashboard shows you at a glance how your brand is performing in AI responses based on prompts that have run in the last 24 hours. It is divided into several main areas.
The most important metric is the AI Visibility Index. This graph shows you the progression of your visibility over time, compares you directly with your competitors (coloured lines) and reveals trends over the last few days and weeks. A high index means that your brand is mentioned frequently, an upward trend signals improved AI visibility, and if your line is above that of your competitors, you are performing better.
Right next to it, you will find the competitor ranking. This table lists all tracked brands by name and shows their percentage “Visibility” (mentions) as well as the number of different prompts (“Prompts”) in which they appeared.
The Sources (Host Names) box lists the top domains used by the AI as sources and shows which of your tracked brands (coloured dots) are mentioned on these sources. Use this to identify important industry websites and understand which sources the AI trusts.
The Entity Environment visualises the most common topics and terms from the AI responses as a word cloud, with larger terms being mentioned more frequently. You can use these insights directly for content optimisation and topic identification.
Finally, at the bottom of the dashboard, you will see a Prompts Preview. This list shows your active prompts (the questions), the tested AI models (icons), your average ranking position, and whether your brand was found (✓ or ✗), including your assigned tags.
Prompts: The foundation of your AI tracking
Prompts are at the heart of the SISTRIX Prompt Tracker. Everything we analyse is based on the questions you define. The reason for this is that AI models do not work with keywords; instead, people ask complete questions. For example, instead of searching for “best running shoes”, they ask: “Which running shoes are best for marathon training under £200?” Visibility in AI therefore means appearing in precisely these conversations, either as a named brand or through content used.
Prompts overview and metrics
The Prompts page (in the project menu) shows you all your configured questions with the most important metrics. One of the key metrics is position. This shows where your brand was mentioned in the AI response: “1.0” means the first brand mentioned (the best position), “2.0” means the second, while no value indicates that your brand was not mentioned.
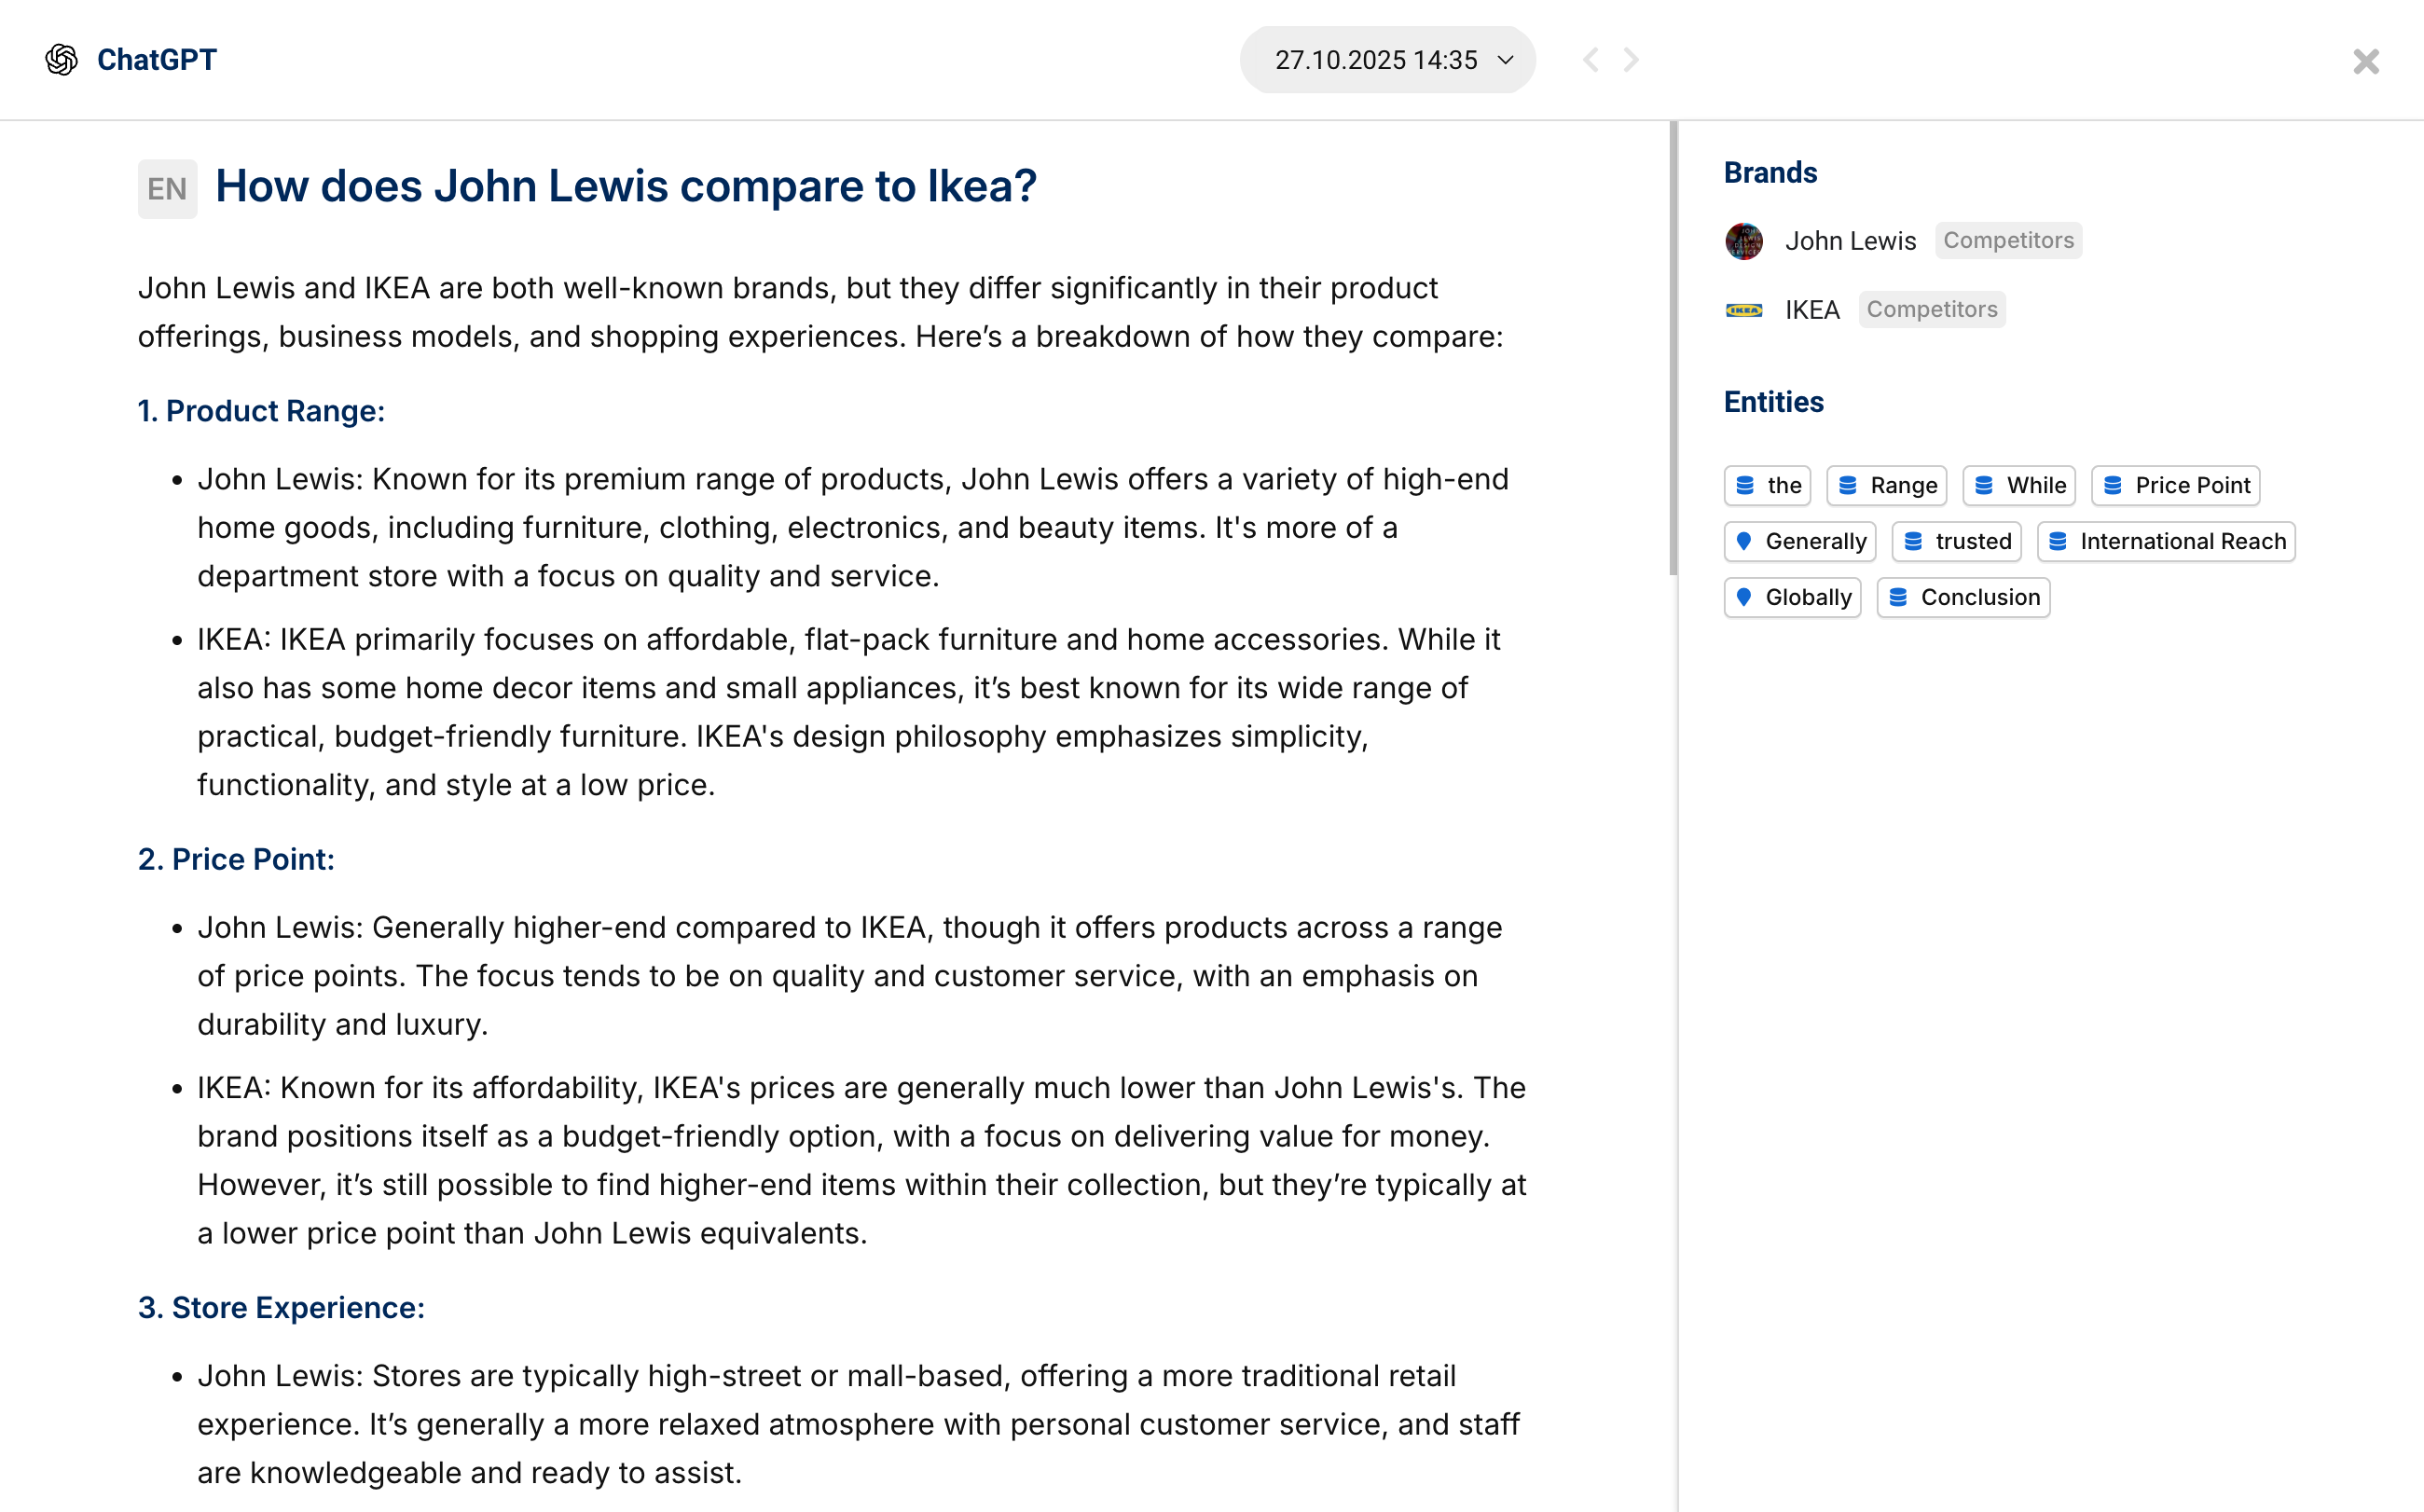
View prompt details
When you click on any prompt in the list, the detailed view opens. There you will see the complete AI text from each model, with all brand mentions (yours and your competitors) highlighted in colour, as well as the date of the last query. On the right-hand side of the detailed view, you will also find an analysis of the brands mentioned and the thematic environment (entities) specifically for this prompt.
Grouped vs. Detailed
At the top of the prompts overview, you can switch between two views: The default “Grouped” view shows you aggregated data across all AI models. The “Detailed” view is useful for deeper analysis, as it displays a separate row for each AI model for each prompt, revealing the performance on individual platforms (e.g. ChatGPT only).
Add & manage prompts
To add prompts, you can type them in manually using “Add prompt” (one per line). To keep track of lots of prompts, you can organise them with tags (e.g. by product, price comparison or awareness phase) and use the filter options (by tags or AI model).
Sentiment analysis: How AI talks about your brand
Sentiment analysis not only shows whether AI is talking about you, but also how—in what tone, context and with what associations.
On the sentiment analysis page, you can see the logo, name and a short description for each brand (your own and your competitors) that characterises how AI represents the brand. This AI-generated summary may look like this, for example: “IKEA is a global leader in affordable, stylish, and functional flat-pack furniture, offering a unique shopping experience and strong sustainability initiatives, though product quality and the self-assembly requirement can be variable.”
Directly below, you will find a detailed breakdown of strengths (positive aspects such as “strongly tailored to German guidelines”, marked with green dots 👍) and weaknesses (critical aspects, marked with red dots 👎). The number to the right of each aspect shows you how often this point was mentioned in the responses.
You can use these insights to better understand your positioning compared to the competition. Communicate the aspects that the AI already recognises as your strengths in your content. It is just as important to address the identified weaknesses: if your product is considered “complex”, create content that addresses these concerns (e.g. “Easy setup in 5 steps”). Ultimately, the analysis helps you identify clear competitive advantages—strengths that you have but your competitors do not.
You can see the date of the last update in the top right-hand corner. Click on “Update now” for an immediate update of the analysis.
Competitors: who gets recommended instead of you
The Competitor section shows you which brands appear in the same AI answers as you do—and how you perform in direct comparison. The page consists of two main components.
First is the AI Visibility Index Graph. This line chart directly compares your AI visibility over time with the competitors you’ve defined in your settings. The interpretation is simple: a higher line means better visibility.
Below that, you’ll find the Competitor Table. It lists all brands that were found in your prompts—not just the competitors you’ve predefined. The table shows the brand name, its “Visibility” (mentions in the last 7 days), and the number of unique prompts (“Prompts”) in which it was mentioned.
Use these competitor insights to identify strengths and weaknesses: for which prompts do you rank well, and where are competitors stronger? You can use this to uncover content gaps by analysing which topics your competitors “own”, and leverage the data to set realistic goals as benchmarks.
Entity Environment: The thematic context of your brand
The Entity Environment shows you which terms, topics, and concepts (entities) the AI most frequently mentions in connection with your prompts.
The overview page lists these entities – for example, “accounting“, “tax declaration“, “automation“, or “freelancers” – and provides two key metrics: the total number of “Mentions” (how often the term appears) and the number of unique prompts (how many different prompts it appeared in).
This analysis helps you gain valuable insights: you can identify thematic associations and understand which topics the AI connects with your brand. It also supports audience identification when entities like “freelancers” or “startups” appear frequently. In addition, you can see feature perception, showing which functions (e.g., “automation“) are mentioned most often. Finally, you can identify content gaps if important terms you aim to own are missing—and use that knowledge to create new, targeted content.
Sources: Where AI gains its knowledge from
The Sources page shows you which websites the AI uses as references for its answers and which of your tracked brands are mentioned there. Understanding these sources is one of the most important levers for your optimisation.
The page offers three views organised in tabs. The “URLs” tab is the most detailed, listing individual, specific URLs used as sources. There, you can see the exact page, which of your brands (represented as coloured dots) are mentioned on that URL, and how often the URL was used as a source (“Mentions”). The “Hostnames” view aggregates this data by domain (e.g., www.ikea.com), while the “Domains” tab simplifies it further to top-level domains (e.g., ikea.com).
This analysis is strategically very valuable. You can uncover backlink opportunities by identifying websites that write about your industry but don’t mention you yet. It also supports your PR strategy by helping you identify key industry publishers for guest articles and enables you to discover content partnerships with authoritative voices in your niche. The overarching goal is optimisation: your own content should be strong enough to become an AI source itself.
Important: A source can be used by the AI even if it isn’t explicitly cited in the answer. This means your content might contribute to an AI-generated response even when your URL doesn’t appear directly in it.
Coverage: Performance by AI platform
The Coverage page (Coverage in the project menu) shows you how your brand performs across different AI platforms compared to your competitors.
The central Coverage Table lists each brand individually. In addition to the brand name, it displays the Average (the overall coverage across all models) as well as the specific performance on AI Overview, ChatGPT, and Perplexity.
The percentages shown indicate the share of prompts in which your brand is mentioned on the respective platform. For example, a value of “75% on ChatGPT” means that your brand appeared in 75% of the tested prompts in ChatGPT’s responses.
These insights from the coverage analysis are strategically valuable: you can identify your platform strengths (Are you ranking better on one platform? Why?) and set clear optimisation priorities by focusing on platforms with lower coverage. Additionally, the direct competitor comparison shows where rivals are outperforming you on specific platforms.
Frequently Asked Questions (FAQ)
he AI Prompt Tracker is available free of charge for all SISTRIX customers during the beta phase. The number of prompts you can track depends on your booked SISTRIX package.
We currently track ChatGPT (OpenAI), Perplexity, and Google AI Overviews. This list is continuously being expanded.
Yes, all data is stored from day one. You can look back at any time and analyse trends over weeks and months.
We use automated crawling (simulated user queries), not APIs. This allows us to capture the actual responses that your target audience sees.
All prompts are tracked daily across all supported AI platforms.
A “Prompt Update” is the unit of measurement and corresponds to one prompt being queried once through an AI model. For example: one prompt run across four AI models uses four updates.
Your prompts will be paused until the next billing cycle.
That depends on your goal: to start, we recommend 10–20 core prompts. For deeper insights, 50–100 prompts are ideal. For full coverage, you should use your entire quota.
Good prompts should be written in natural language and tailored specifically to your target audience or use case. It’s helpful to test different perspectives. Avoid simple keyword lists.
You can pause or delete prompts at any time and add or remove tags. However, the prompt text itself cannot be changed—simply create a new prompt instead.
You can track up to nine competitors per project via the settings.
If a brand is known by different names (e.g., “Dr. Martens” and “Doc Martens”), we record all variations as the same brand.
The AI Visibility Index is an aggregated score that measures your visibility across all prompts and AI models. A higher score is better.
“Position” shows where your brand is mentioned in AI responses. A value of “1.0” means the first mention (the best position), “2.0” means the second mention, and so on.
The “Brand Found” indicator (e.g., shown as “3x”) tells you in how many of the tested AI models your brand appeared. “3x” means it was mentioned in 3 out of 4 models.
Glossary
- AI Visibility Index Aggregated metric for your visibility across all prompts and AI models.
- Coverage Percentage of prompts in which your brand is mentioned.
- Alternative Spelling Different written variants of a brand (e.g., “BP” and “bp global”).
- Citation Explicit mention of a source in the AI’s answer.
- Entity A term, topic, or concept within your market environment.
- Hostname Domain name of a website (e.g., ikea.com).
- Position Rank of your brand in AI responses (1.0 = first mention).
- Prompt A question or query submitted to an AI model.
- Prompt Update A prompt queried once through an AI model; the unit used for your quota.
- Source A website that an AI uses as a reference for an answer.
- Sentiment Tone of the mentions (positive/negative).
- Tag Category used to organize prompts.