
Use reports to compile data from SISTRIX quickly and easily and send them by e-mail to selected stakeholders, for example.
In reports, you can individually collect relevant data boxes, add images and text and then export the report as a PDF document or have it sent conveniently and automatically.
Features of Reports
Every data box in SISTRIX – whether weekly or daily data, for mobile or for desktop – can be easily transferred into a report and updates automatically. You always send out the freshest data.
If you connect your Google Search Console and Google Analytics accounts with SISTRIX, you can also transfer the data from these extensions into your reports. This simplifies your daily SEO workflows and saves you time.
With design templates you can adjust the appearance of your reports to your needs, for example by using specific colours. You can also create templates for the structure of a report itself and thus, for example, send reports with the same structure for different domains.
The maximum number of reports you can create depends on the SISTRIX package you have booked.
How to Create a New Report
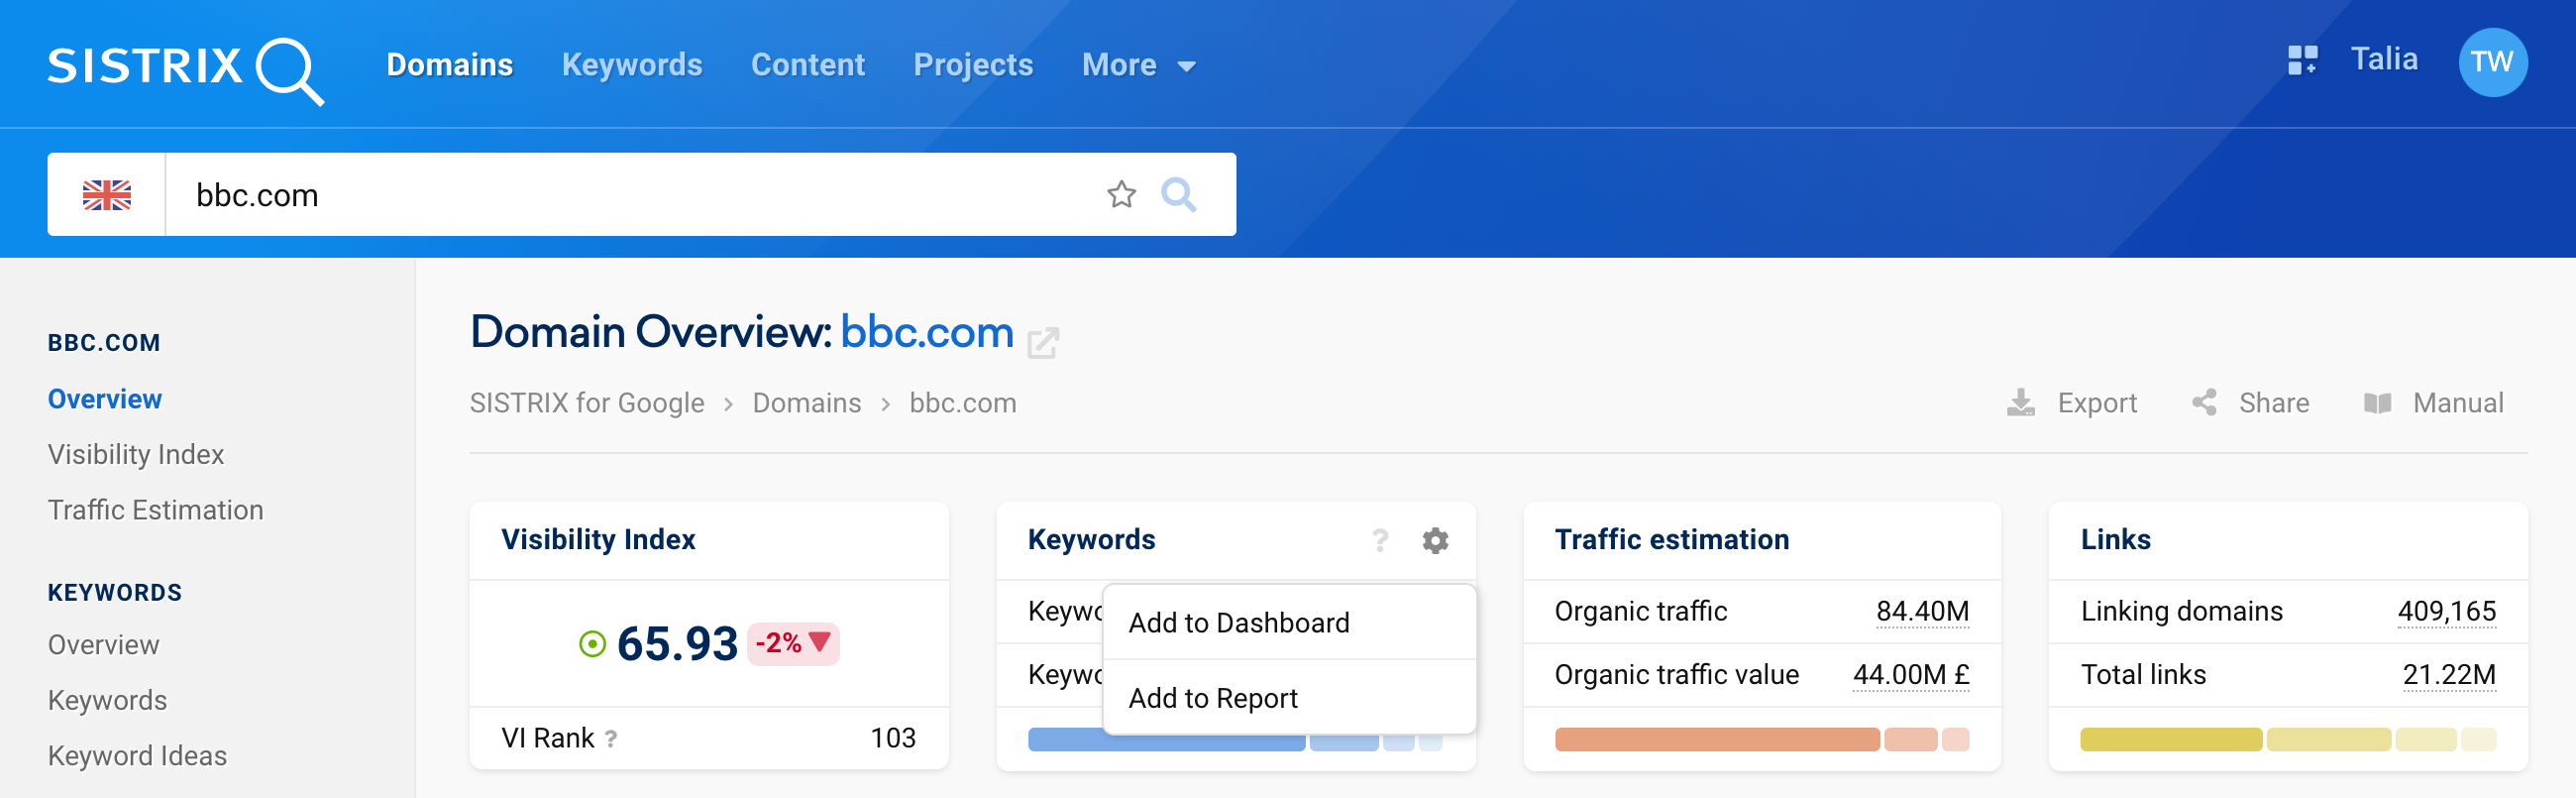
To add data boxes from SISTRIX to a report, you can start by typing the domain from which you want to have the data in the report into the search bar. You will reach the domain overview page 1.
Nearly every data box in SISTRIX can be added to a report or even a dashboard. Click on the gear icon in the upper right corner of the corresponding box to open the box options. Then just click on “Add to Report” 2.
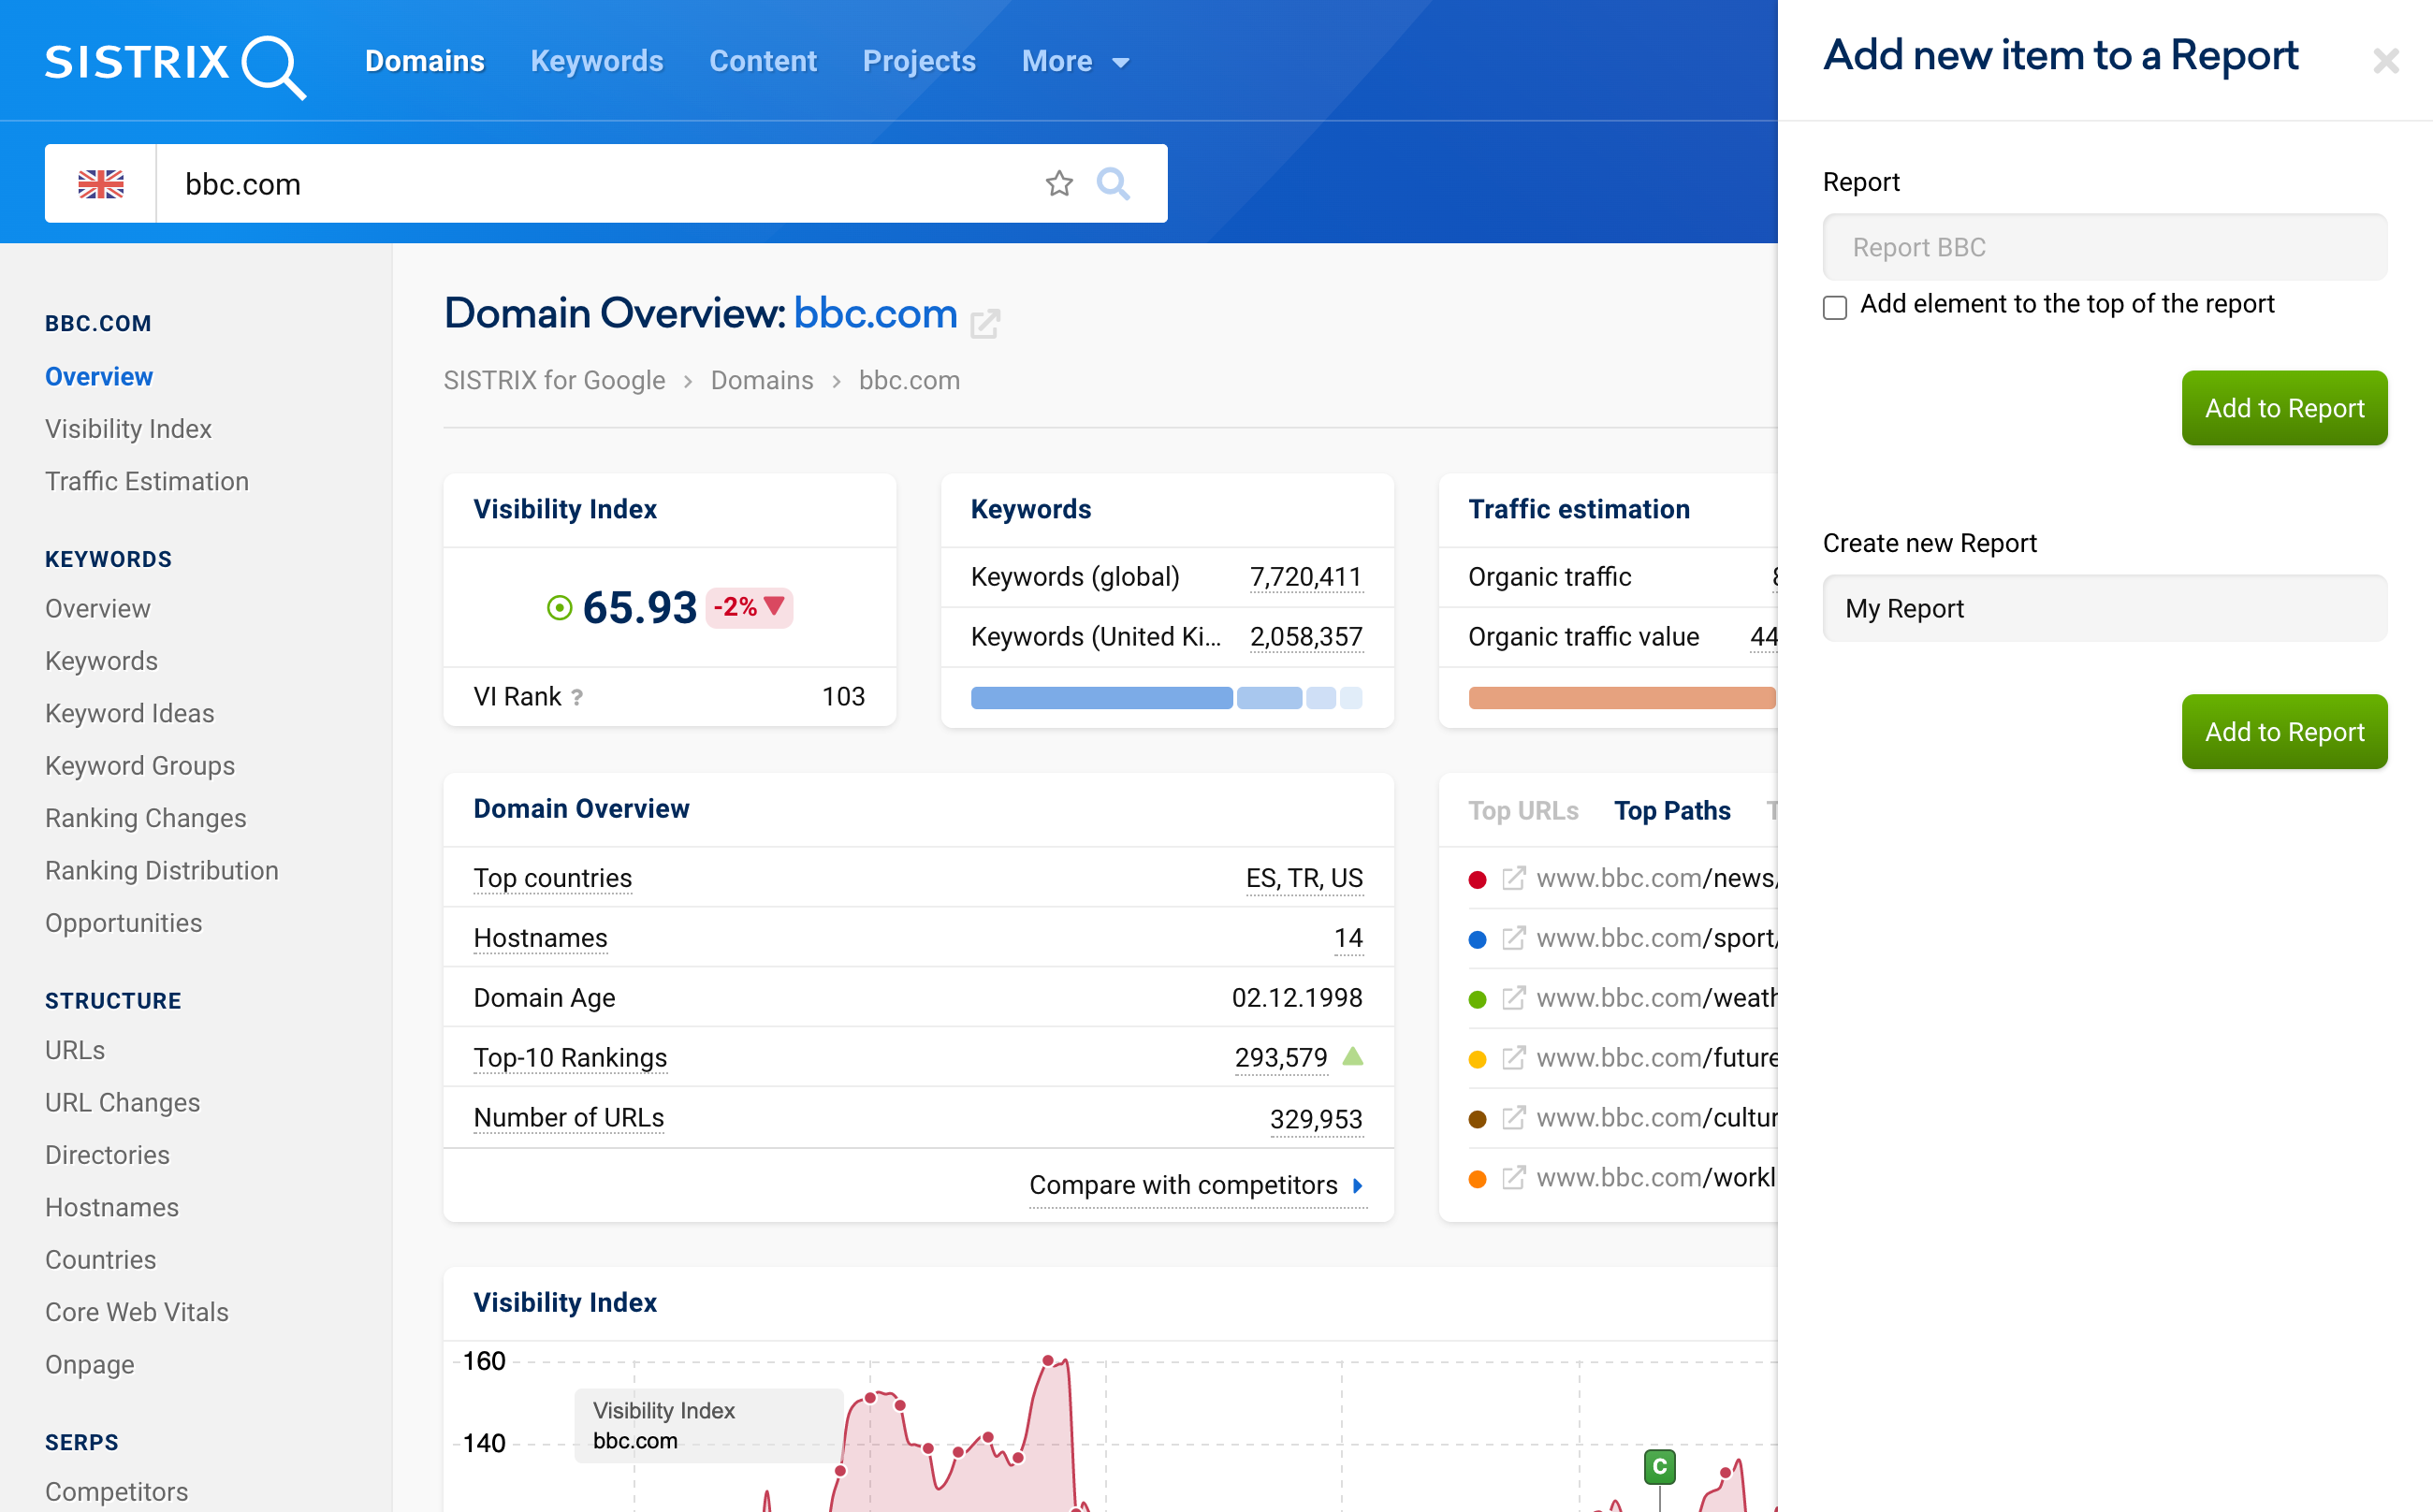
You will first be asked whether you want to add the data box to an existing report 3 or create a new report 4.
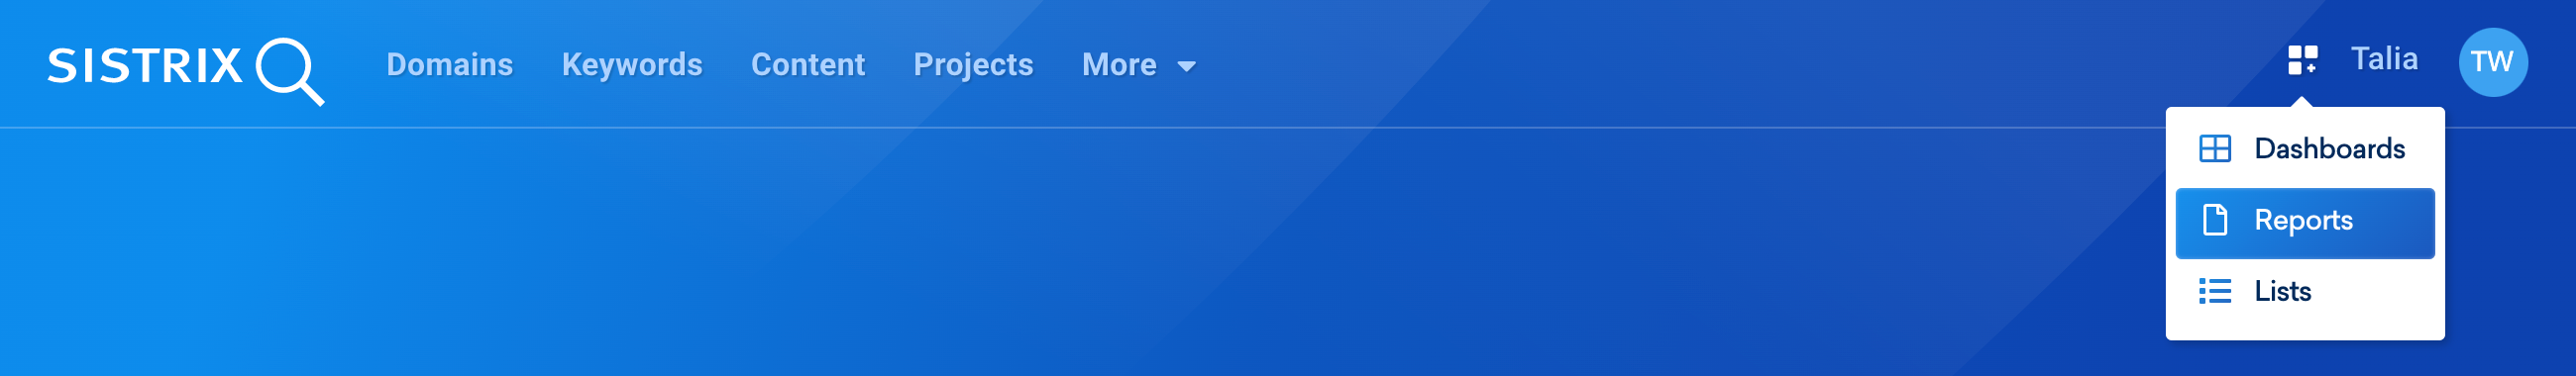
This is how you first proceed with all data boxes that you want to collect in your report. After adding all the boxes you need to the report, click on “Reports” in the upper navigation, right next to your profile name.
How to Customise a Report
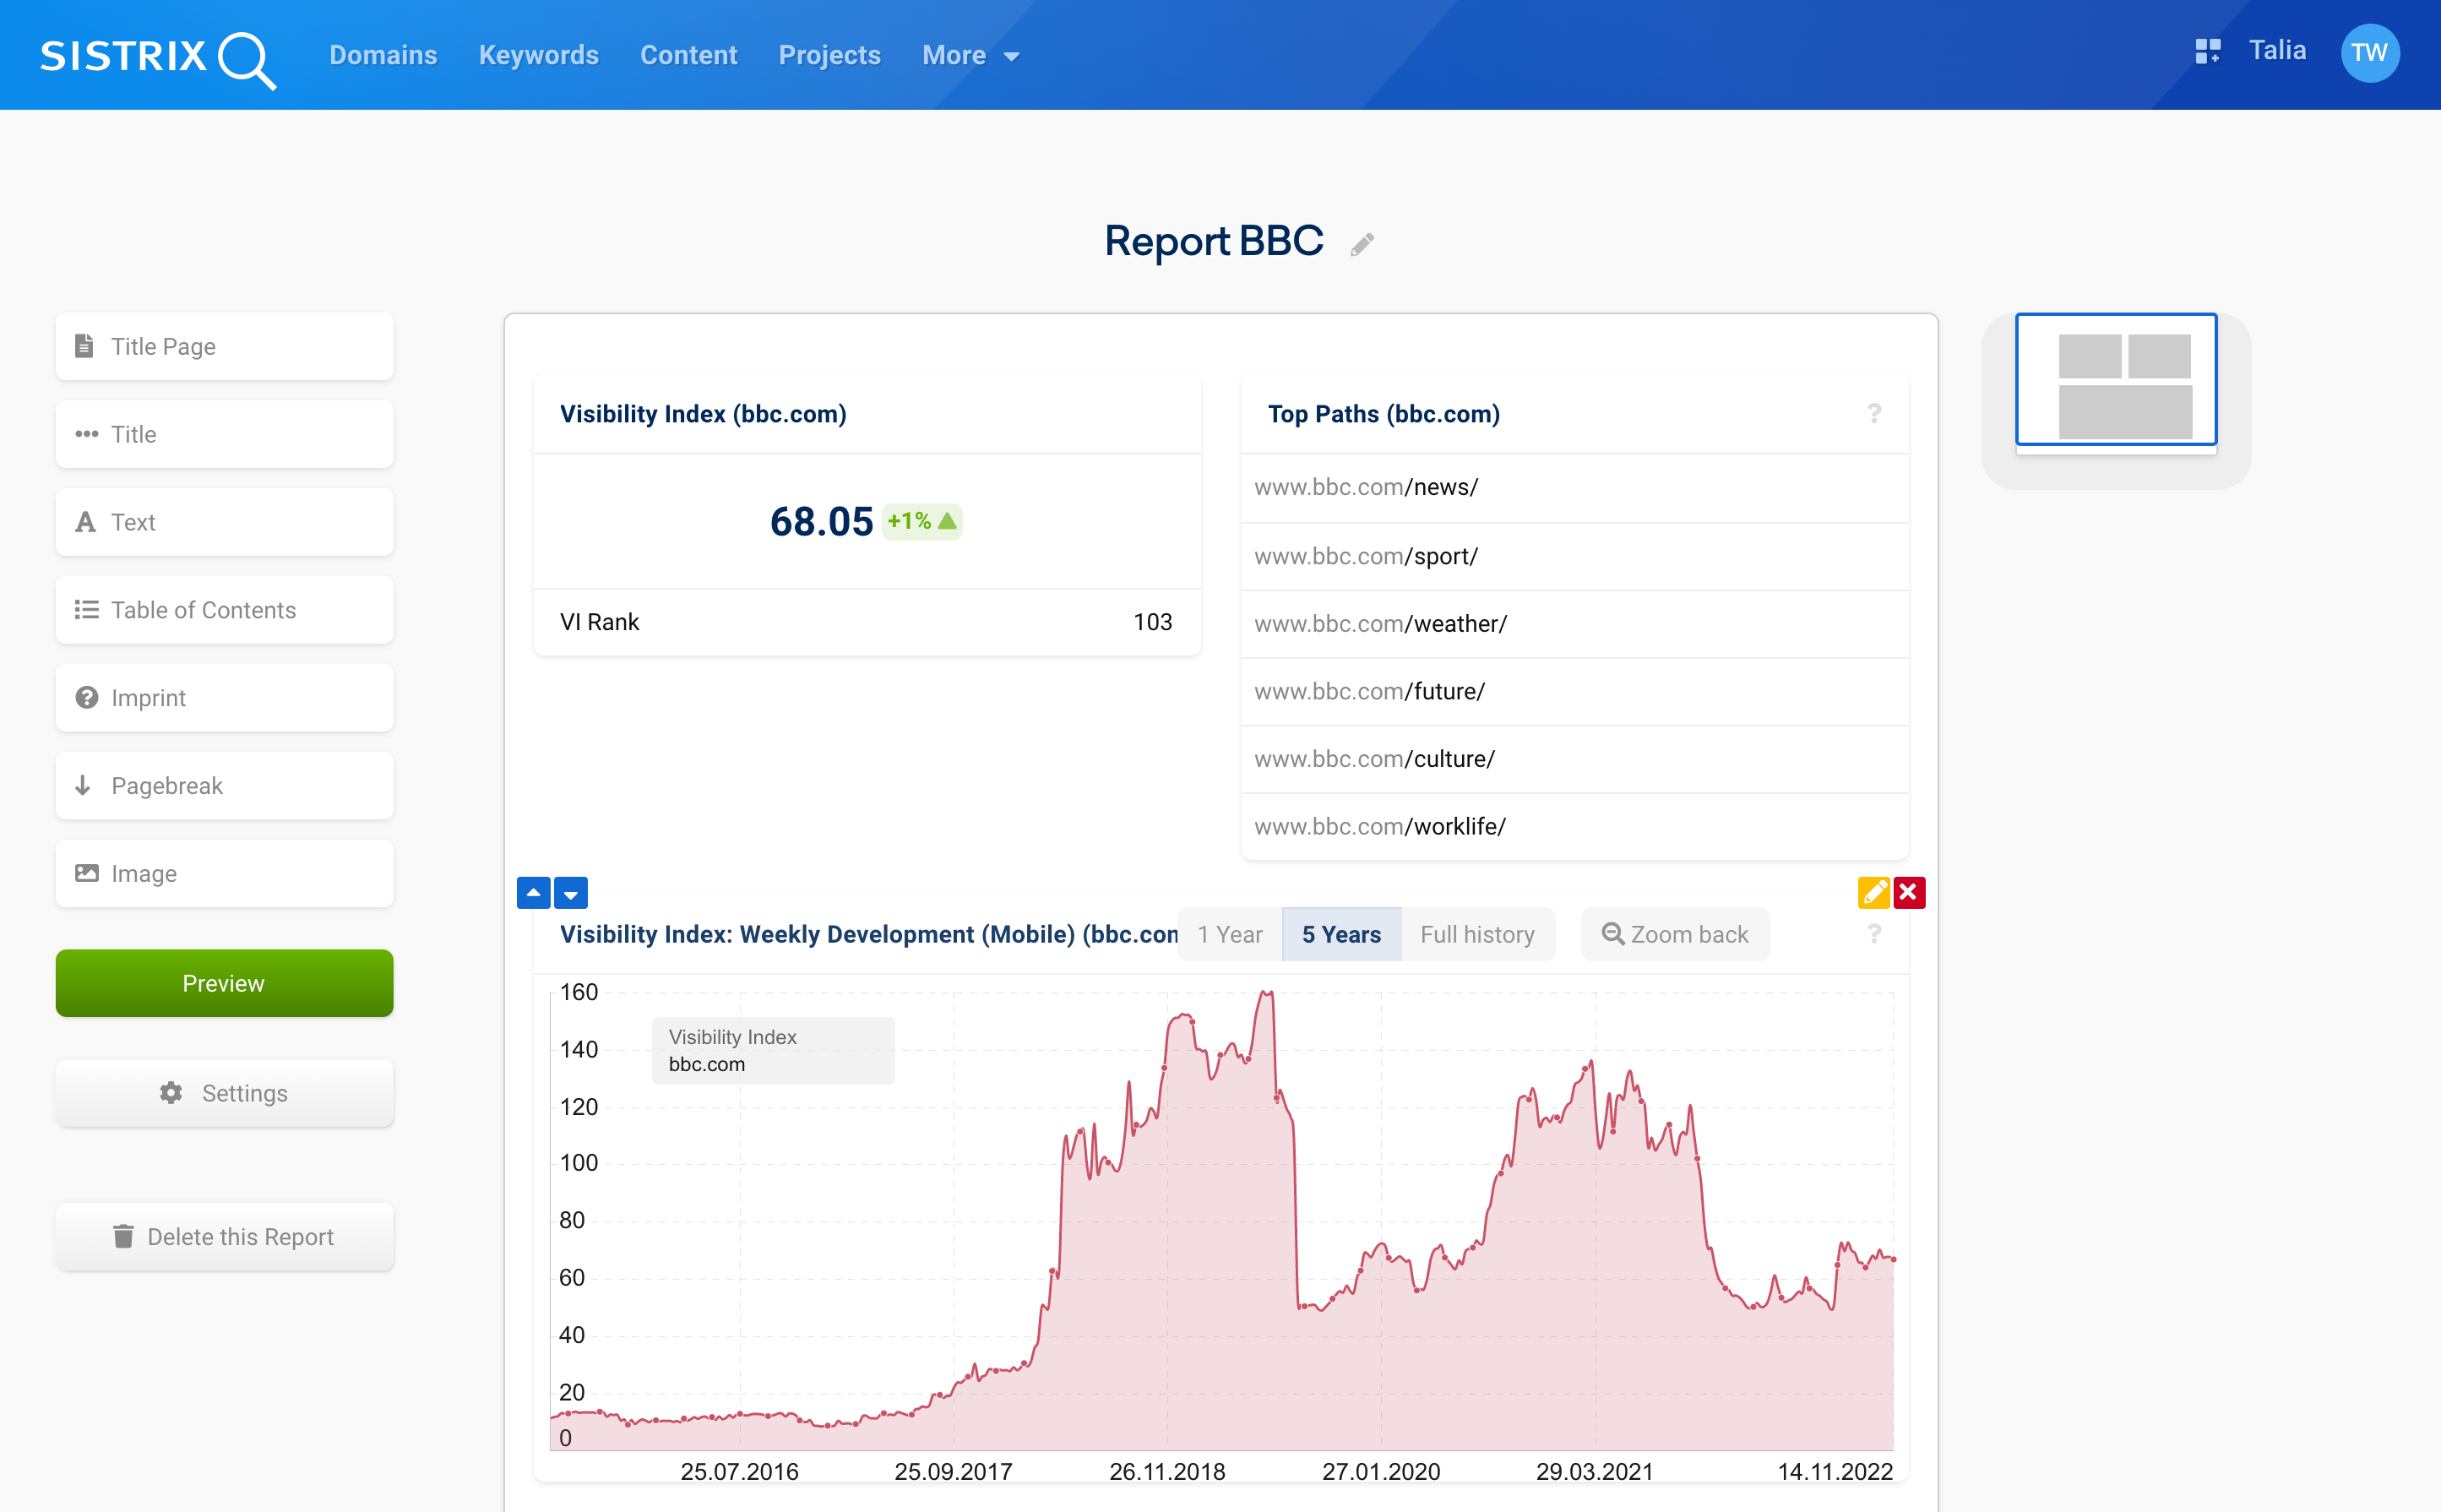
It’s time to customise the report you just created. The interface will show you all the data boxes you have added to the report in the middle, in the order you added them. You can simply move them around by dragging the box to where you want with your mouse or by clicking the arrows in the upper left corner of each box 1.
You can also give the box its own name and make certain settings for tables and histories by clicking on the yellow pencil in the upper right corner of the box. You can set the timeframe of a chart there, for example. The “x” deletes the data box. Both buttons can be found in the image above at 2.
Every report can have a maximum of 25 data boxes, which include uploaded images. You can add as many text boxes as you need. The data in the boxes always reflect the most current data we have.
To change the title of the report, simply click on it and edit it. On the left side you will also find the menu with which you can add text and style elements to the report in order to personalise it.
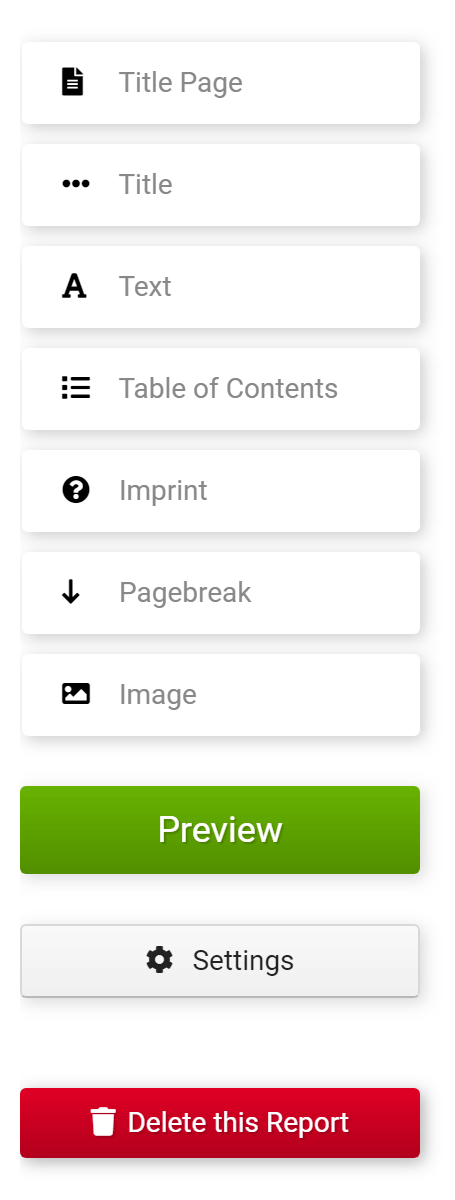
- Title Page: Adds a page with the title of the report and the current date.
- Title: Adds a headline to the report, which automatically shows up in the table of contents.
- Text: Adds a text box.
- Table of Contents: Automatically creates a table of contents from the headlines and data boxes.
- Imprint: Adds an imprint to the end of the report.
- Pagebreak: Adds a manual page break.
- Image: Upload an image to the report.
- Preview: Saves the report as a PDF file.
- Settings: Opens the settings for the report.
- Delete: Deletes the entire report.
If you want to download the report directly, open the preview of the report and click on the download symbol. An important feature of reports is the possibility to automatically send them as PDFs in certain intervals to selected e-mail addresses. To do this, simply add all e-mail addresses to “Receivers” in the settings. Then choose the frequency with which the e-mails should be sent – daily, weekly or monthly.
The profile that created the report will always be on the recipients list and cannot be removed.
The remaining settings are as follows:
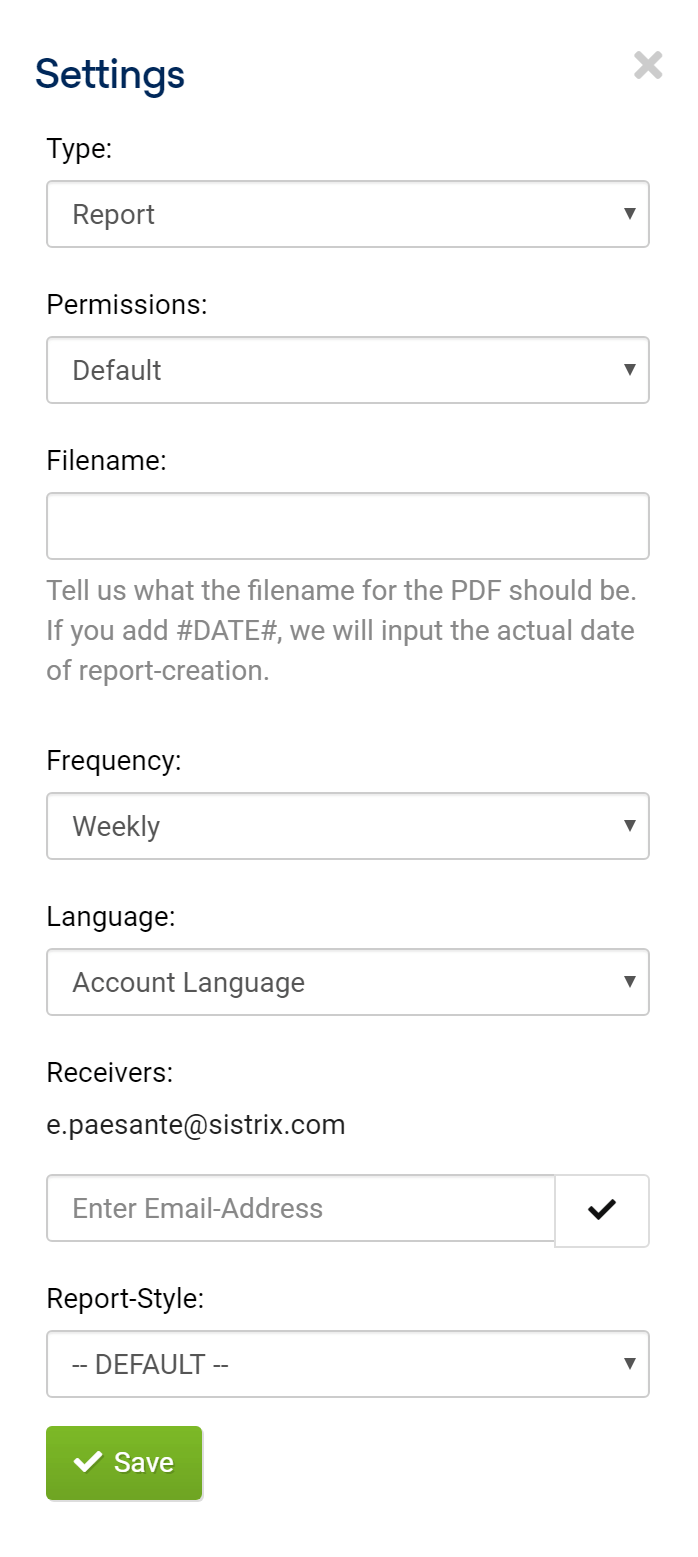
- A Change the report into a template.
- B Allow other profiles to edit the report.
- C Define the name of the PDF file.
- D Define how often the report should be sent.
- E Change the language for the box headings.
- F Select a design template design for the report.
You can use the following formatting options when creating text boxes:
[b]Text[/b] - formats the text in bold.
[u]Text[/u] - underlines the text.
[i]Text[/i] - formats the text in italics.
The changes to the report are saved automatically. You don’t have to keep reminding yourself to click on “Save”.
To delete the entire report, simply click on the button “Delete this Report”.
Creating Your Own Design Template
When we speak about reporting, every company has different needs: This is why SISTRIX allows you to create your own design template to use as a base for your reports.
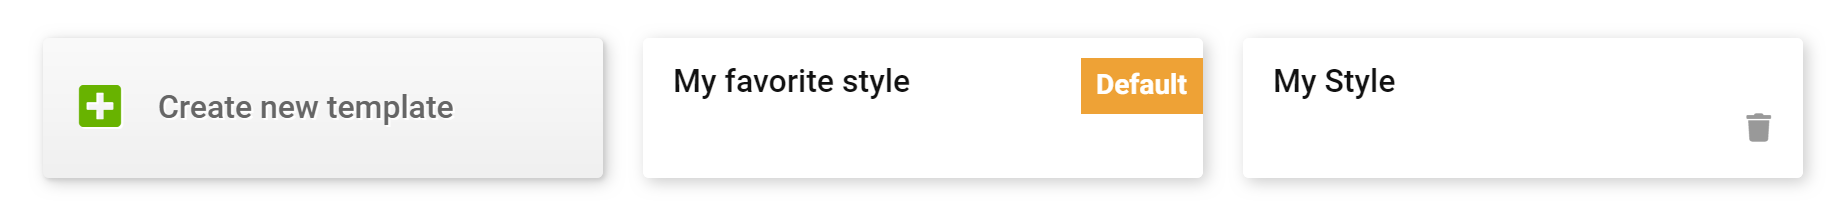
To create a new template, or to edit one that you have already created, scroll to the bottom of the report overview page.
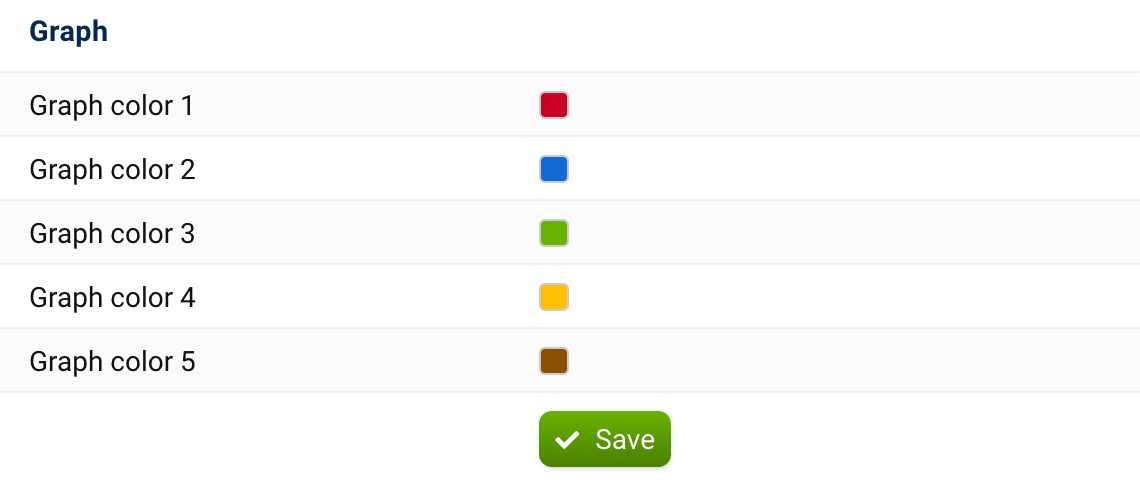
You can create a template which reflects your corporate design by changing the colours of the charts, for example.
To make colour changes, simply click on the colour field and enter the desired hexadecimal colour code. For example: #F3F3F3 for a light grey.
From the “Professional” package onwards, you can also use your own logo and add it to the reports. Simply upload your logo, select the page on which it should be displayed and save. The logo may be uploaded in all common formats, like JPG, GIF or PNG.
You can also configure a personal footer for your reports, which will be shown on all pages.
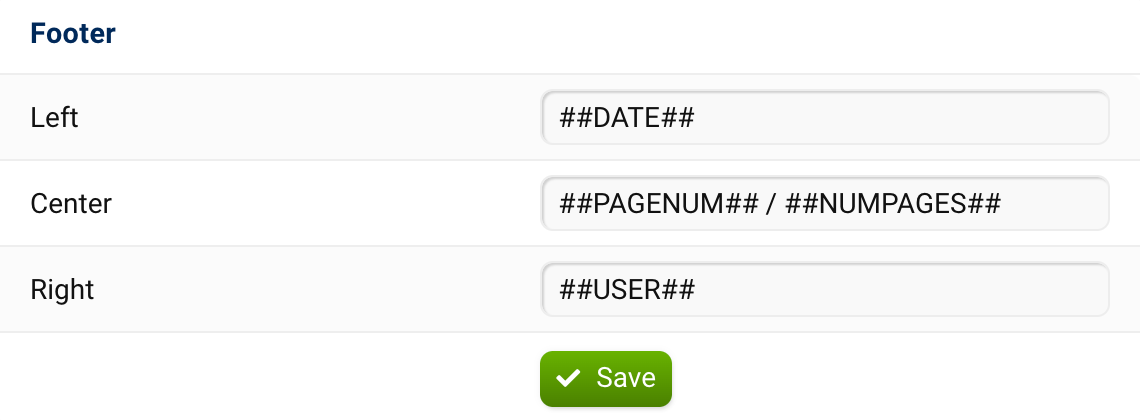
The following placeholders can be used for the footer. Please note that the placeholders must be written exactly as they appear below, with ## and fully capitalised:
- ##DATE## – Inserts the current date.
- ##PAGENUM## – Displays the current page number.
- ##NUMPAGES## – Display the total number of pages in the report.
- ##USER## – Displays the email address of the profile that created the report.
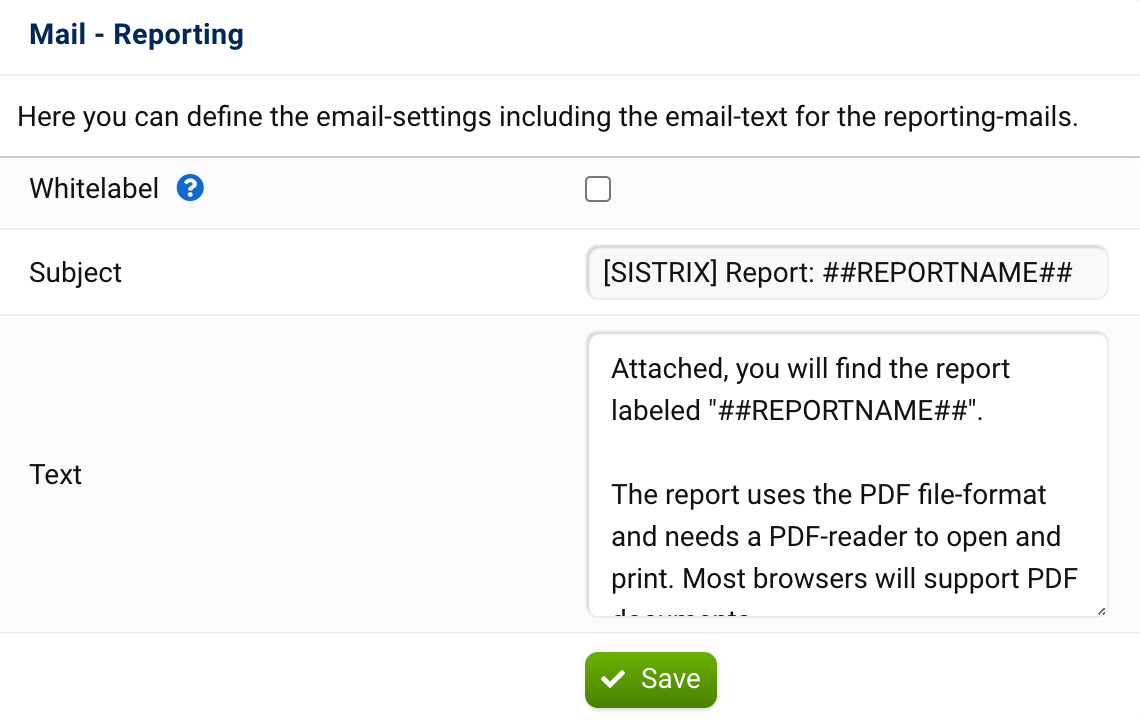
At the bottom of the design template, you can customise the text of the e-mail to which the report will be attached.
Once you have created a design template, you can select and use it in the report settings shown above at F.
How to Use Report Templates
You can create a template not only for the design of a report. Once you have put together a report with the data boxes for a domain the way you want it, you can also decide to use this report as a template for other domains.
In the settings for the report, the type can be found above at A. If this is changed to Report Template, the exact composition of this report is created as a template.
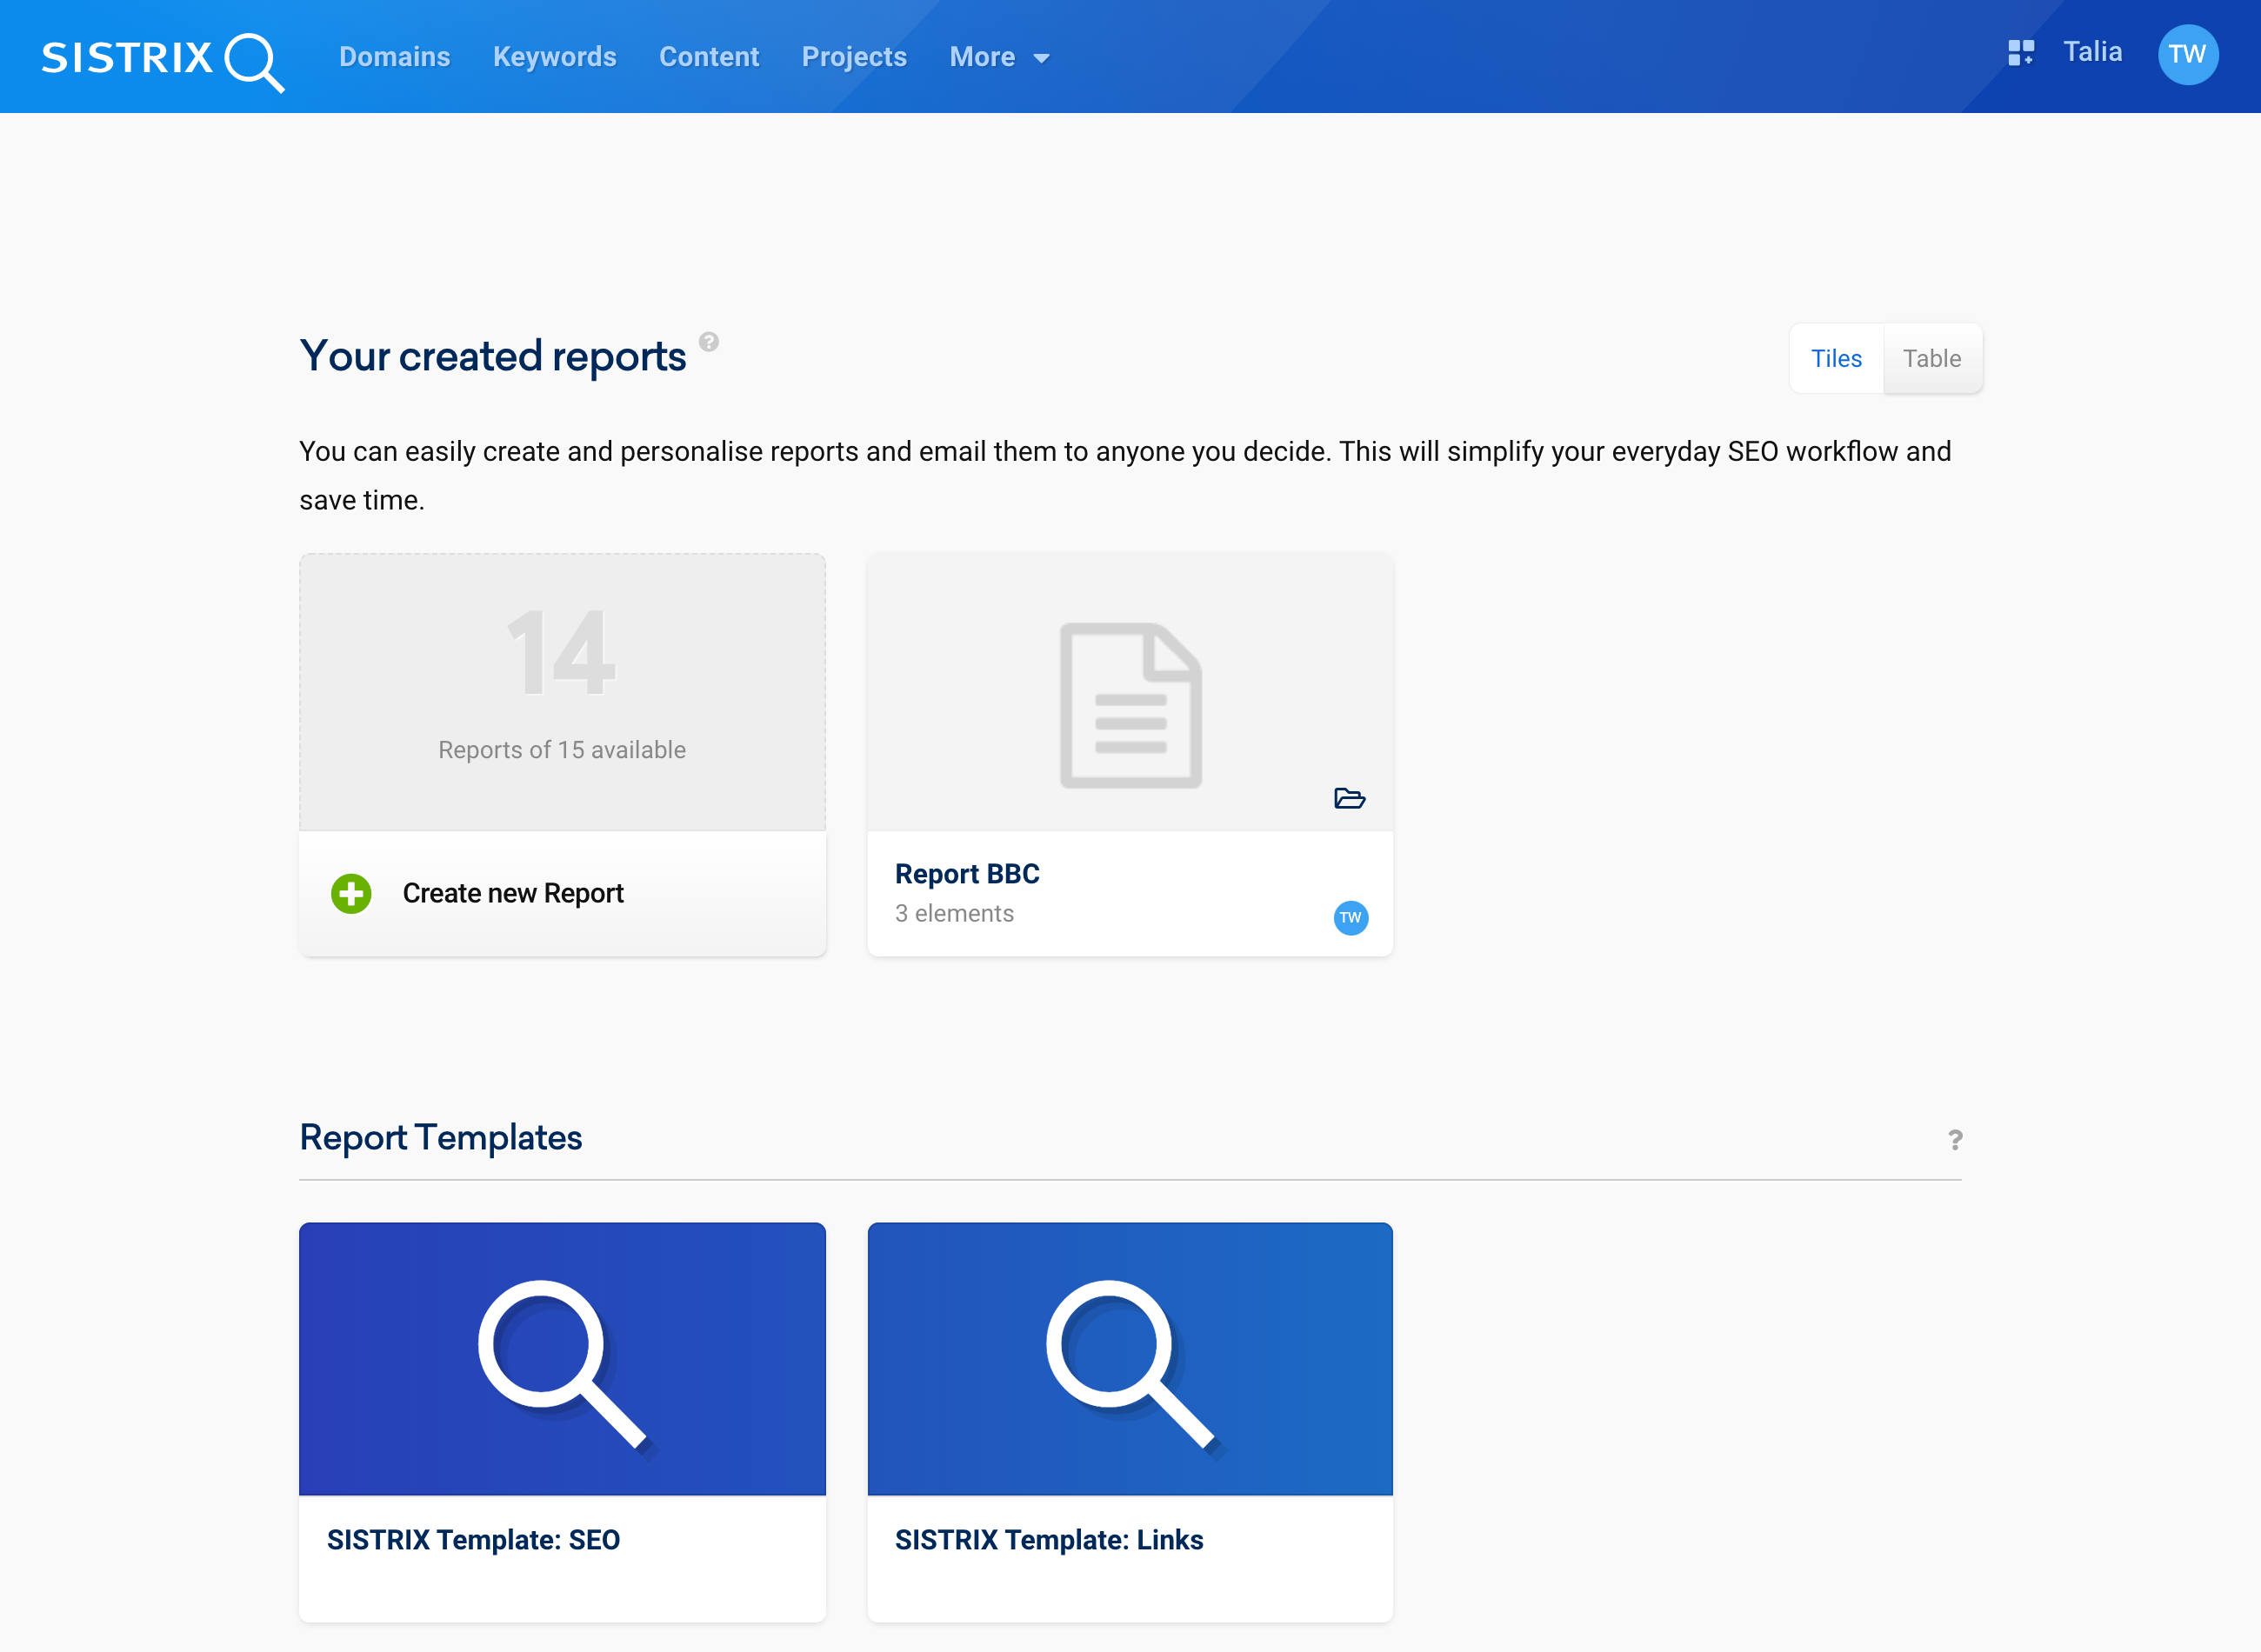
The report templates can be found on the report overview page (via the top navigation, if you click on “Reports” next to your profile name) under the reports and above the design templates, in the image above at 1. You can create up to 5 of your own templates. In addition, there are two sample templates for SEO and links that are always available.
To create a report using a report template, click on the corresponding template. A new window will open in which you can see the structure of the report template again.
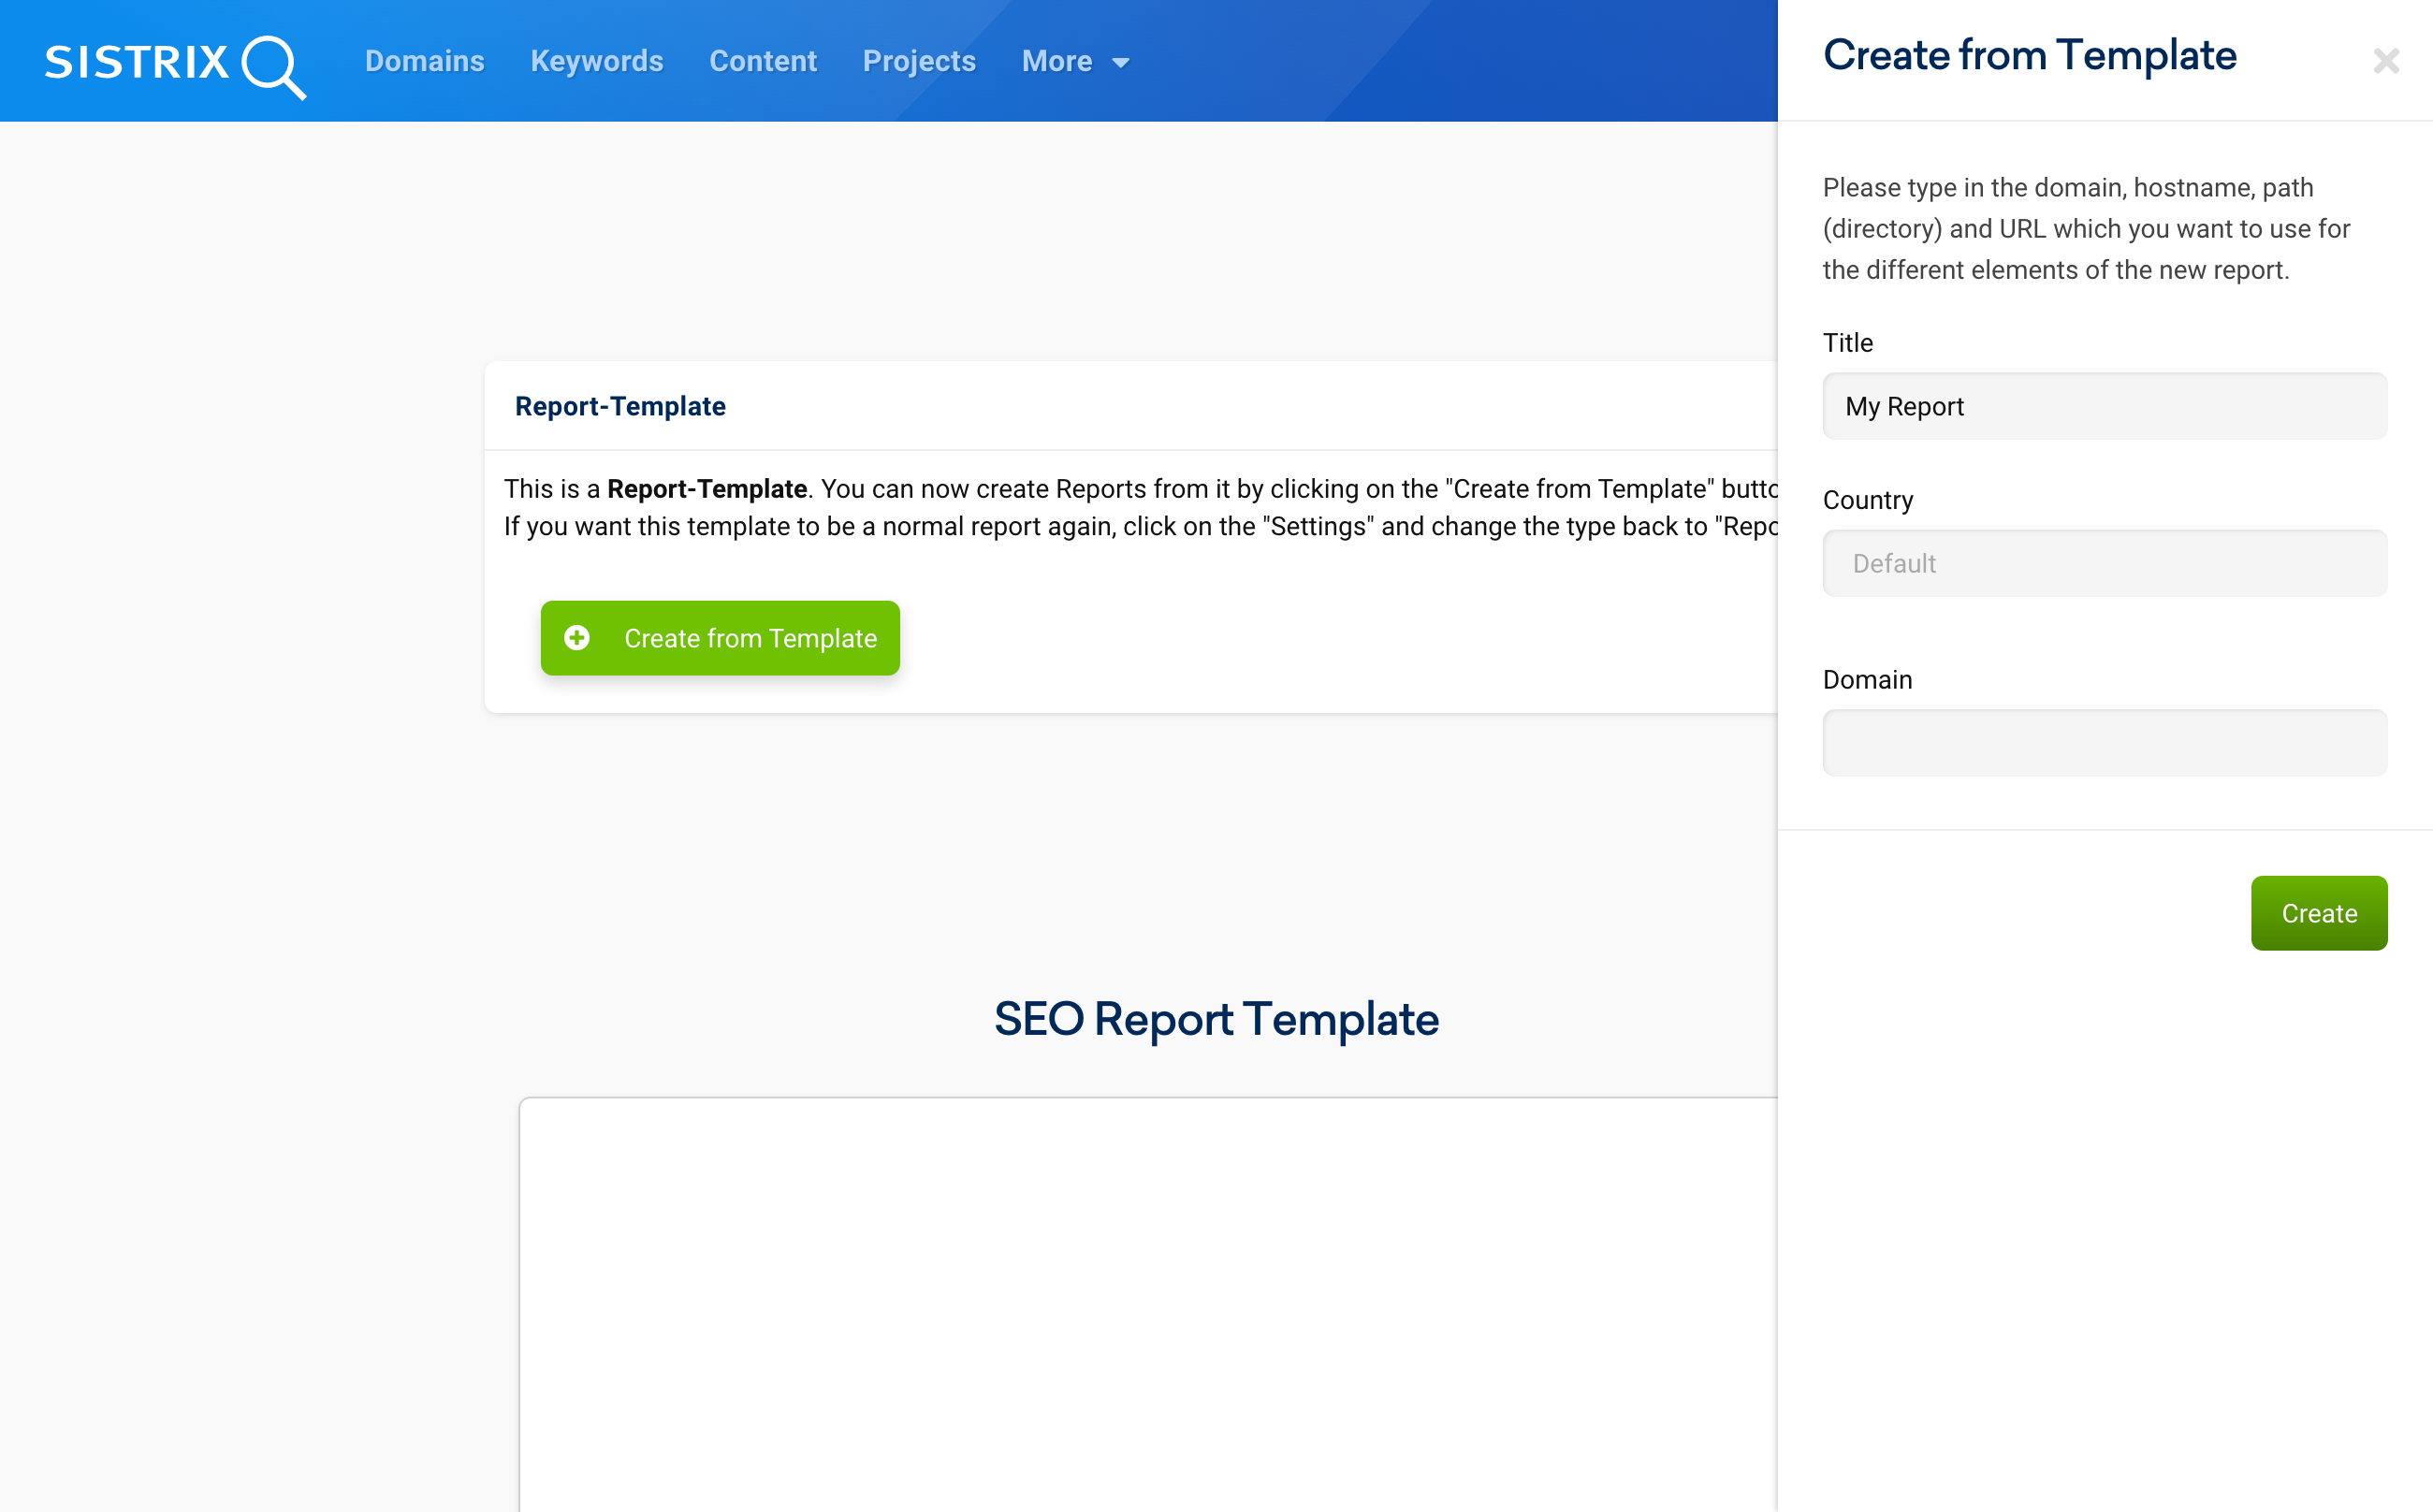
At the top there is an info box for the template and a button “Create from Template”, in the image above at 2. If you click on the button, you have the option to enter a new name for the report at 3, select the country from which the data was collected at 4, and enter the domain for which the report is to be created at 5. Click on the green button “Create” to create a new report based on this template.
Archive
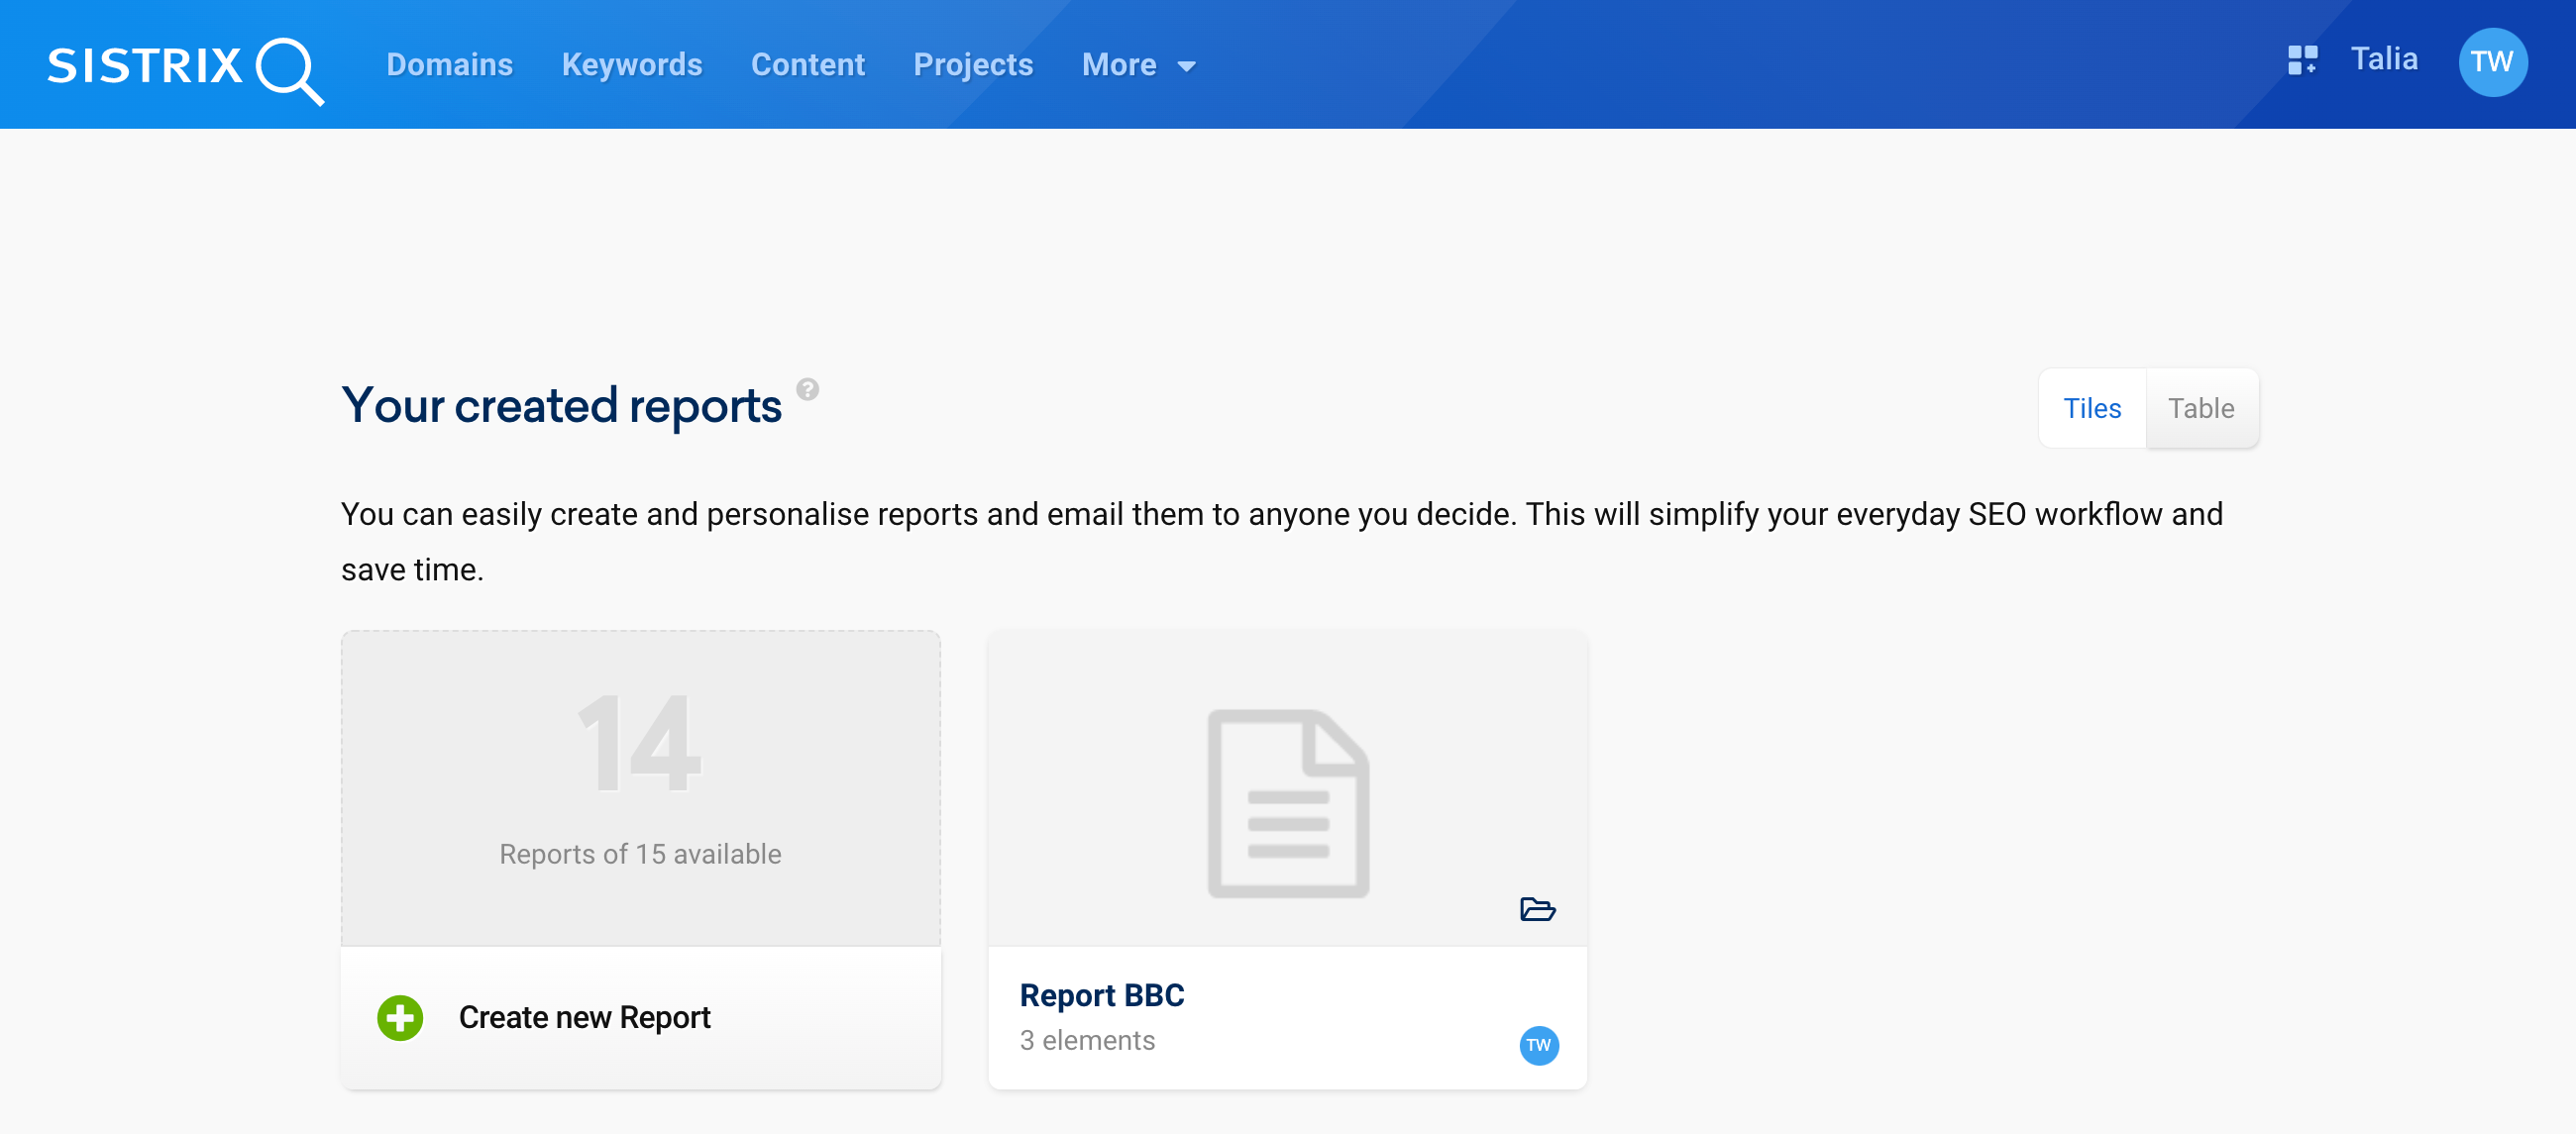
If you open the report overview via the top navigation by clicking on “Reports” next to your profile name, the reports you have created will appear at the top. You can open the respective report archive by clicking on the folder symbol on each report, in the image above at 1.
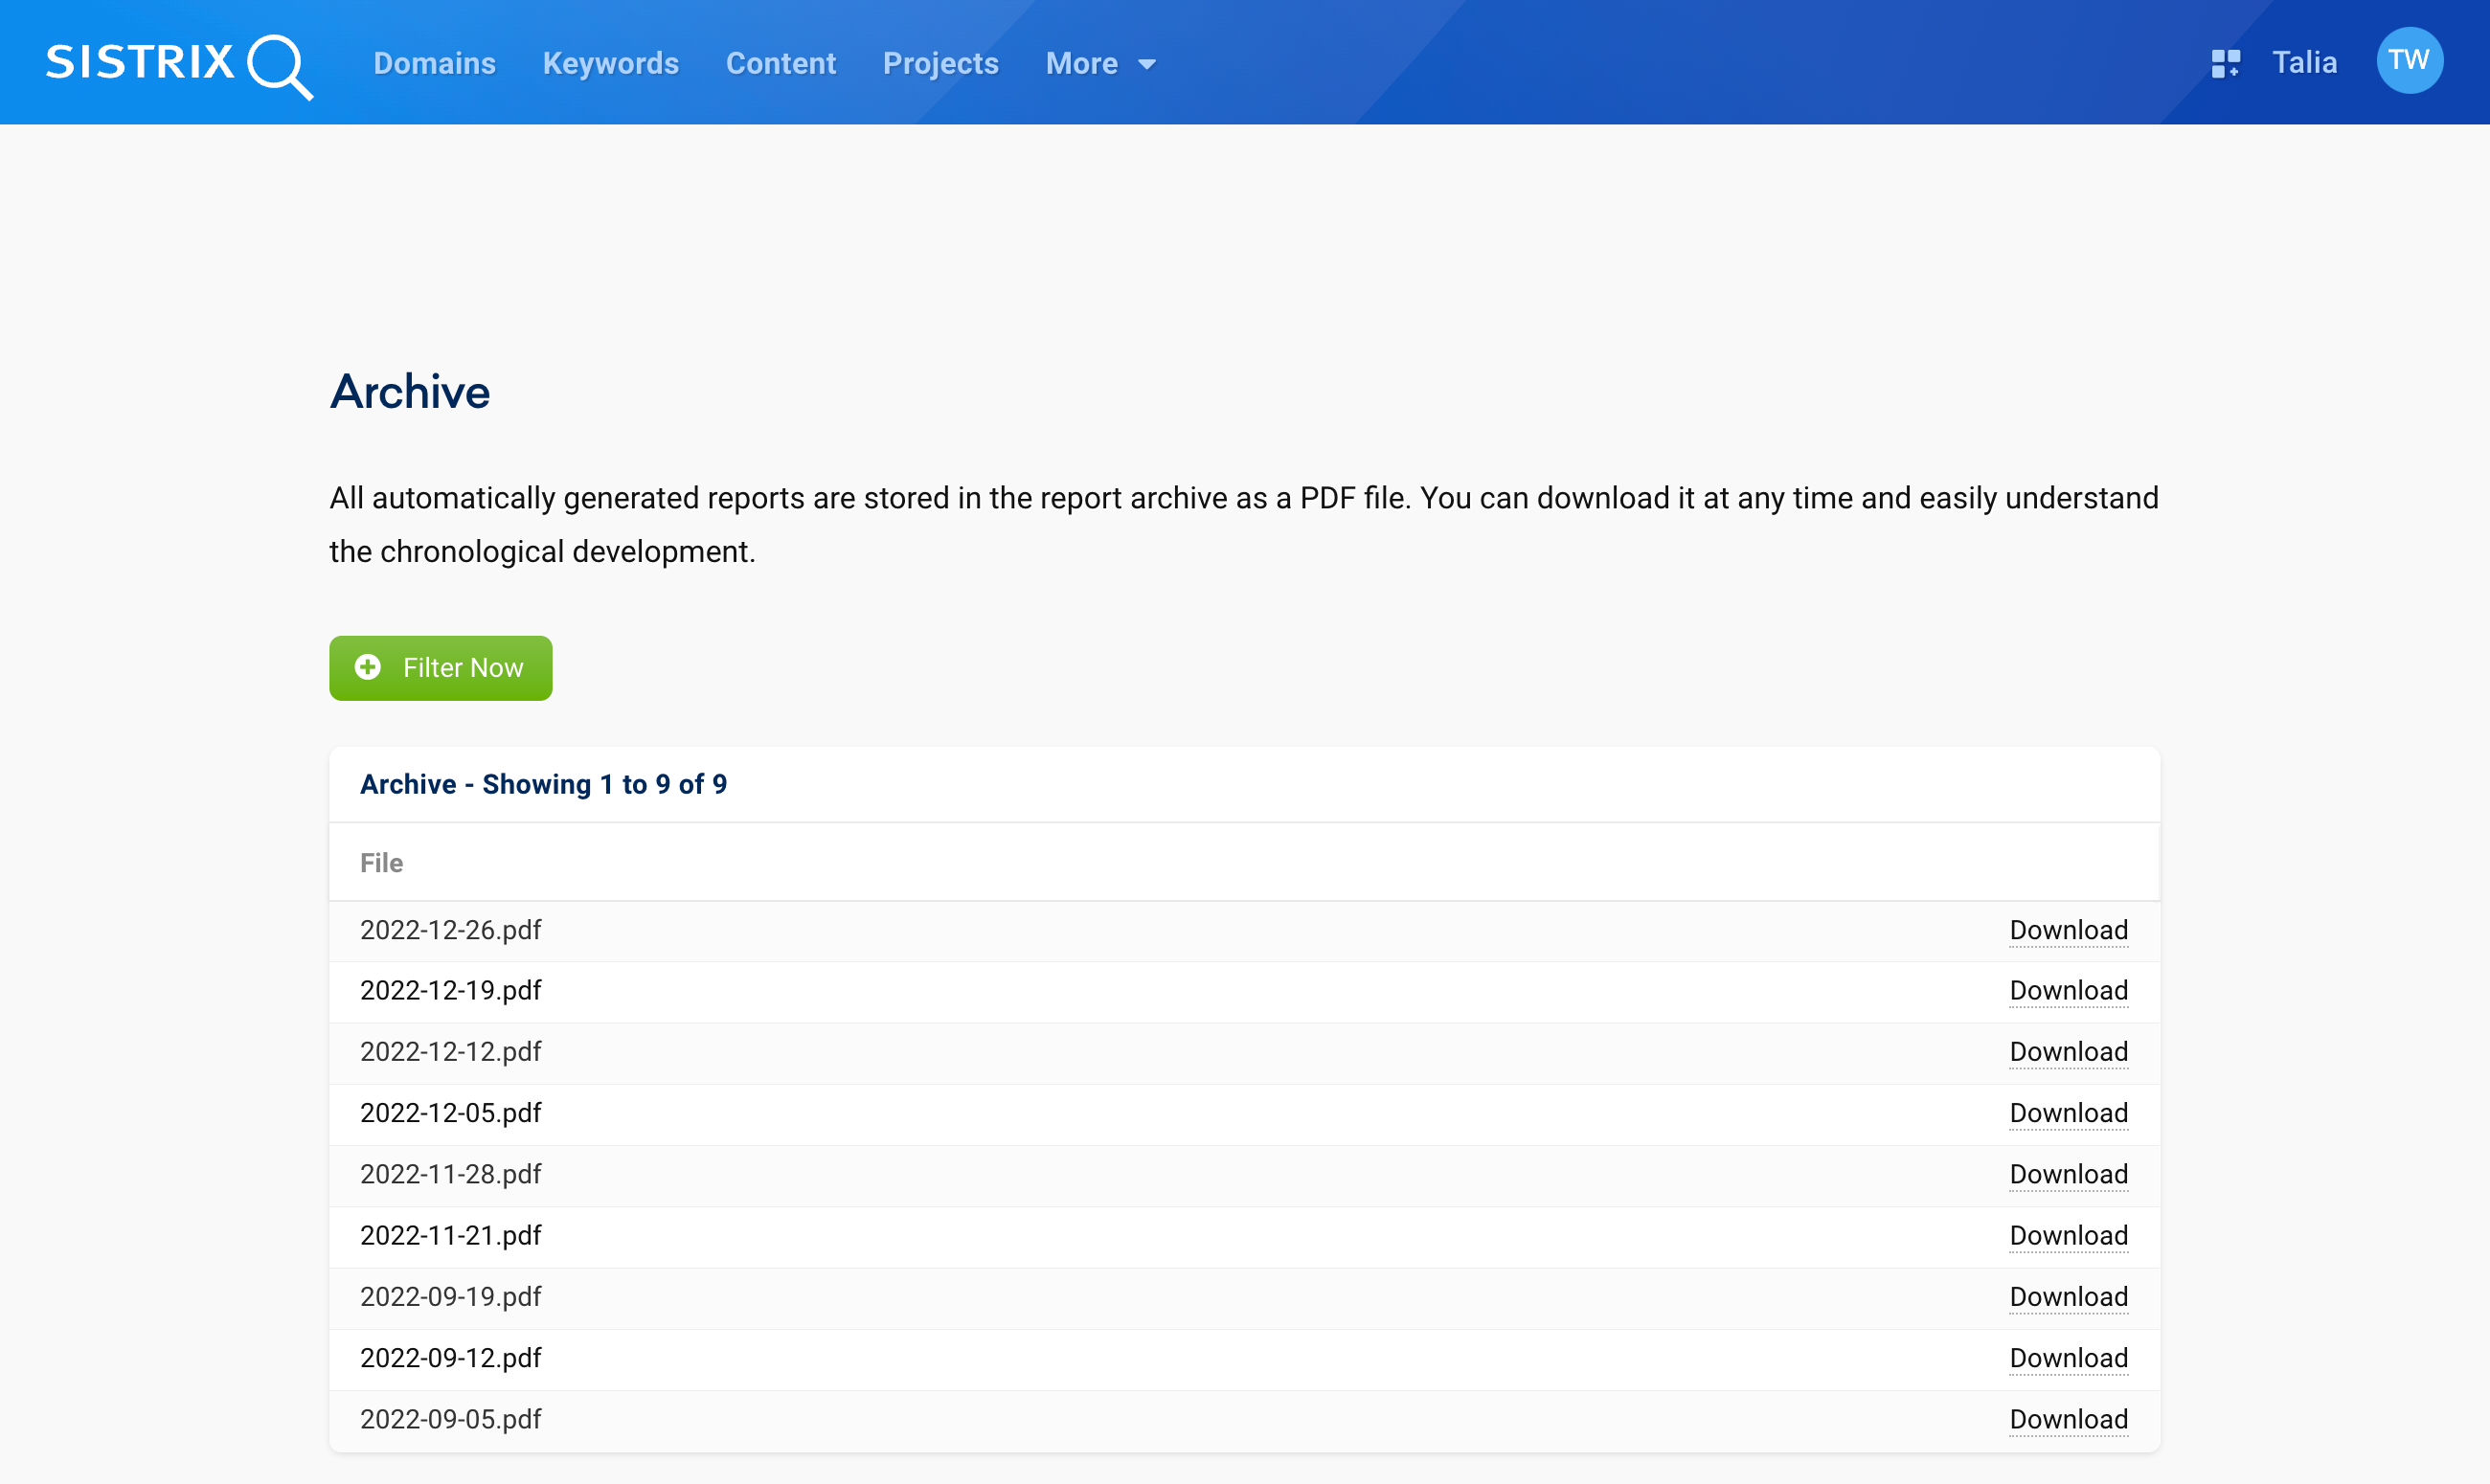
All reports created are archived there as PDF files. This way, you no longer have to save the reports yourself.
You can access the archive at any time and view reports from the past whenever you need them.
How often a report is saved in the archive depends on the report settings. You can create reports daily, weekly or even monthly.
Conclusion
Reports allow you to analyse, control and evaluate your SEO measures over time with the help of reliable data.
You can also save time by creating report templates from reports and using these to create reports for other domains. This way, you can always automatically provide all stakeholders with exactly the information they need.