
Social Signals have gained an increasing significance for online marketing over the past years – they are signals that, to an extent, provide a measurable value for the range a website has on social networks like Facebook, Pinterest & Co. With the SISTRIX Toolbox you can analyse the activities on the most important networks and use this data for a variety of applications.
Starting out
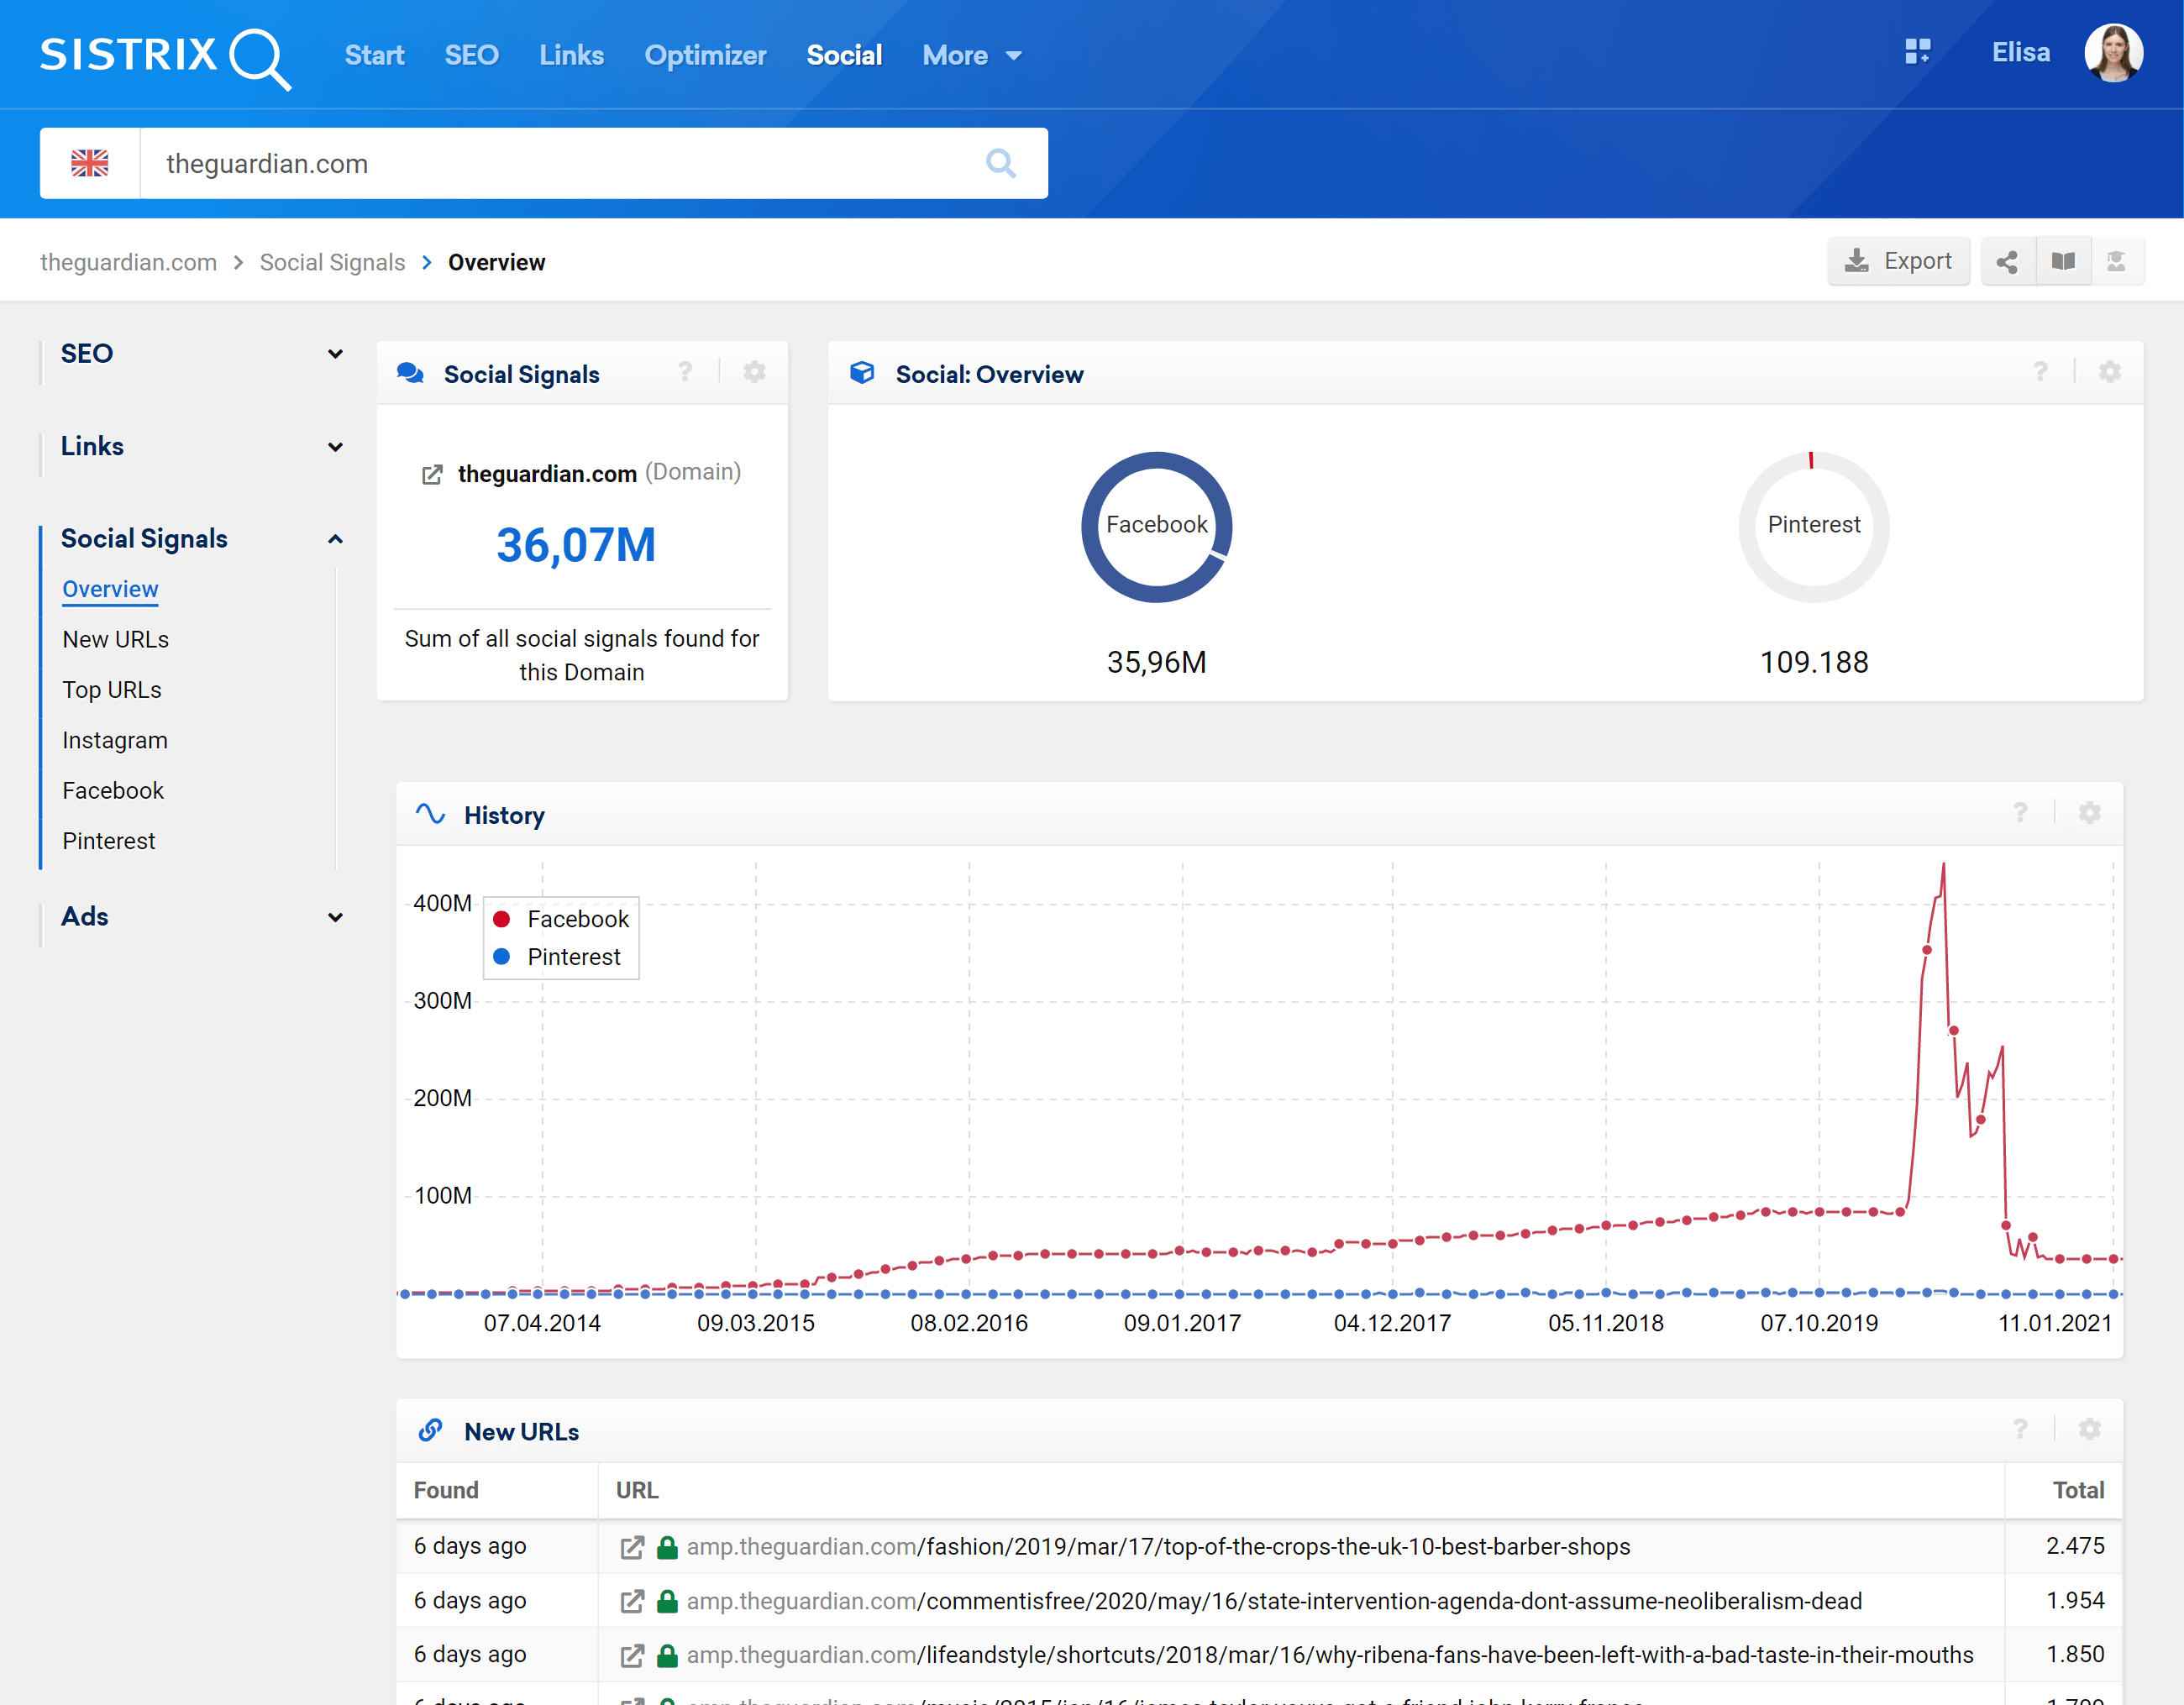
After you login in to the SISTRIX Toolbox, please type a domain into the search bar. Afterwards, click on the “Social-Signals > Overview” in the left hand navigation. You are now on the overview of the Social Module for the domain you are looking at and can get a first impression on the activities are distributed along the different networks.
In the course of the overview page you can find the the Social Signals history for the domain.
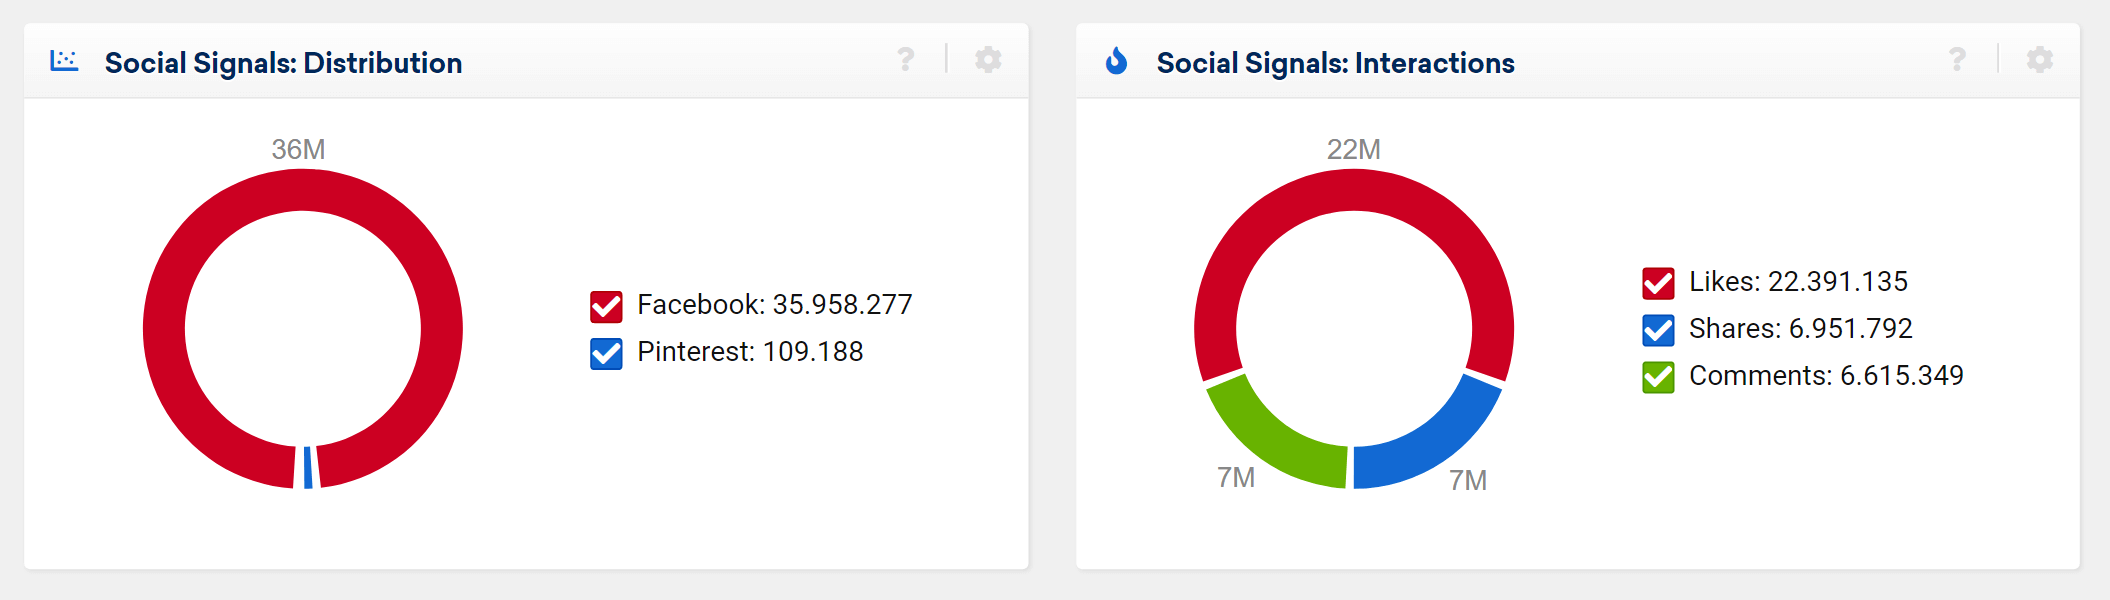
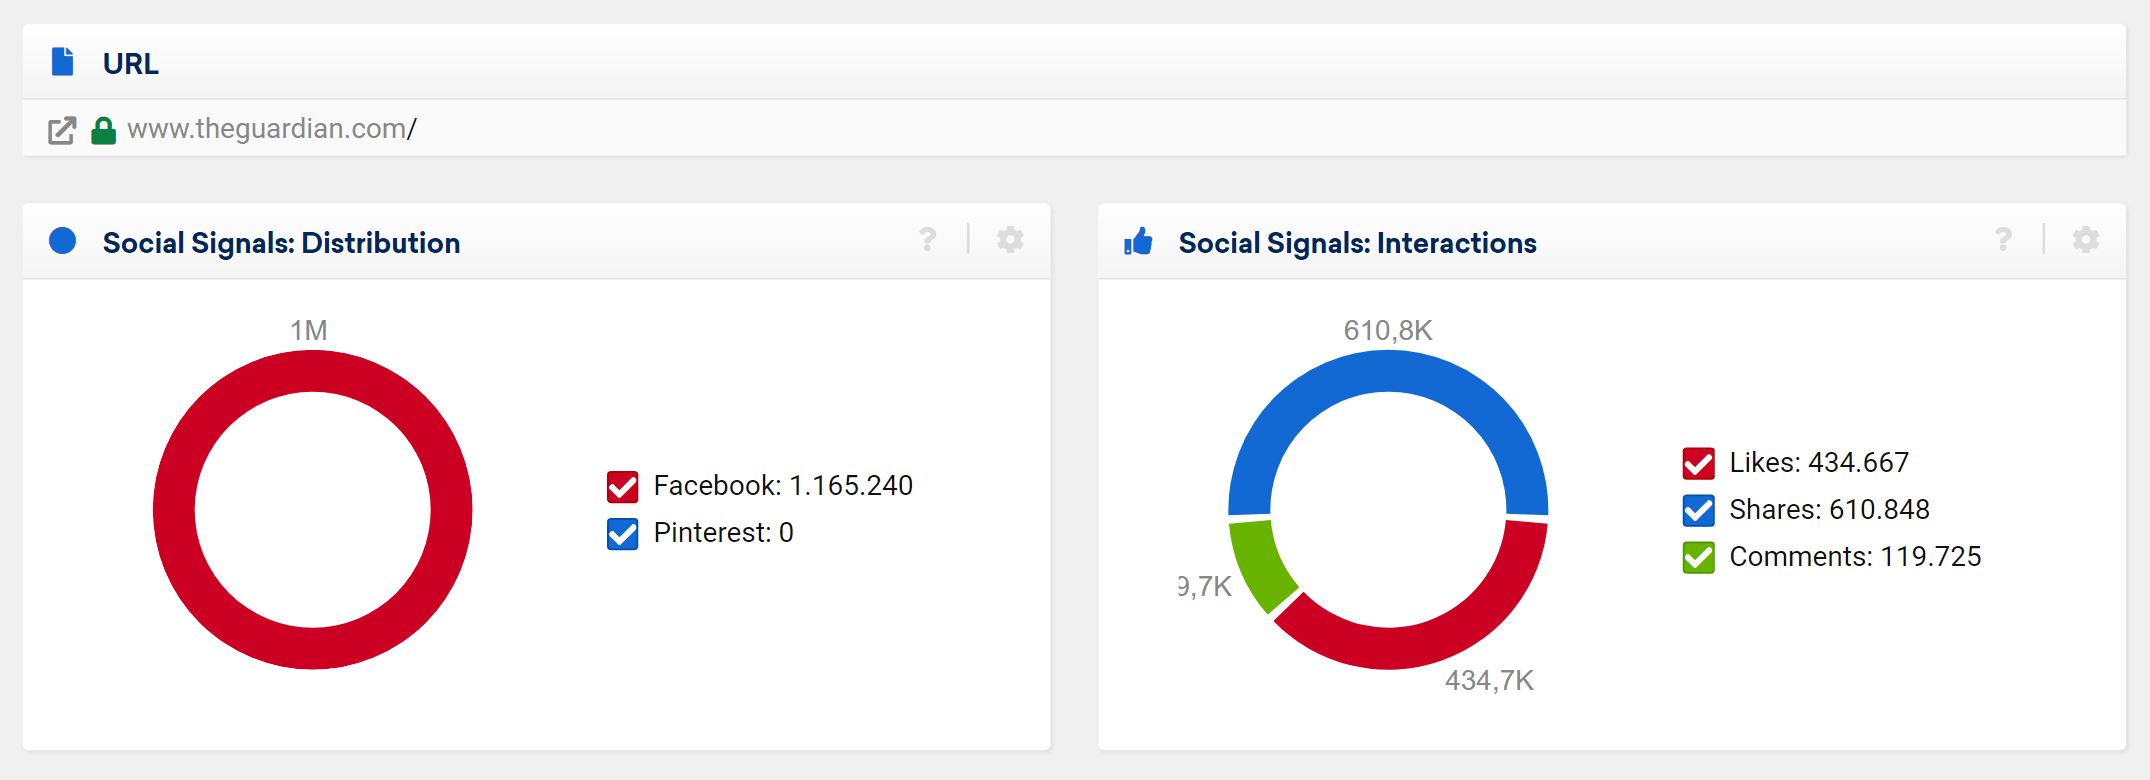
Below are two pie charts on the distribution of data on the different networks and by the type of interactions.
The first box indictaes that The Guardian is strongly geared towards Facebook. From the second box we can see an overview of the number of likes, shares and comments it gets.
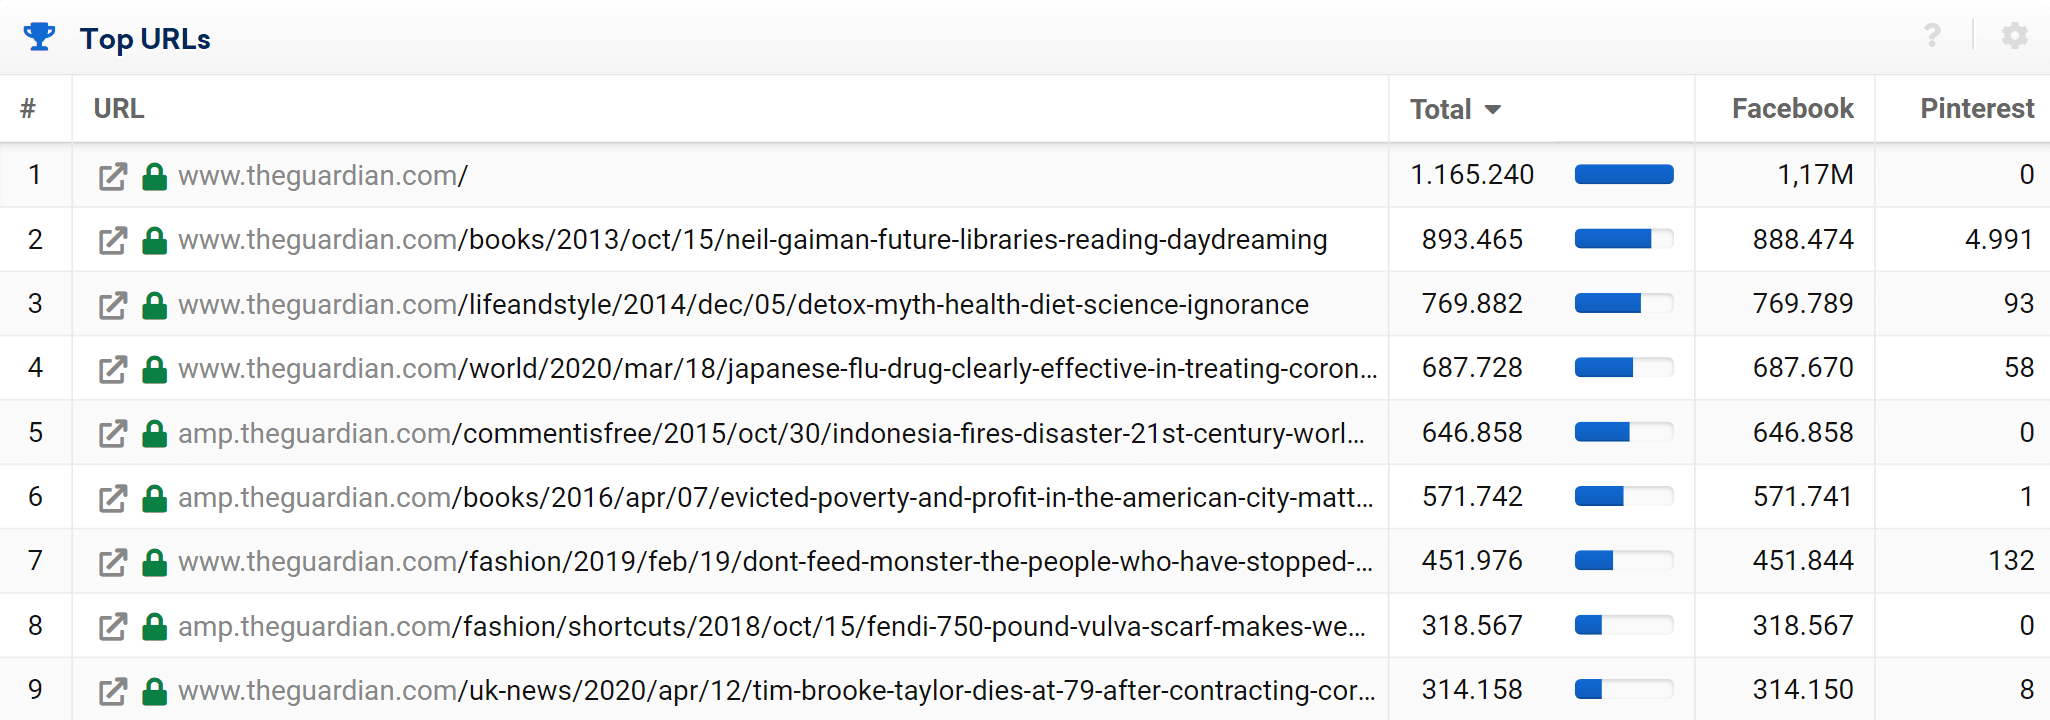
We also provide you with an extract from the top URLs in the next table.
You can take a closer look at this data for each network in the left hand navigation. In the overview the numbers for all networks are summed up, giving you a direct overview of the most “discussed” contents (in absolute terms) on social networks.
As you have probably already noticed, The Guardian is relatively inactive on Pinterest. Information like this is quickly gained by using the Social Signals module and you should always have a look at this module for your competitors‘ domains as well.
Analysing URL details
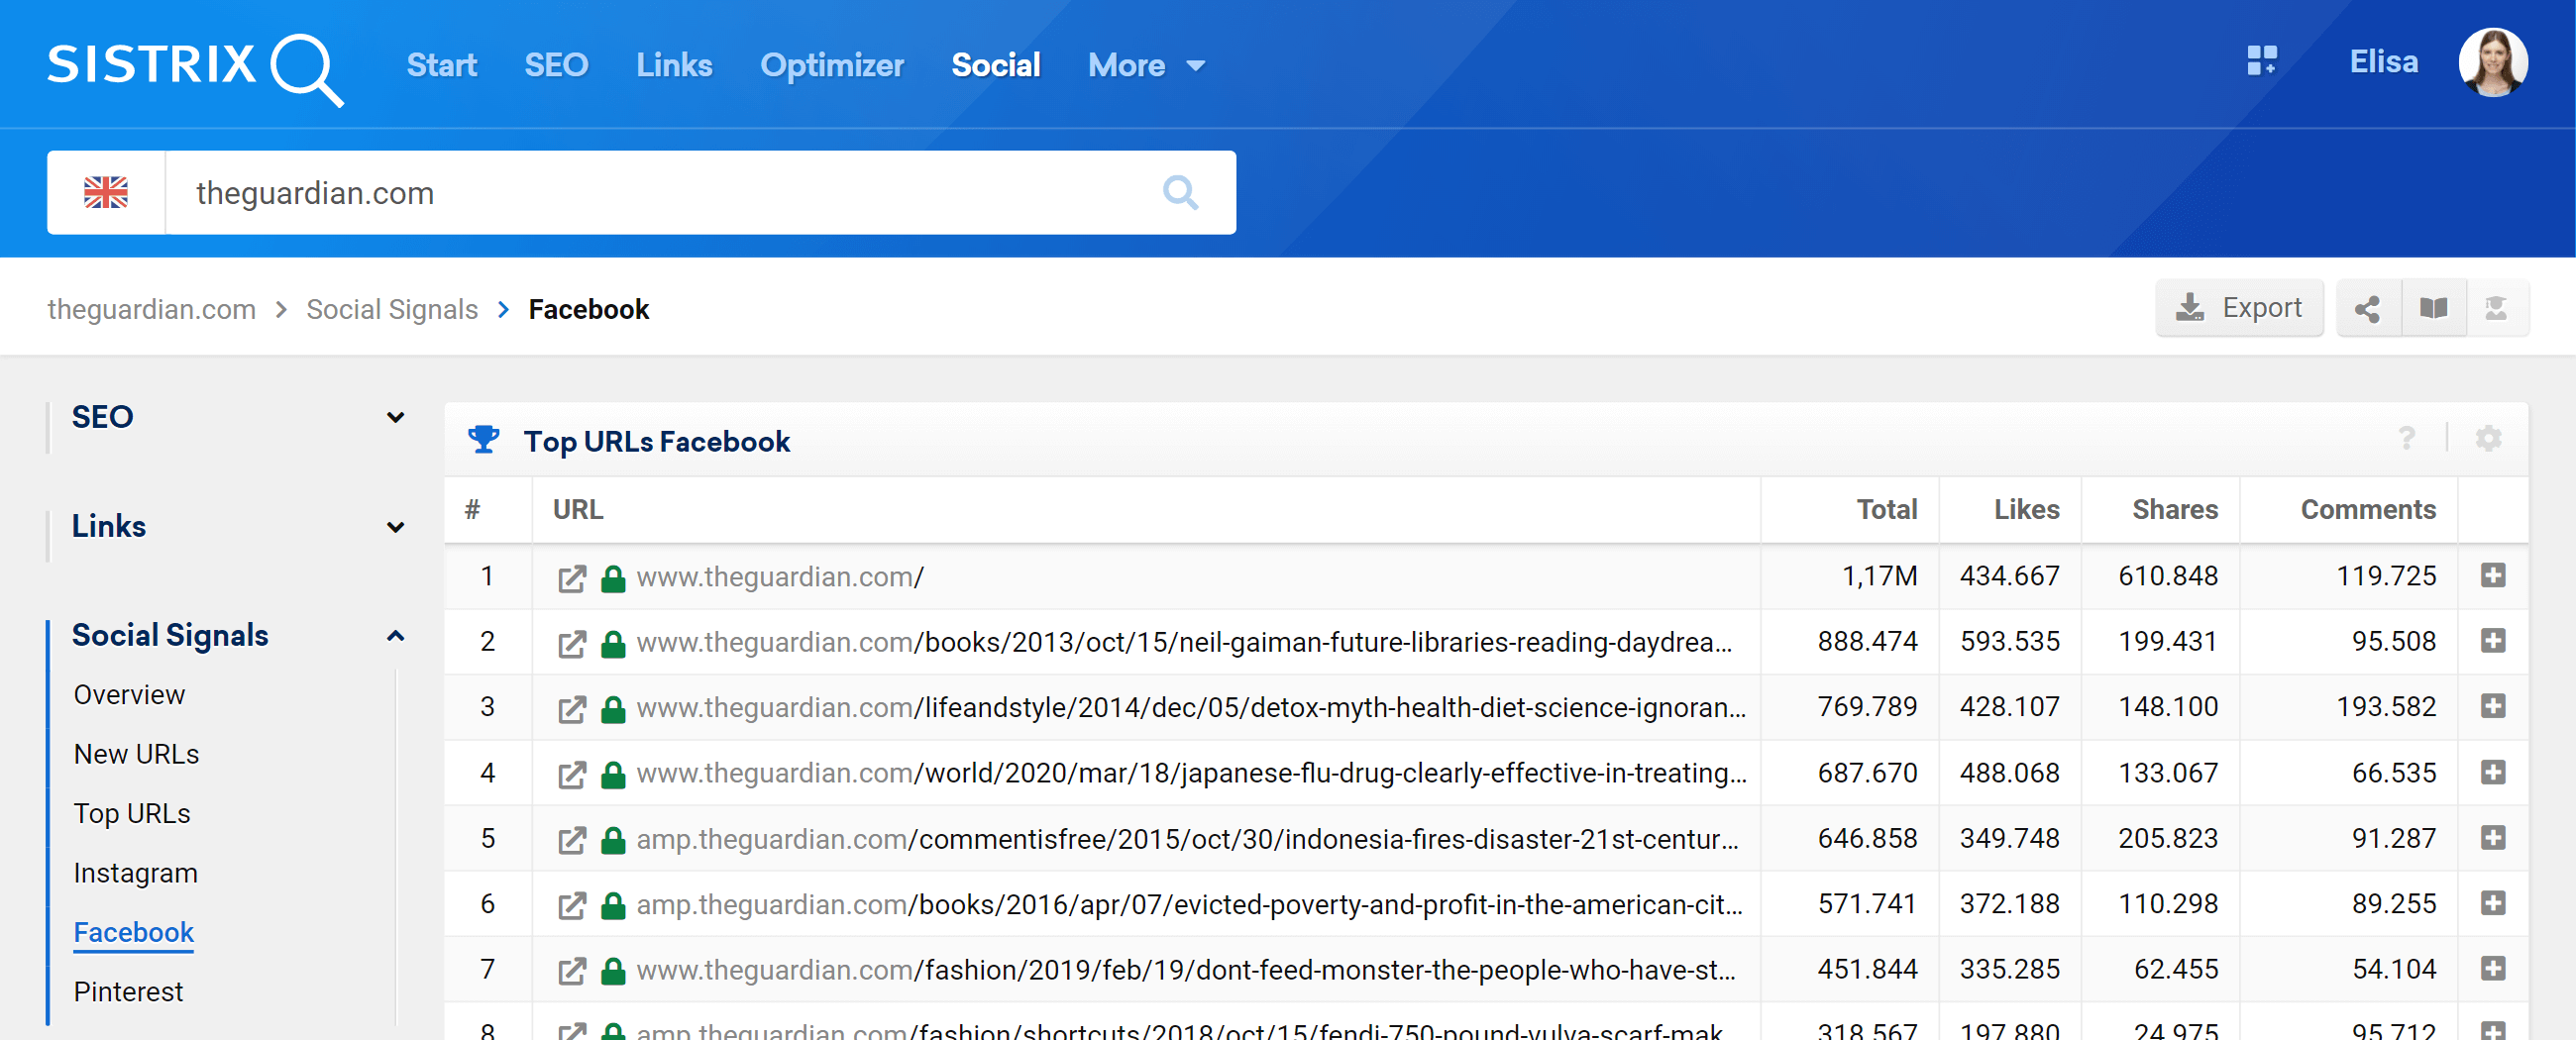
To analyse the social signals of a single URL, you can select the social media you’d like to focus on (Facebook or Pinterest) from the menu on the left of the screen 1 . There you will find an overview of the most popular URLs shared on that social network.
Let us have a closer look at the details of a URL. To do this, please click on the small plus-symbol at the end of the row of one URL 2.
You are now on the overview-page for the selected URL.
You already know these two boxes. Only now, the data is entirely focused on the URL. This lets you quickly determine where the activity for this URL is happening. For this example we notice that the URL is being shared more often than liked on networks.
New URLs
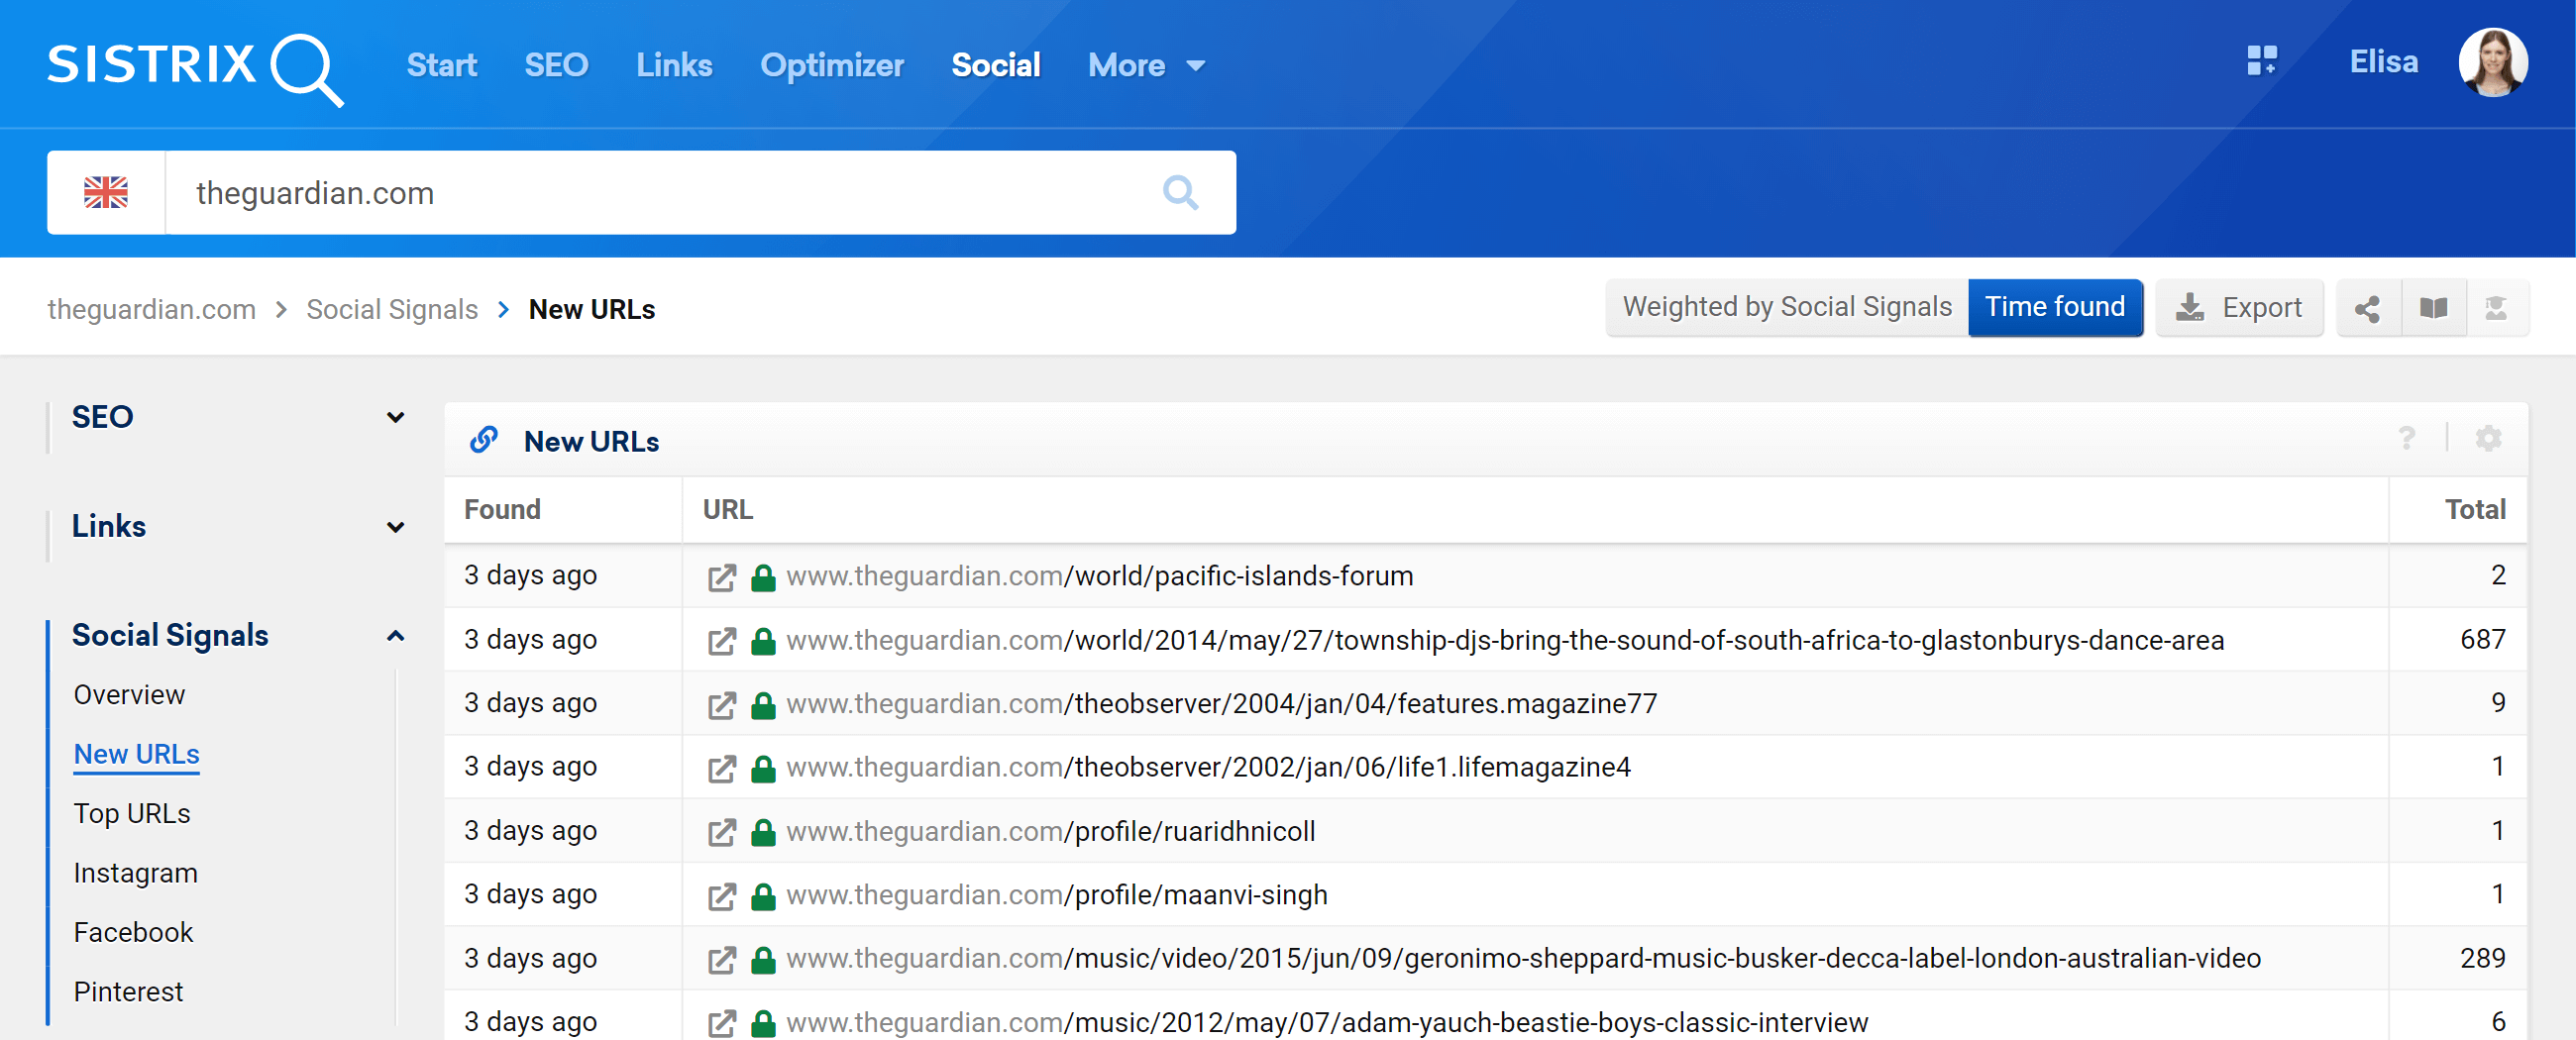
You reach the section “New URLs” using the left hand navigation 1 . These are especially interesting if you work a lot with social networks yourself or if your competitors do so, because here you can often first find new content on a domain.
You can change the way the table is sorted at the top of the page, where you have two buttons 2 . To always get the current data first, please select “Time found“. Otherwise you can sort the results according to the number of interactions they received.
Instagram data
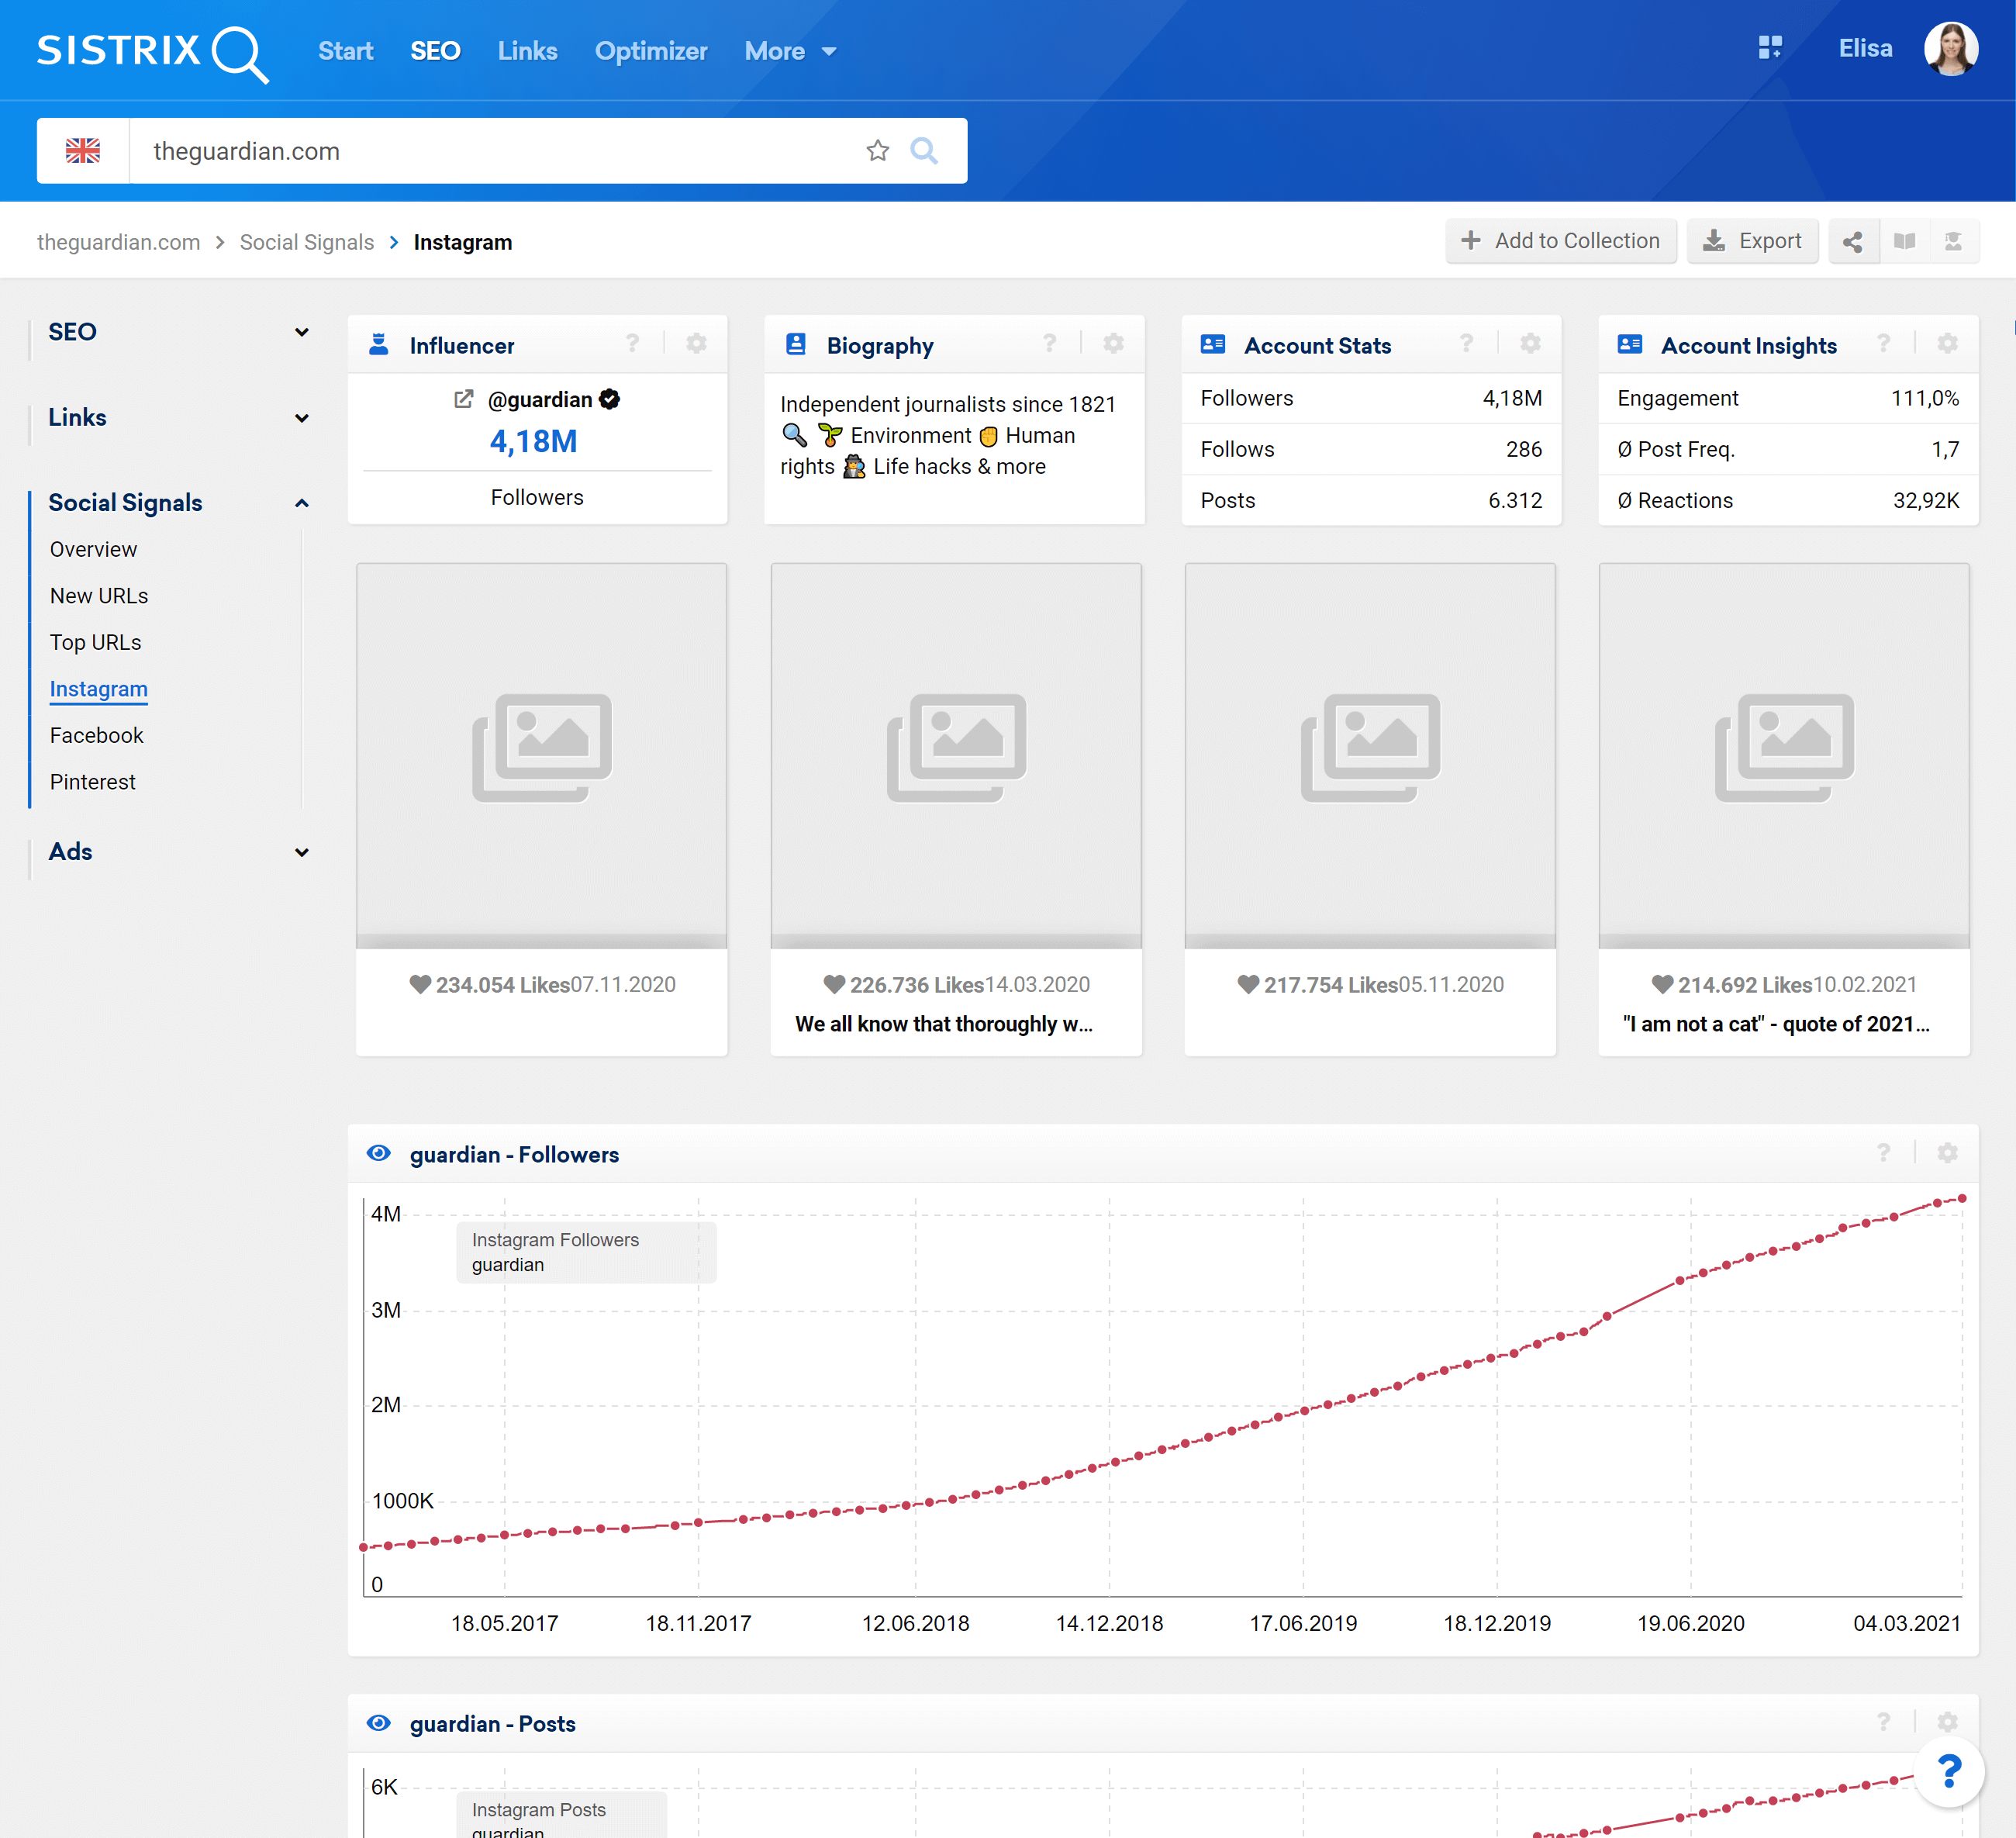
The Social Module contains also the data of other social media, like Instagram, TikTok and YouTube. This feature is particularly important when planning and monitoring influencer marketing campaigns.
To know more about these data, please read our tutorial “Find the Right Influencer – From Keyword to Community“.
Conclusion
With this module you can get an overview of any domain’s activities on social networks. In the detailed-analysis you can find out how well a specific URL is spreading on Facebook and Pinterest. Daily updates of the data allows you to observe the growth of social signals promptly and in great detail.
The module also helps you observe your competitors. If you add the “New URLs” of your competitors to a dashboard or in a report, you will always be up to date concerning the newest changes of these websites. You can learn more about the dashboards in our tutorial “Creating overviews with dashboards“, while we cover the reports in the tutorial “PDF-Reports: Configuration & Adjustments“.