
Google Looker Studio (formerly Google Data Studio) is the leading free tool for creating interactive dashboards and reports. To load data from the SISTRIX Toolbox directly into your reports, we offer an official Partner Connector: “SISTRIX Toolbox Data“.
Unlike more complex integrations that require manual API querying, the “SISTRIX Toolbox Data” connector handles all data retrieval and authentication. You simply need to select and configure the connector.
Connect to SISTRIX Toolbox Data
This guide provides a detailed, step-by-step walkthrough of the connection process.
Quick-Start Guide If you are already familiar with adding and configuring Partner Connectors in Looker Studio, you can jump directly to the Quick-Start Guide.
Step 1: Add the Connector in Looker Studio
The first step is to add “SISTRIX Toolbox Data” as a data source in your Looker Studio report.
- Open an existing report in Looker Studio or create a new one.
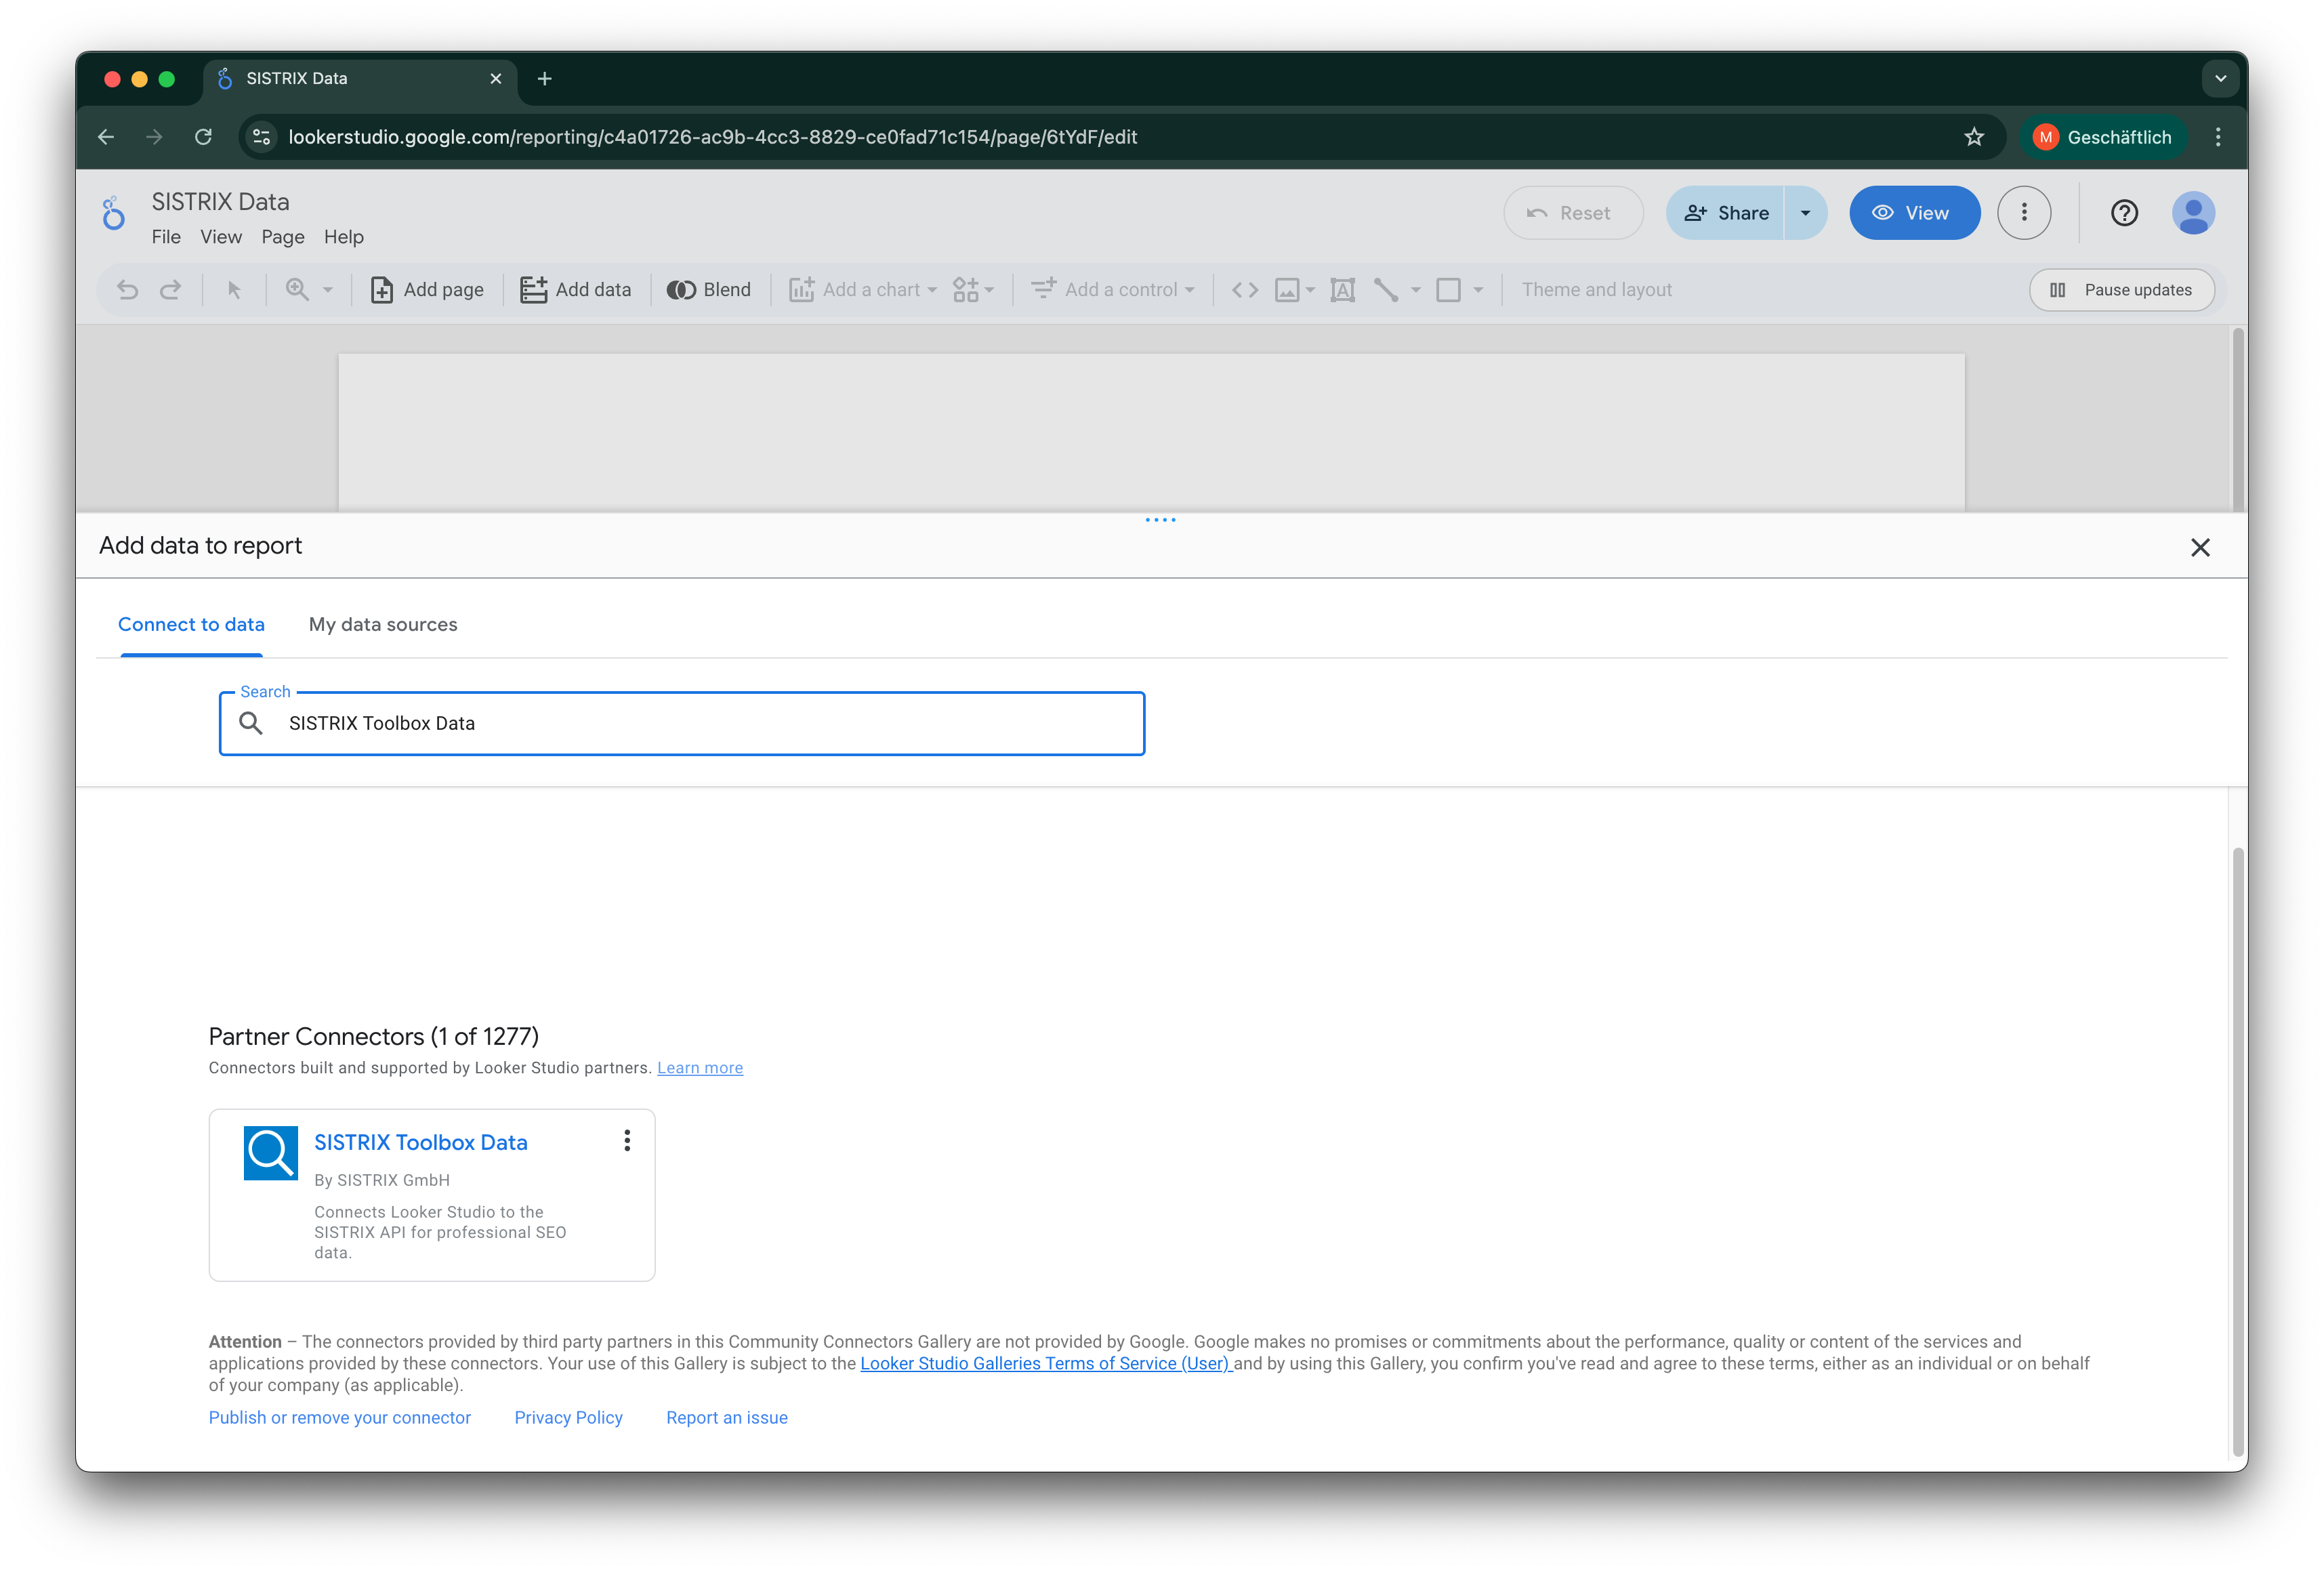
- In the menu, select “Add data”.
- In the search bar for available connectors, type “SISTRIX Toolbox Data”.
- Click on the connector to select it.
Step 2: Authenticate with Your API Key
To allow the connector to retrieve data from your SISTRIX account, you must authenticate using your personal API key.
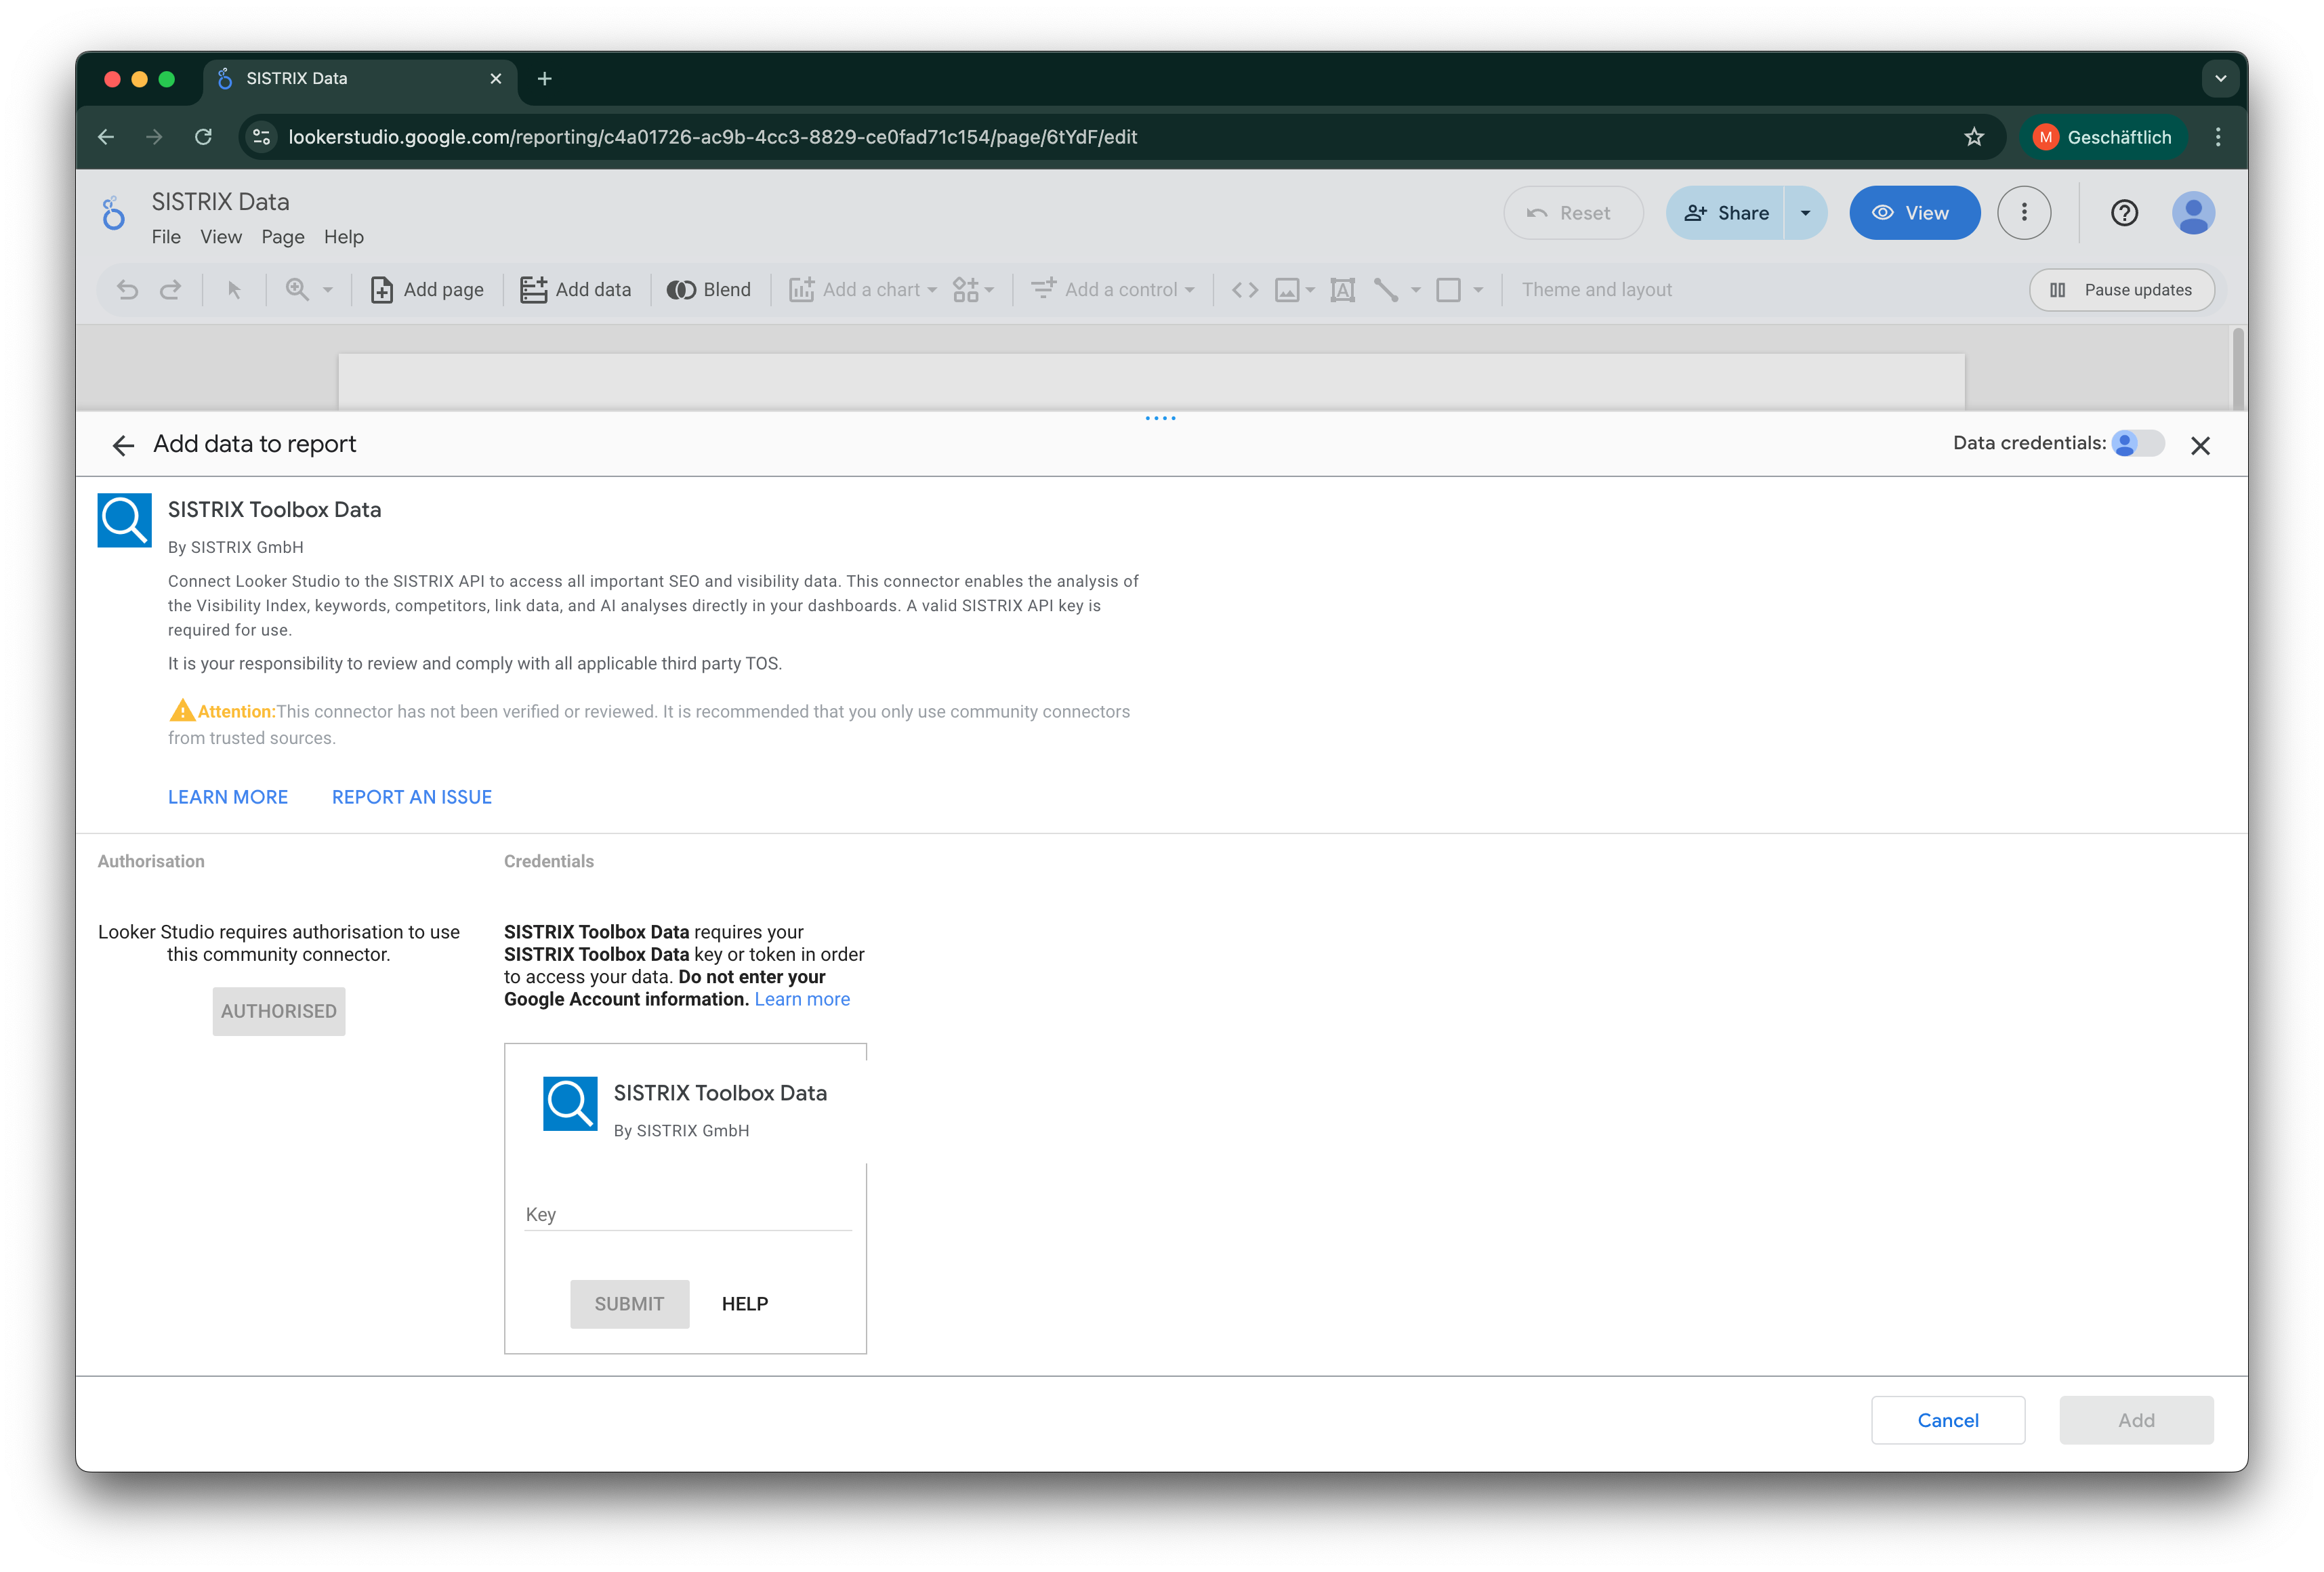
- After selecting the connector, you will be prompted to “AUTHORIZE” access for Google. Follow the on-screen instructions.
- In the next step, a field will appear for you to enter your API Key.
- You can view or request your API key at any time here.
- Paste your API key into the designated field and click “SUBMIT”.
Step 3: Configure the Data Query
After successful authentication, you must configure which data to retrieve. This is a two-step process.
1. Select the API Method (Report Type)
First, you will be shown a single dropdown menu labeled “Select Report Type”. This list contains all available SISTRIX API functions.
- Select the function you wish to query (e.g.,
domain.visibilityindexfor the Visibility Index ordomain.keywordsfor ranking keywords). - You can read about the specifics of each function in the official SISTRIX API documentation.
- Once you have made your selection, click “Next”.
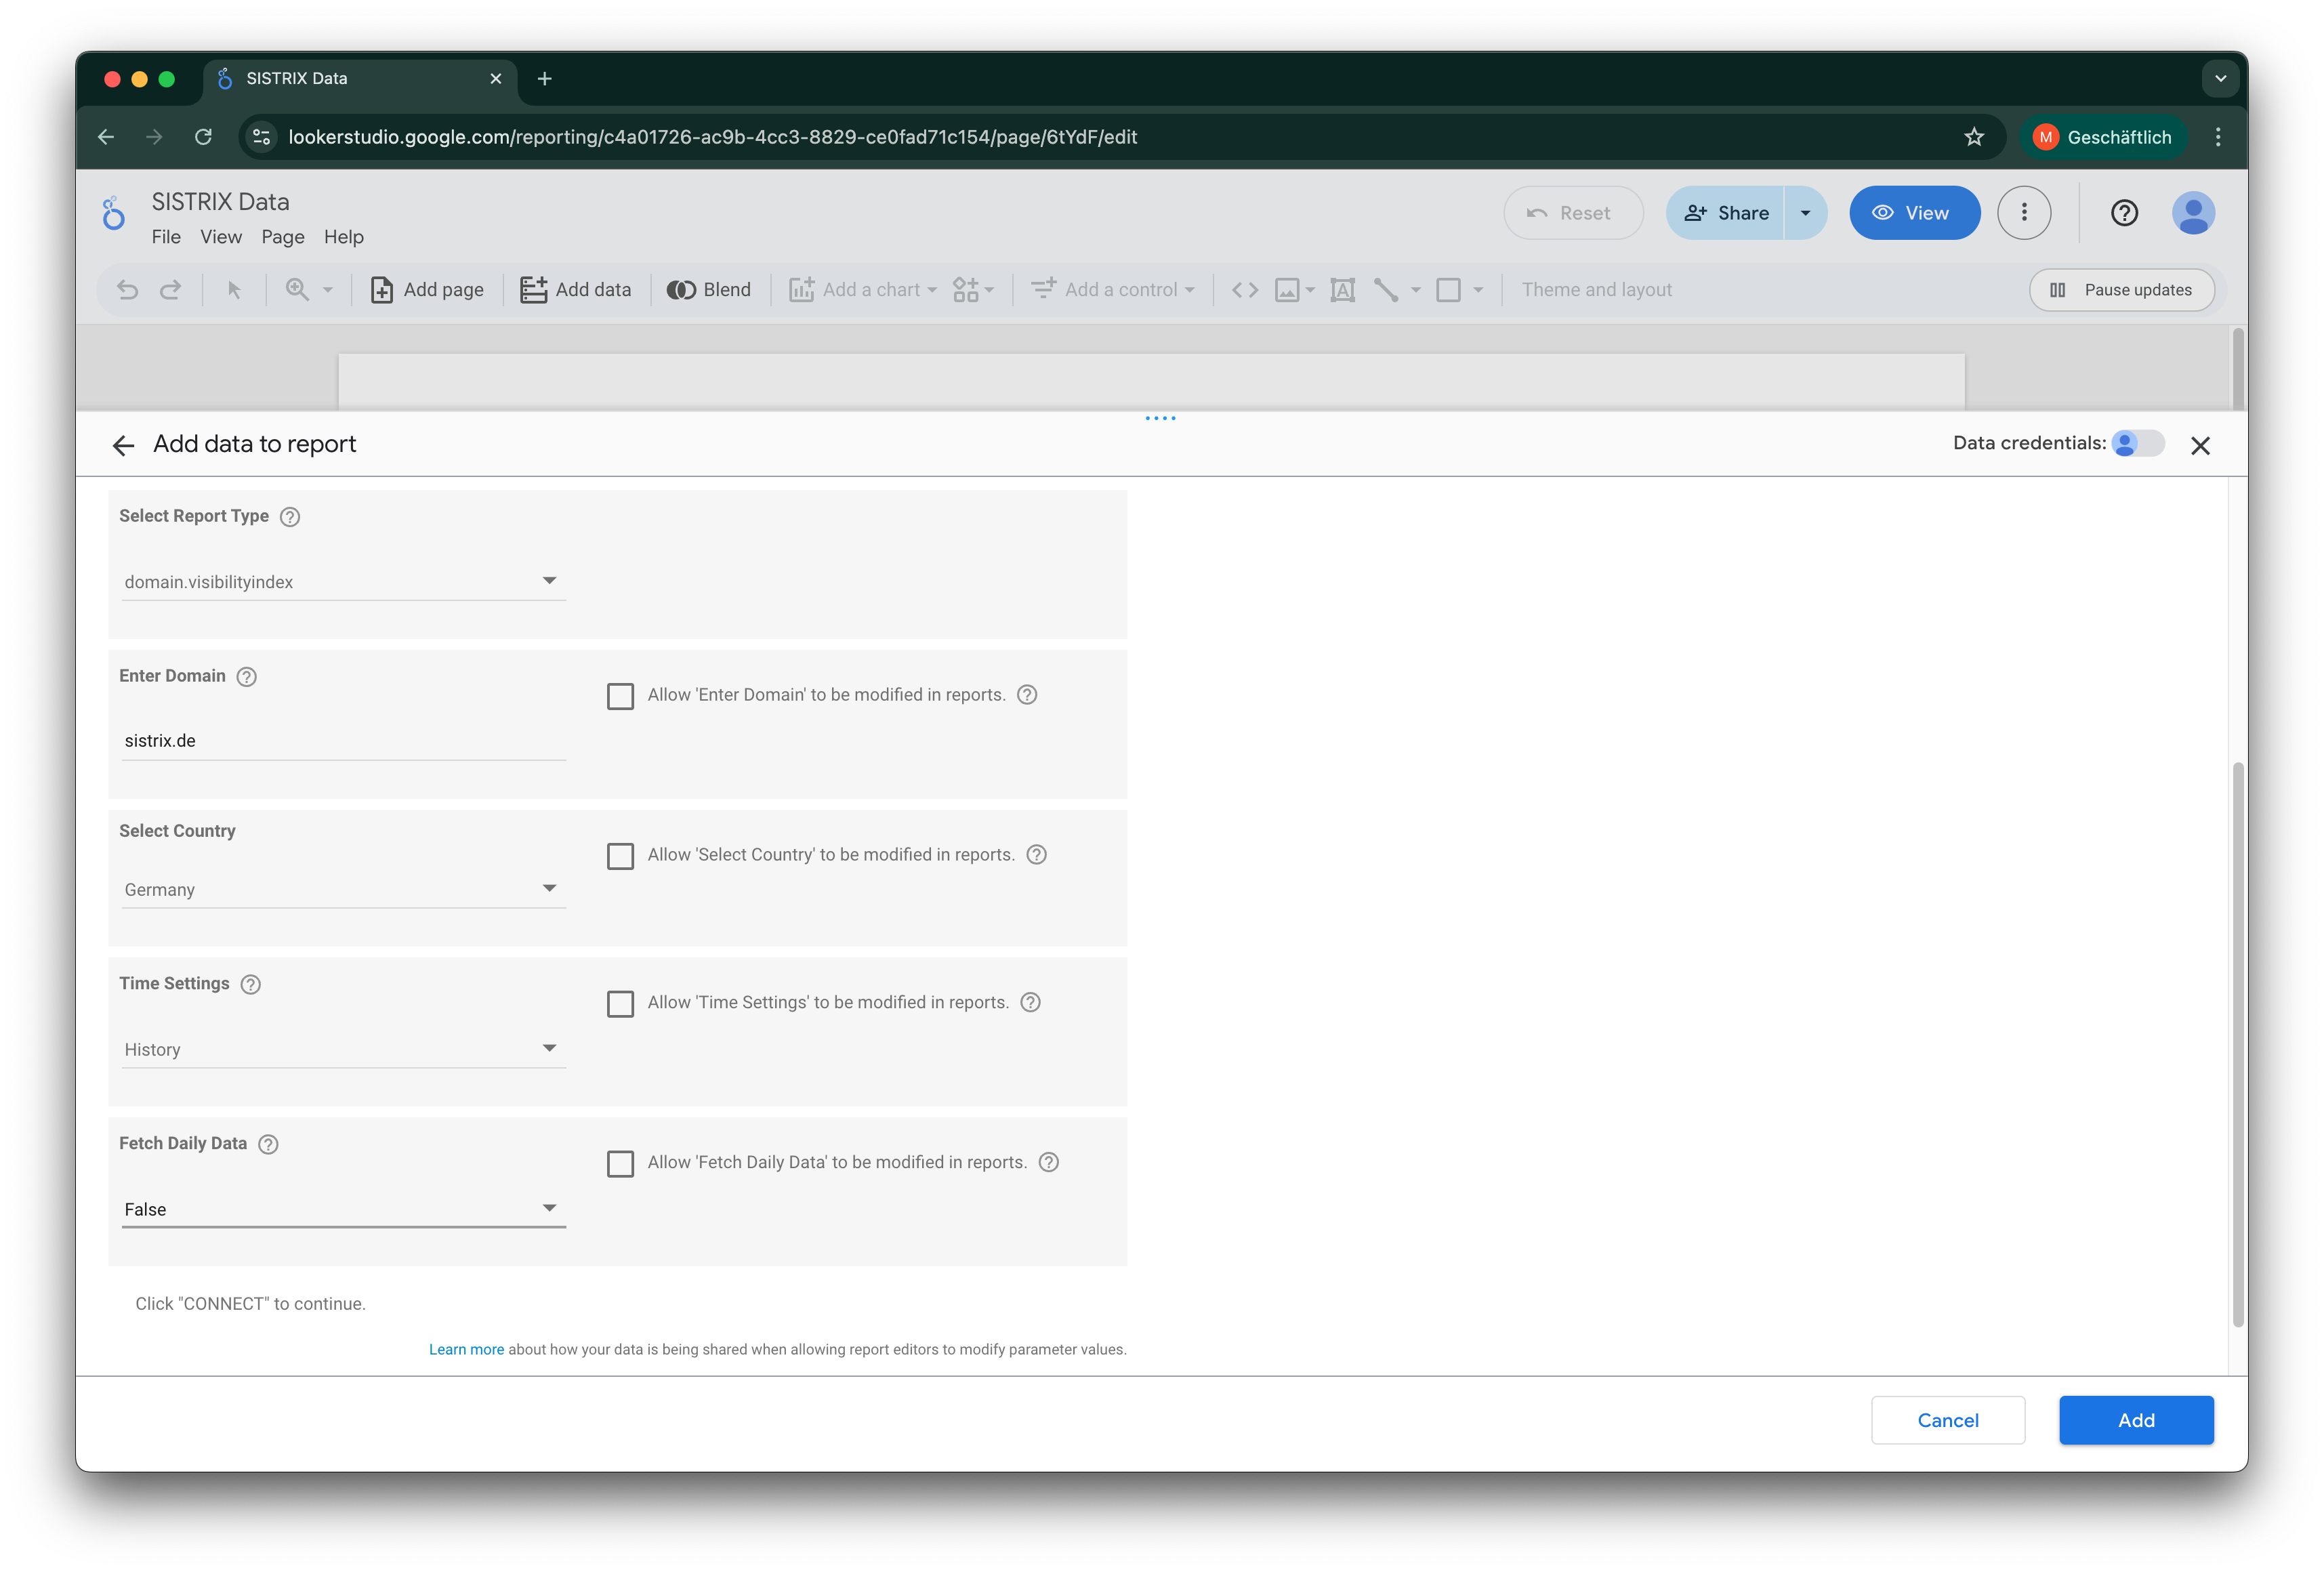
2. Enter the Parameters
After clicking “Next”, the connector will load the specific parameters required for the API function you selected. You will now see fields such as:
- Domain: Enter the domain for which you want to retrieve data (e.g.,
sistrix.com). - Country: Select the country code for the index you want to analyze (e.g.,
defor Germany,usfor the USA). - Other Parameters (e.g., Keyword): Depending on the selected “Report Type”, additional fields may appear.
Step 4: Add the Data Source
Once you have entered all the required parameters, you finalize the connection.
- Click “Add” in the lower right corner.
- A confirmation window will appear. Click “Add to Report” again.
You will now land back in the main report overview. The data source is successfully added.
Step 5: Rename Your Data Source (Recommended)
Your new data source is now listed in the “Data” panel on the right side of the editor, but it has a generic name (e.g., “SISTRIX Toolbox Data”). We strongly recommend renaming it.
- In the “Data” panel, hover over the name of the data source you just added.
- A pencil icon (Edit) will appear. Click it.
- This opens the data source settings. In the upper-left corner, click the data source name.
- It will become an editable text box. Enter a specific name (e.g., “SISTRIX – VI sistrix.com DE”) so you can easily identify it later, especially if you add multiple SISTRIX data sources.
- Click “Finished” in the upper-right corner to save and return to the report.
Step 5: Build Your First Chart
You are now in the Looker Studio report editor. On the right-hand side, you should see a “Data” panel showing all the fields from the data source you just added.
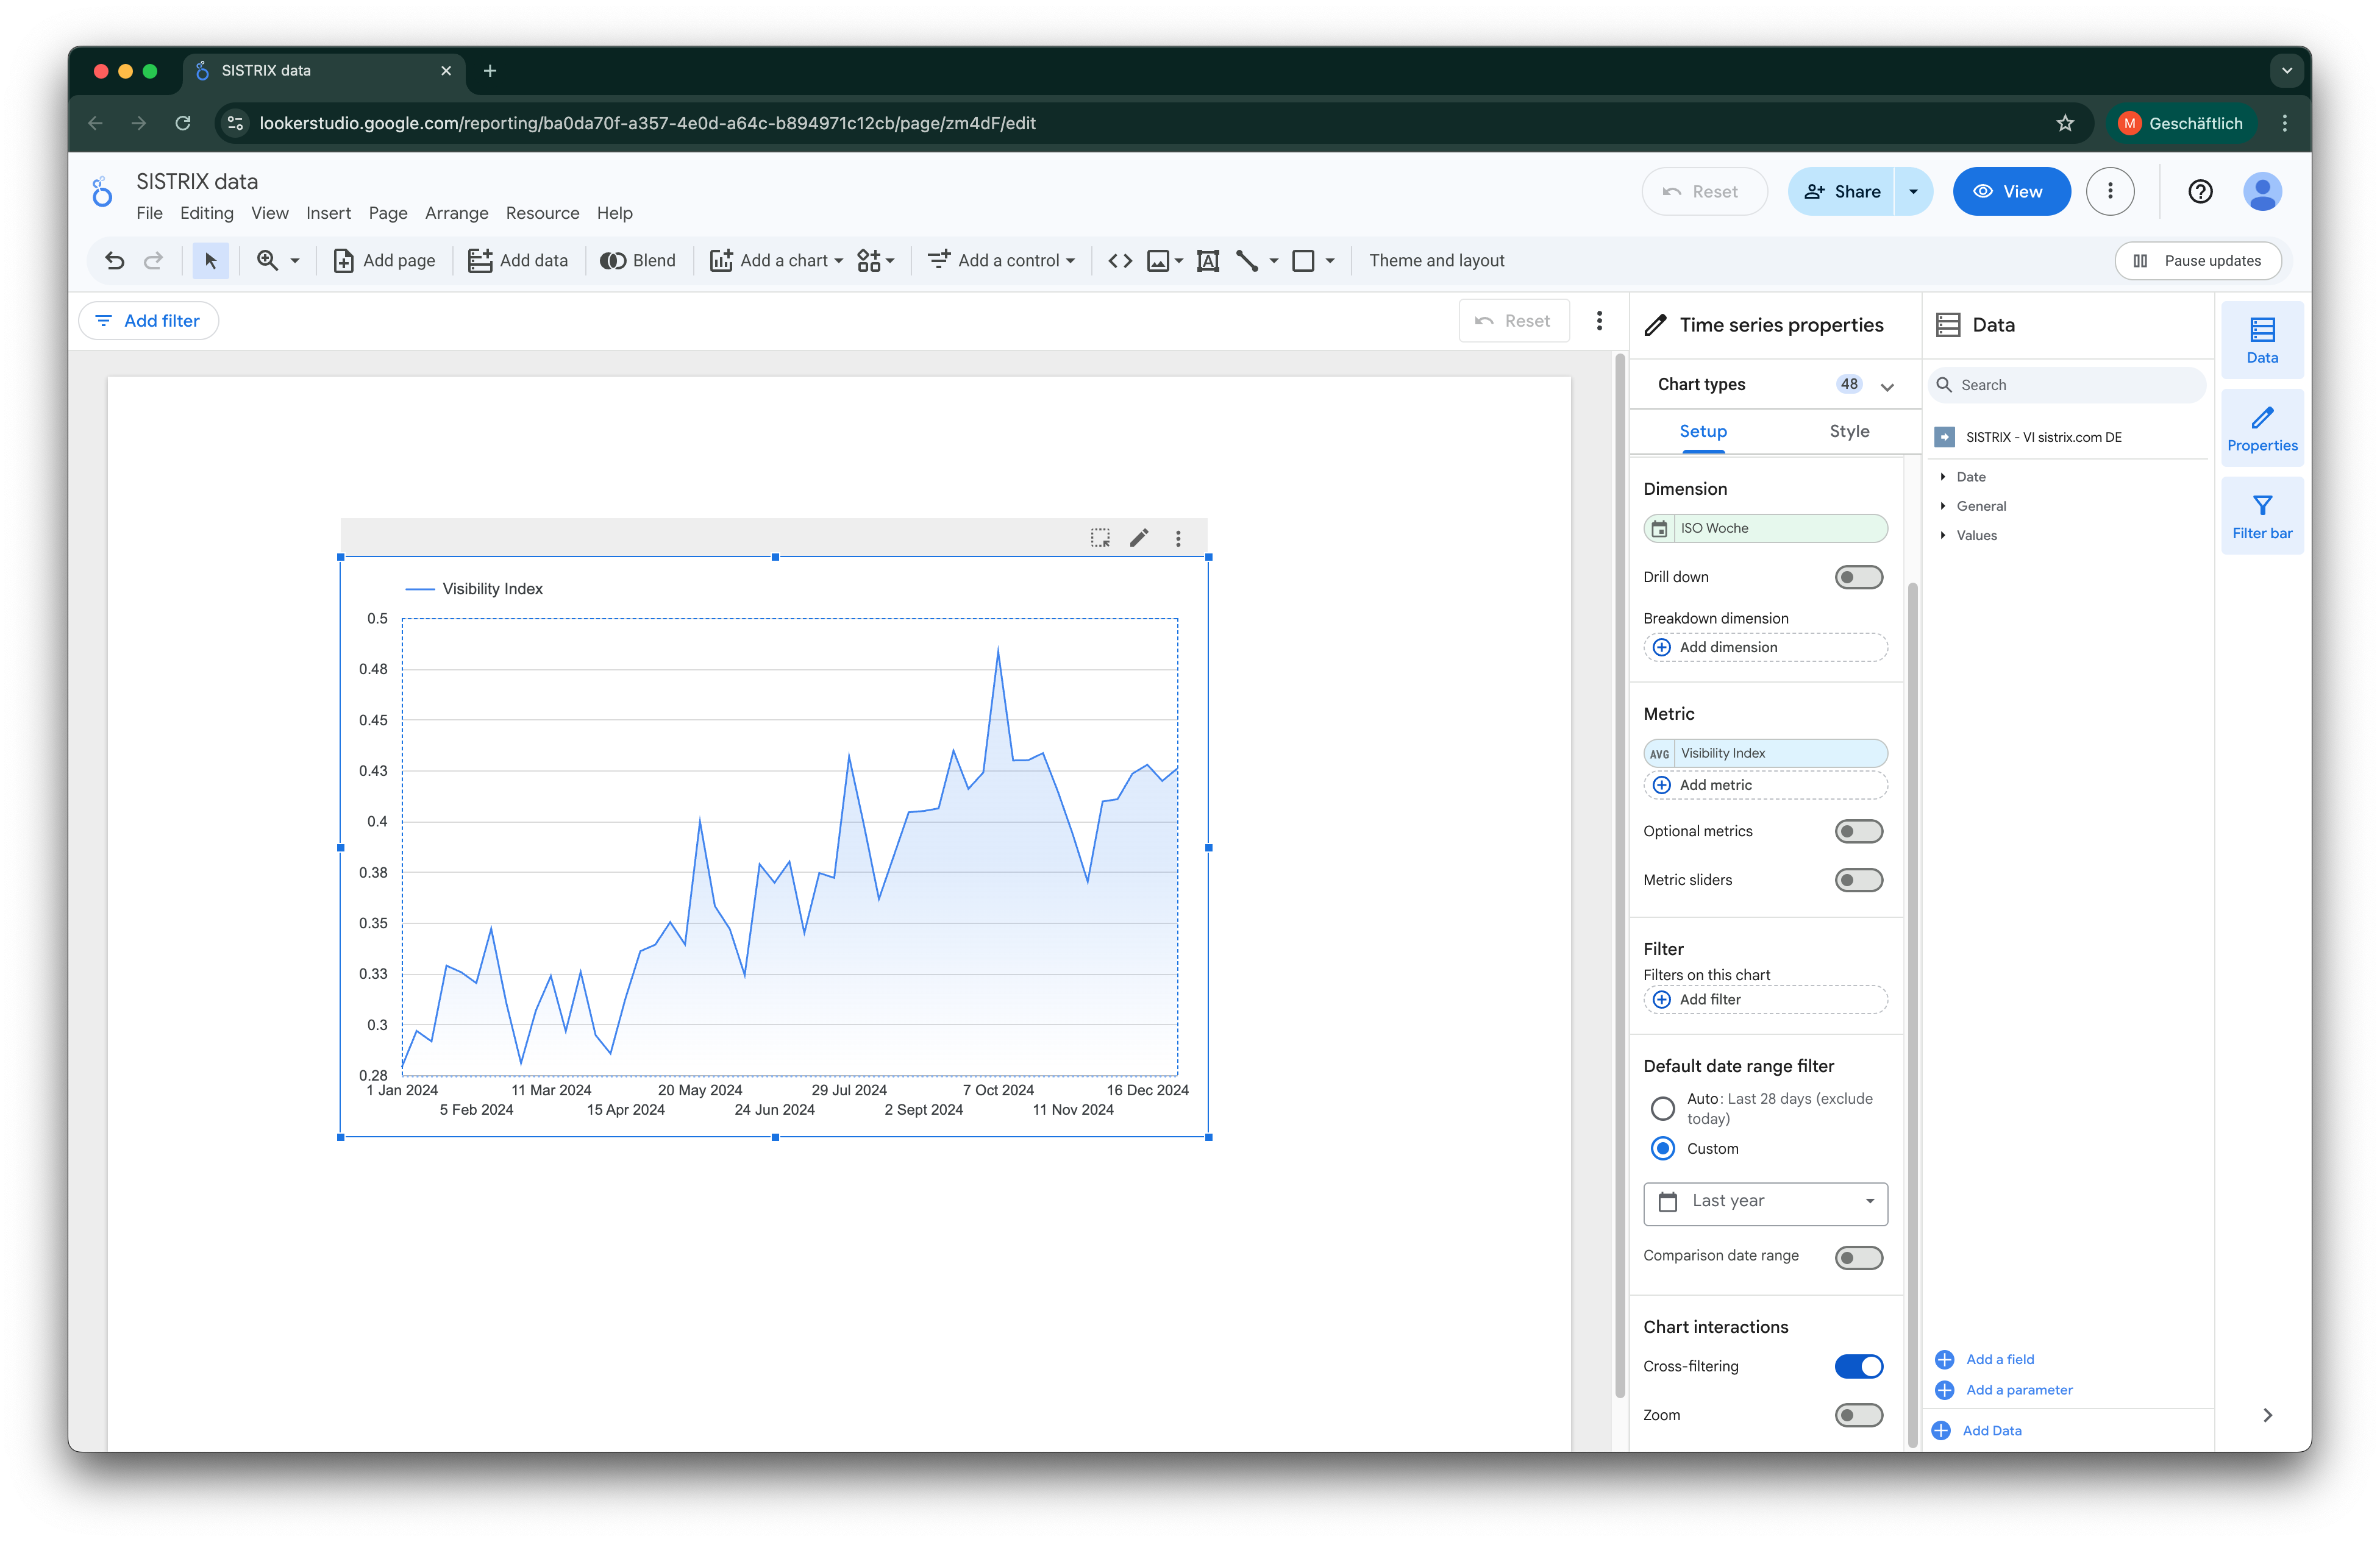
Let’s create a simple time series chart (assuming you added the domain.visibilityindex method with the time setting set to historic):
- In the Looker Studio menu, click “Add a chart” and select a “Time series chart”.
- Draw the chart on the blank report canvas.
- With the new chart selected, look at the “Setup” panel on the right.
- Ensure your new SISTRIX data source (e.g., “SISTRIX – VI sistrix.com DE”) is selected under “Data source”.
- Drag the “ISO Week” field from the “Data” panel into the “Dimension” box.
- Drag the “Visibility Index” field into the “Metric” box.
Looker Studio will automatically fetch the data and display the Visibility Index history for your selected domain. You can now add other charts (like scorecards or tables) or even add a new SISTRIX data source to query different data.
To adjust the date range:
By default, the chart’s date range is set to “Auto”, which uses the report-wide date setting. To set a specific range just for this chart:
- Make sure the chart is selected.
- In the “Setup” panel on the right, scroll down to the “Default date range” section.
- Click on “Auto” and change it to “Custom”.
- Select a preset range (like “Last Year”) or set a specific start and end date.
- Click “Apply”.
The chart will now update to show only the period you selected. You can now add other charts (like scorecards or tables) or even add a new SISTRIX data source to query different data.
Important Notes and Configuration Tips
Here are a few important points to keep in mind when working with the “SISTRIX Toolbox Data” connector.
API Credit Usage
Important: Every query, filter change, or report refresh that Looker Studio cannot serve from its cache will make a live call to the SISTRIX API. This will consume your API credits.
- Be mindful of this when sharing reports widely or setting up automatic refresh intervals.
- Looker Studio automatically caches your data. You can control the data freshness (e.g., “every 1 hour” or “every 12 hours”) in the data source settings to balance live data needs with credit usage.
- You can check your API credit usage at any time on this page in your settings.
Adding Multiple Data Sets
A single data source connection is tied to the one API method and the one set of parameters you chose in Step 3 (e.g., domain.visibilityindex for sistrix.com).
If you want to display data for a different domain (e.g., google.com) or from a different API method (e.g., domain.keywords) in the same report, you must add a new data source by repeating Step 1 through Step 5. This is why renaming your data sources (Step 5) is so important for staying organized.
Handling Dates and Time Ranges
For many API methods, the connector configuration (Step 3) will ask you to choose a “Time Setting” parameter (or similar). This choice fundamentally changes how the data source interacts with Looker Studio’s Date Range Control.
This parameter typically offers two modes: Historic or Date.
Time Setting: “Historic” (For Time Series Charts)
This setting is used to retrieve a full time series of data over a period.
- How it works: The connector will use the full date range (both the start and end date) that is selected in your Looker Studio report’s Date Range Control.
- Best use: This is the correct option for time series charts, line graphs, and any other visualization where you want to show a trend over a period.
- API Credit Warning: Be aware that due to API limitations, requesting older data can consume more credits because, for some queries, all data points from your chosen start date until today must be fetched.
Time Setting: “Date” (For Scorecards / Single Values)
This setting is used to retrieve the value for a single point in time.
- How it works: The connector will only use the “Start Date” from your Looker Studio report’s Date Range Control. The end date of the range will be ignored.
- Best use: This is ideal for Scorecards. For example, if your report’s date range is set to “This Month” (e.g., November 1 – November 30), the data source will only pull the value for the “Start Date” (November 1). If you want to show the value for “Today”, you would set your report’s default date range to “Today”.
Quick-Start Guide
- Generate Your Personal API Key. You will need this to authenticate the connector. You can find the API key overview and your credit status in your account settings under “API access“.
- Find the “SISTRIX Toolbox Data” Connector. In your Looker Studio report, navigate to “Resource” > “Manage added data sources” and search for “SISTRIX Toolbox Data“.
- Authorize and Select Your API Method. Follow the prompts to authorize and paste your API key. After, select the desired API function (e.g.,
domain.visibilityindex) from the “Data Type” dropdown. - Configure Parameters and Connect. Click “Next” to fill in the specific parameters for that method (like
DomainandTime Setting). Click “Connect”, rename the data source, and “Add to Report”. - Familiarize Yourself with Our Limitations. To provide the best user experience, all API usage (including from Looker Studio) is subject to our fair-use policy. You can find this in the API documentation under “Limitations“.
- Understand the API Functions. To learn what data each function in the “Data Type” dropdown provides, you’ll find a comprehensive overview of all available API functions in the main documentation.