

After a long wait, Google has just started the roll-out of the first Core Update of the year. In this article we’ll show you affected domains, take a closer look at sectors and examples, and show you how to analyse losses.
Update: Google announced that the Core Update roll-out was completed on the 9th June 2022. Final data below.
If your time is precious, here are three important point to note about this Google update:
- This major Google Core update was deployed on Wednesday (May 25th 2022) . These broad algorithm updates affect the ranking of many websites.
- It may take up to two weeks to see the full impact of the update across all domains. However, the first trends can already be seen.
- The first clear movements can be seen in the daily SISTRIX data from Friday (05/27). Our live data confirms these trends with updates every five minutes.
To check the impact on your domain, log in now or try it for free . We will update this blog post regularly as new data becomes available. If you would like to be notified of future algorithm updates by email, sign up for our newsletter .
Google’s official announcement of the core update
As the name suggests, Google Core Updates are major adjustments to the “core” of Google’s ranking algorithm. As a result, the rankings of many domains change – both positively and negatively.
More than six months have passed since the last core update , an unusually long period of time. On Wednesday, Google announced that it would deploy the first core update this year. That rather unoriginal name they have given it is the May 2022 core update:
Check domains in SISTRIX to see the impact
The first effects of the Google update can already be seen in the daily SISTRIX visibility data from today (05/27). To check any domain, simply enter the domain in the search above and then switch to Visibility Index in the navigation:
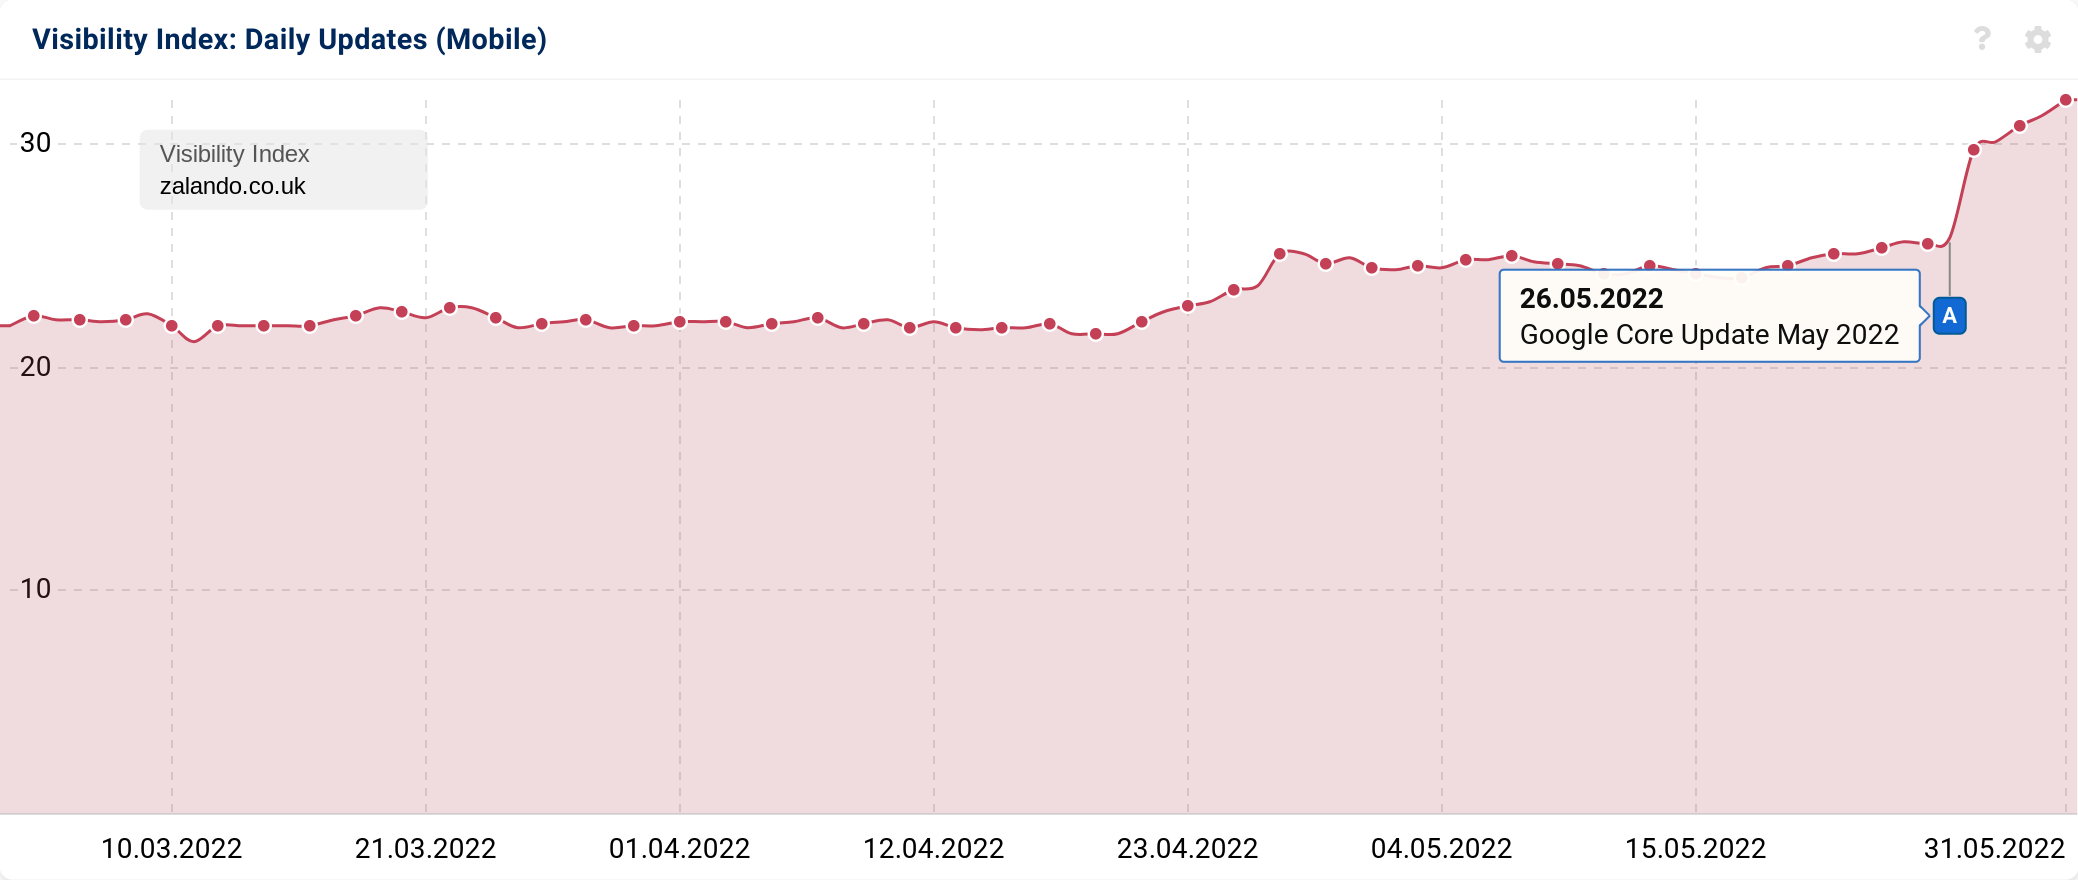
Through the development of the daily visibility index you can see very well whether the respective domain has either gained or lost significant visibility from the 26th May.
For even more up-to-date data, you can view the live Visibility Index in the domain overview . The data recorded up to that point is updated there every 5 minutes. The trend from the daily data should be able to be continued there:
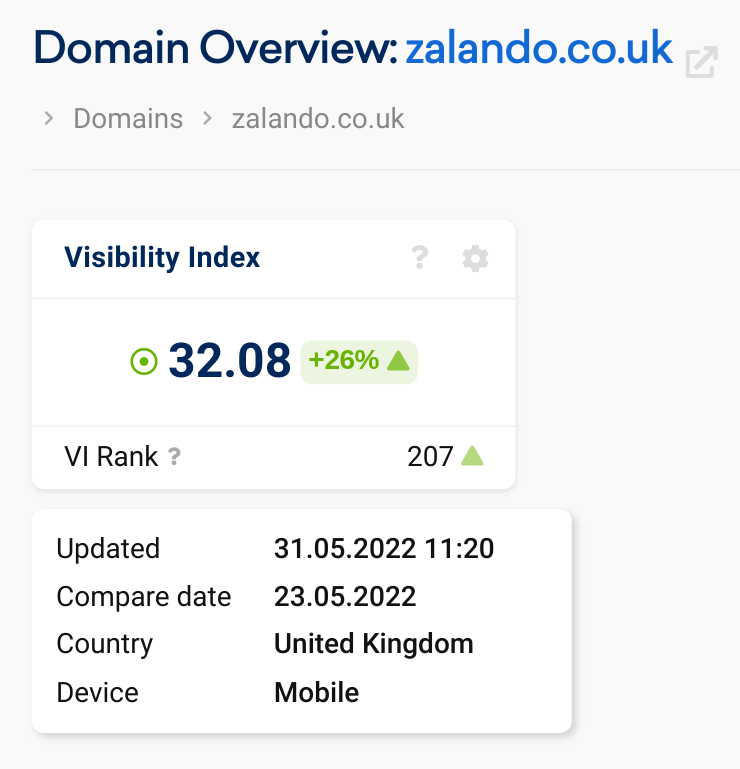
In our example, we saw that the visibility of the domain was 25.84 points on Thursday, then increased to 27.95 on Friday and as of now (Tuesday 31st May 11:20) the Visibility Index is 32.08.
Initial analyses and observations
During our own research we’ve seen a large number of significant movements across the reference space including dictionaries and car information.
We’ve also seen losses in many low quality sites. u-buy.co.uk is an example which appears to be offering products from the USA into the UK. Reviews listed on the site can be found on other sites.
On the other hand, a recently ranking site that appears to be an automation exercise, has increased growth-rate. [Given that we saw some spam redirects on the site we’re not naming it.]
Song sites – lyrics, band information – is again an area of high-movement.
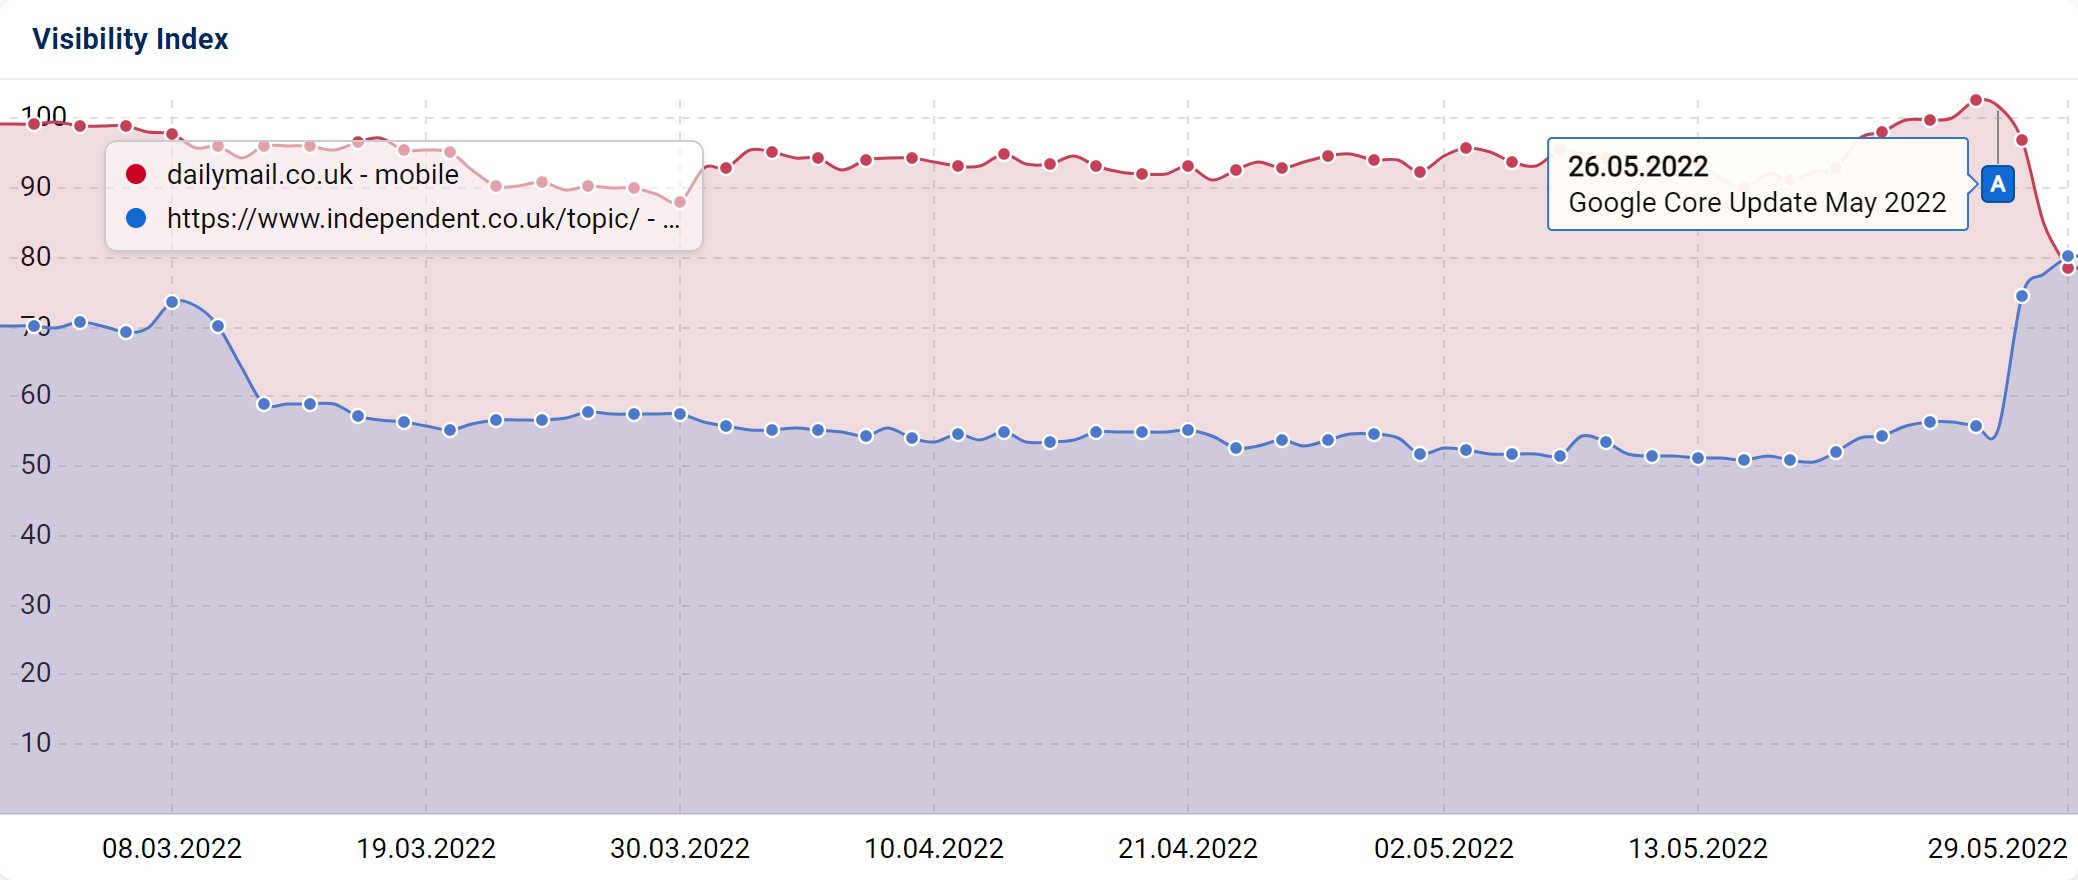
Among 30 news websites analysed there has been a general loss for most, although the /topic directory at independent.co.uk got quite the boost. Competing domain dailymail.co.uk doesn’t implement such topic landing pages.
Analysis from SEOs is also appearing online. Malte Landwehr, Head of SEO at German company Idealo, has published twitter thread covering his observations.
“Based on the 100 largest losers and 100 largest winners, I observed 3 major trends.
- Video instead of text
- Specialists instead of generalists
- Better search intent matching” [source]
Winners and Losers
To help you get a feeling for the range of domains with big gains or losses up until today, here’s a list of 30 winners and losers from the Google UK visibility. Firstly, the winners and losers by percentage:
| Domain | Visibillity Index 26.05.2022 | Visibillity Index 09.06.2022 | Percentage change |
|---|---|---|---|
| makeup.uk | 0.4366 | 2.719 | 522.77% |
| norfarchtrust.org.uk | 1.8745 | 9.7604 | 420.69% |
| mya.co.uk | 0.7416 | 3.3313 | 349.20% |
| xxxner.com | 0.2704 | 1.0186 | 276.70% |
| leekes.co.uk | 1.2043 | 4.5021 | 273.84% |
| boomplay.com | 0.4091 | 1.428 | 249.06% |
| rationalwiki.org | 0.4566 | 1.5735 | 244.61% |
| fife.ac.uk | 0.3061 | 1.0508 | 243.29% |
| guitarparty.com | 0.5772 | 1.854 | 221.21% |
| inbrief.co.uk | 0.4529 | 1.4256 | 214.77% |
| deezer.com | 7.6616 | 23.8267 | 210.99% |
| uniprot.org | 0.3405 | 1.0437 | 206.52% |
| carsupermarket.com | 0.5431 | 1.5923 | 193.19% |
| rockettstgeorge.co.uk | 1.0209 | 2.993 | 193.17% |
| doheth.co.uk | 1.1253 | 3.2892 | 192.30% |
| appbrain.com | 0.386 | 1.0795 | 179.66% |
| childline.org.uk | 1.1823 | 3.2265 | 172.90% |
| imperialcollegeunion.org | 0.4715 | 1.27 | 169.35% |
| smule.com | 1.1614 | 3.1029 | 167.17% |
| kenwoodtravel.co.uk | 1.2501 | 3.266 | 161.26% |
Where there are winners, there are always losers:
| Domain | Visibillity Index 26.05.2022 | Visibillity Index 09.06.2022 | Percentage change |
|---|---|---|---|
| cia.gov | 7.7196 | 1.6908 | -78.10% |
| lumenlearning.com | 15.3036 | 4.049 | -73.54% |
| circlehealthgroup.co.uk | 4.158 | 1.1901 | -71.38% |
| adl.org | 3.4406 | 1.0667 | -69.00% |
| kiddle.co | 13.4375 | 4.2006 | -68.74% |
| carpetright.co.uk | 3.7619 | 1.4155 | -62.37% |
| bestreviews.guide | 48.1078 | 18.7173 | -61.09% |
| u-buy.co.uk | 3.9657 | 1.5472 | -60.99% |
| wikidiff.com | 6.9176 | 2.7564 | -60.15% |
| fruugo.co.uk | 3.3967 | 1.4024 | -58.71% |
| muckrack.com | 5.1699 | 2.2915 | -55.68% |
| cocofinder.com | 2.728 | 1.2182 | -55.34% |
| mychordbook.com | 6.5068 | 3.1134 | -52.15% |
| pnas.org | 9.6291 | 4.6775 | -51.42% |
| duolingo.com | 12.9357 | 6.3028 | -51.28% |
| datanyze.com | 2.779 | 1.3578 | -51.14% |
| irishtimes.com | 7.3318 | 3.6022 | -50.87% |
| wealthygorilla.com | 5.2126 | 2.5634 | -50.82% |
| nationalworld.com | 6.3825 | 3.1459 | -50.71% |
| bankbazaar.com | 2.1459 | 1.0616 | -50.53% |
Here are the winners and losers by absolute visibility change:
| Domain | Visibillity Index 26.05.2022 | Visibillity Index 09.06.2022 | Change |
|---|---|---|---|
| amazon.co.uk | 2828.6397 | 3166.3488 | 337.7091 |
| ebay.co.uk | 1018.1084 | 1264.9788 | 246.8704 |
| youtube.com | 571.3914 | 674.7357 | 103.3443 |
| etsy.com | 580.2328 | 668.641 | 88.4082 |
| google.co.uk | 240.6304 | 317.0915 | 76.4611 |
| instagram.com | 577.7919 | 632.8065 | 55.0146 |
| apple.com | 125.0614 | 173.5284 | 48.467 |
| wikipedia.org | 7191.9109 | 7234.9272 | 43.0163 |
| amazon.com | 178.2021 | 219.734 | 41.5319 |
| pornhub.com | 179.2632 | 215.2702 | 36.007 |
| quora.com | 51.3229 | 86.5618 | 35.2389 |
| www.gov.uk | 348.698 | 381.7967 | 33.0987 |
| goodreads.com | 88.7177 | 120.3445 | 31.6268 |
| discogs.com | 218.4575 | 249.4848 | 31.0273 |
| xnxx.com | 135.8908 | 166.6828 | 30.792 |
| fandom.com | 659.2703 | 689.5829 | 30.3126 |
| www.nhs.uk | 496.8127 | 525.5446 | 28.7319 |
| lexico.com | 97.9223 | 126.6391 | 28.7168 |
| tiktok.com | 18.4378 | 46.0501 | 27.6123 |
| company-information.service.gov.uk | 112.2704 | 139.1494 | 26.879 |
Here are the domains losing the most visibility during the Core Update.
| Domain | Visibillity Index 26.05.2022 | Visibillity Index 09.06.2022 | Change |
|---|---|---|---|
| britannica.com | 845.9518 | 776.9839 | -68.9679 |
| dailymail.co.uk | 101.7445 | 68.6897 | -33.0548 |
| theguardian.com | 313.4092 | 281.4334 | -31.9758 |
| bestreviews.guide | 48.1078 | 18.7173 | -29.3905 |
| dictionary.com | 481.4606 | 452.5318 | -28.9288 |
| bbc.co.uk | 327.679 | 299.5849 | -28.0941 |
| spotify.com | 382.4058 | 356.7202 | -25.6856 |
| screwfix.com | 192.5988 | 167.2415 | -25.3573 |
| webmd.com | 349.6919 | 325.3756 | -24.3163 |
| lyrics.com | 72.5302 | 48.7553 | -23.7749 |
| dunelm.com | 90.5967 | 66.8321 | -23.7646 |
| reddit.com | 162.1821 | 138.8192 | -23.3629 |
| shutterstock.com | 100.4781 | 77.759 | -22.7191 |
| tripadvisor.co.uk | 302.3172 | 284.285 | -18.0322 |
| investopedia.com | 251.361 | 234.5511 | -16.8099 |
| collinsdictionary.com | 485.452 | 468.7469 | -16.7051 |
| vocabulary.com | 129.1996 | 113.7856 | -15.414 |
| thefreedictionary.com | 221.0361 | 205.7487 | -15.2874 |
| bbcgoodfood.com | 170.4912 | 155.4919 | -14.9993 |
| songfacts.com | 108.3306 | 94.8003 | -13.5303 |
Non-Core Update changes
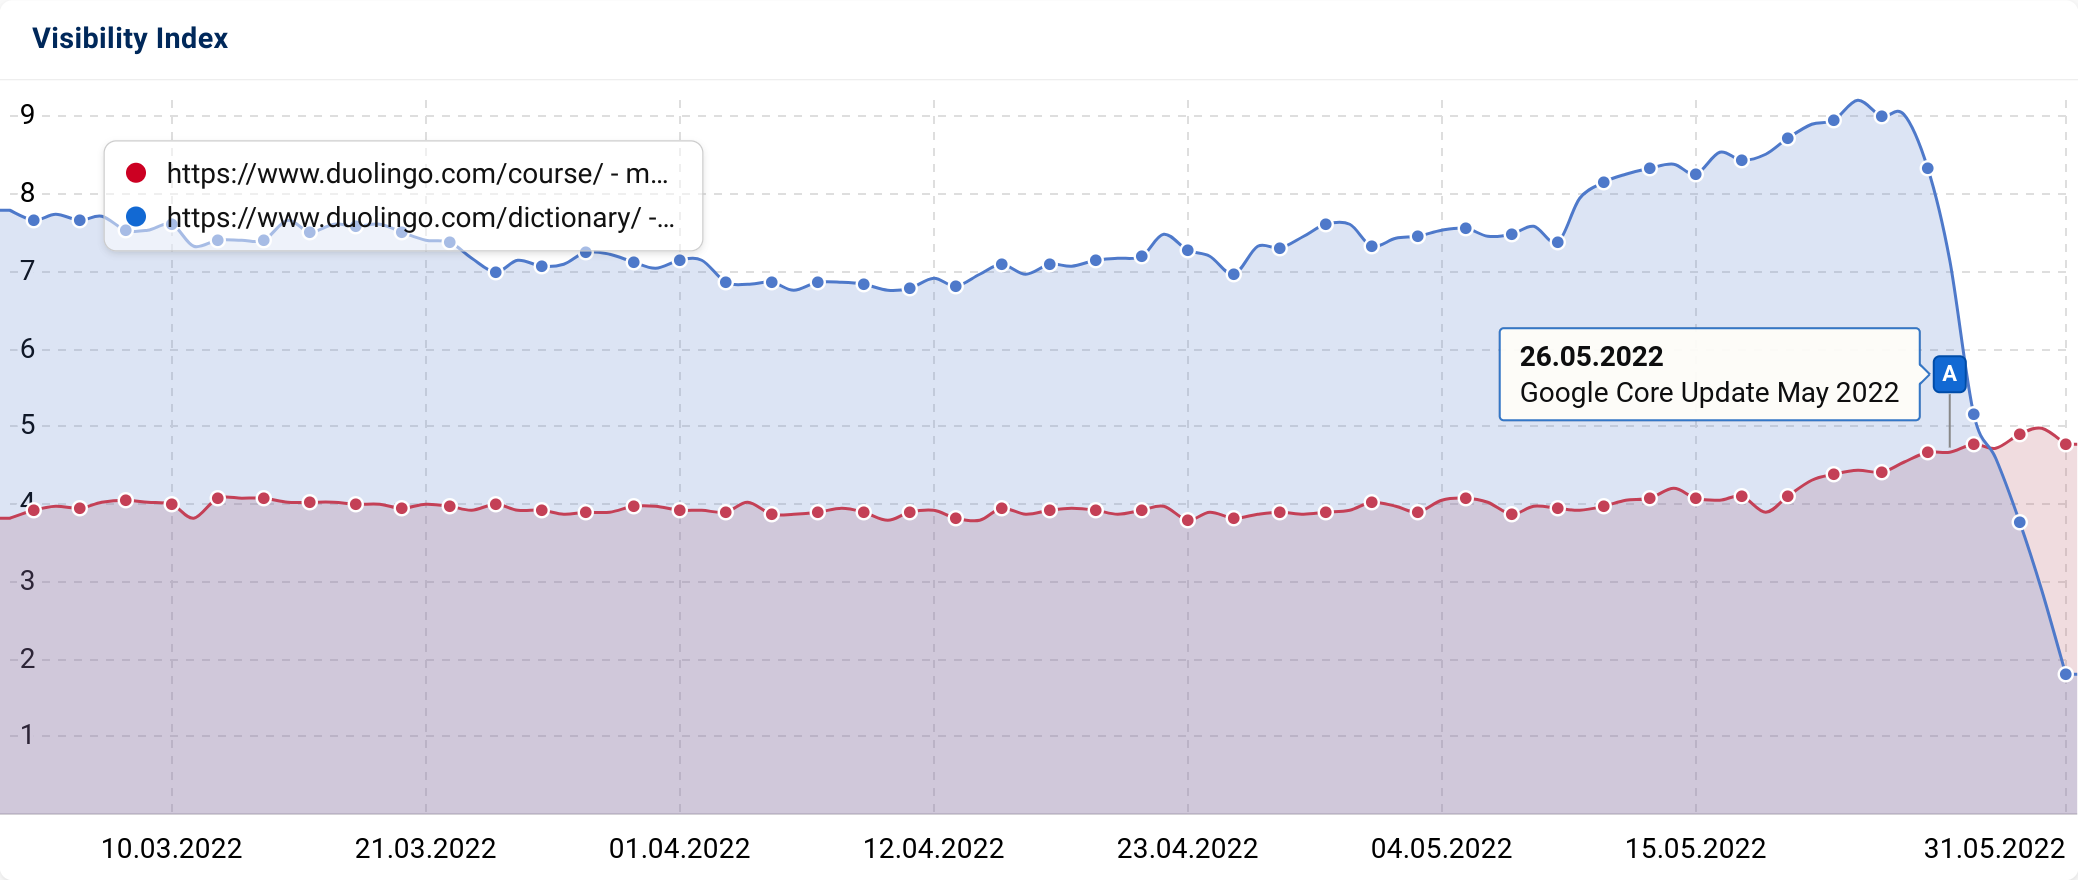
Among the UK data we found a good example of a site that has dropped at almost exactly the same day as the Core Update started. The Duolingo dictionaries have been taken offline. The rest of the site continues to rank, unaffected by the core update.
Analysing the causes of core update losses
After a number of days since the start of the core update roll-out, it’s now possible to draw the first conclusions from the data. But how should one actually go about doing this? Here are the typical analysis steps:
- At the start of the analysis it should be clear whether the changes in the visibility index are really due to the algorithm update from Google or whether major (technical) changes were made to the site at the same time by chance, as shown above.
- If you are sure that the changes are because of the Google update, it is a matter of identifying similarities : what does content that has lost or won have in common and how can this be transferred to other content in the future?
- Sometimes the losses or gains can be seen in individual directories, but ranking changes in the core updates are usually distributed across all URLs and rankings.
- At this point you should now look at the keywords and rankings that have lost the most since the start of the core update. In SISTRIX they are sorted in descending order by the extrapolated number of monthly, organic clicks for the domain. In this case dunelm.com:
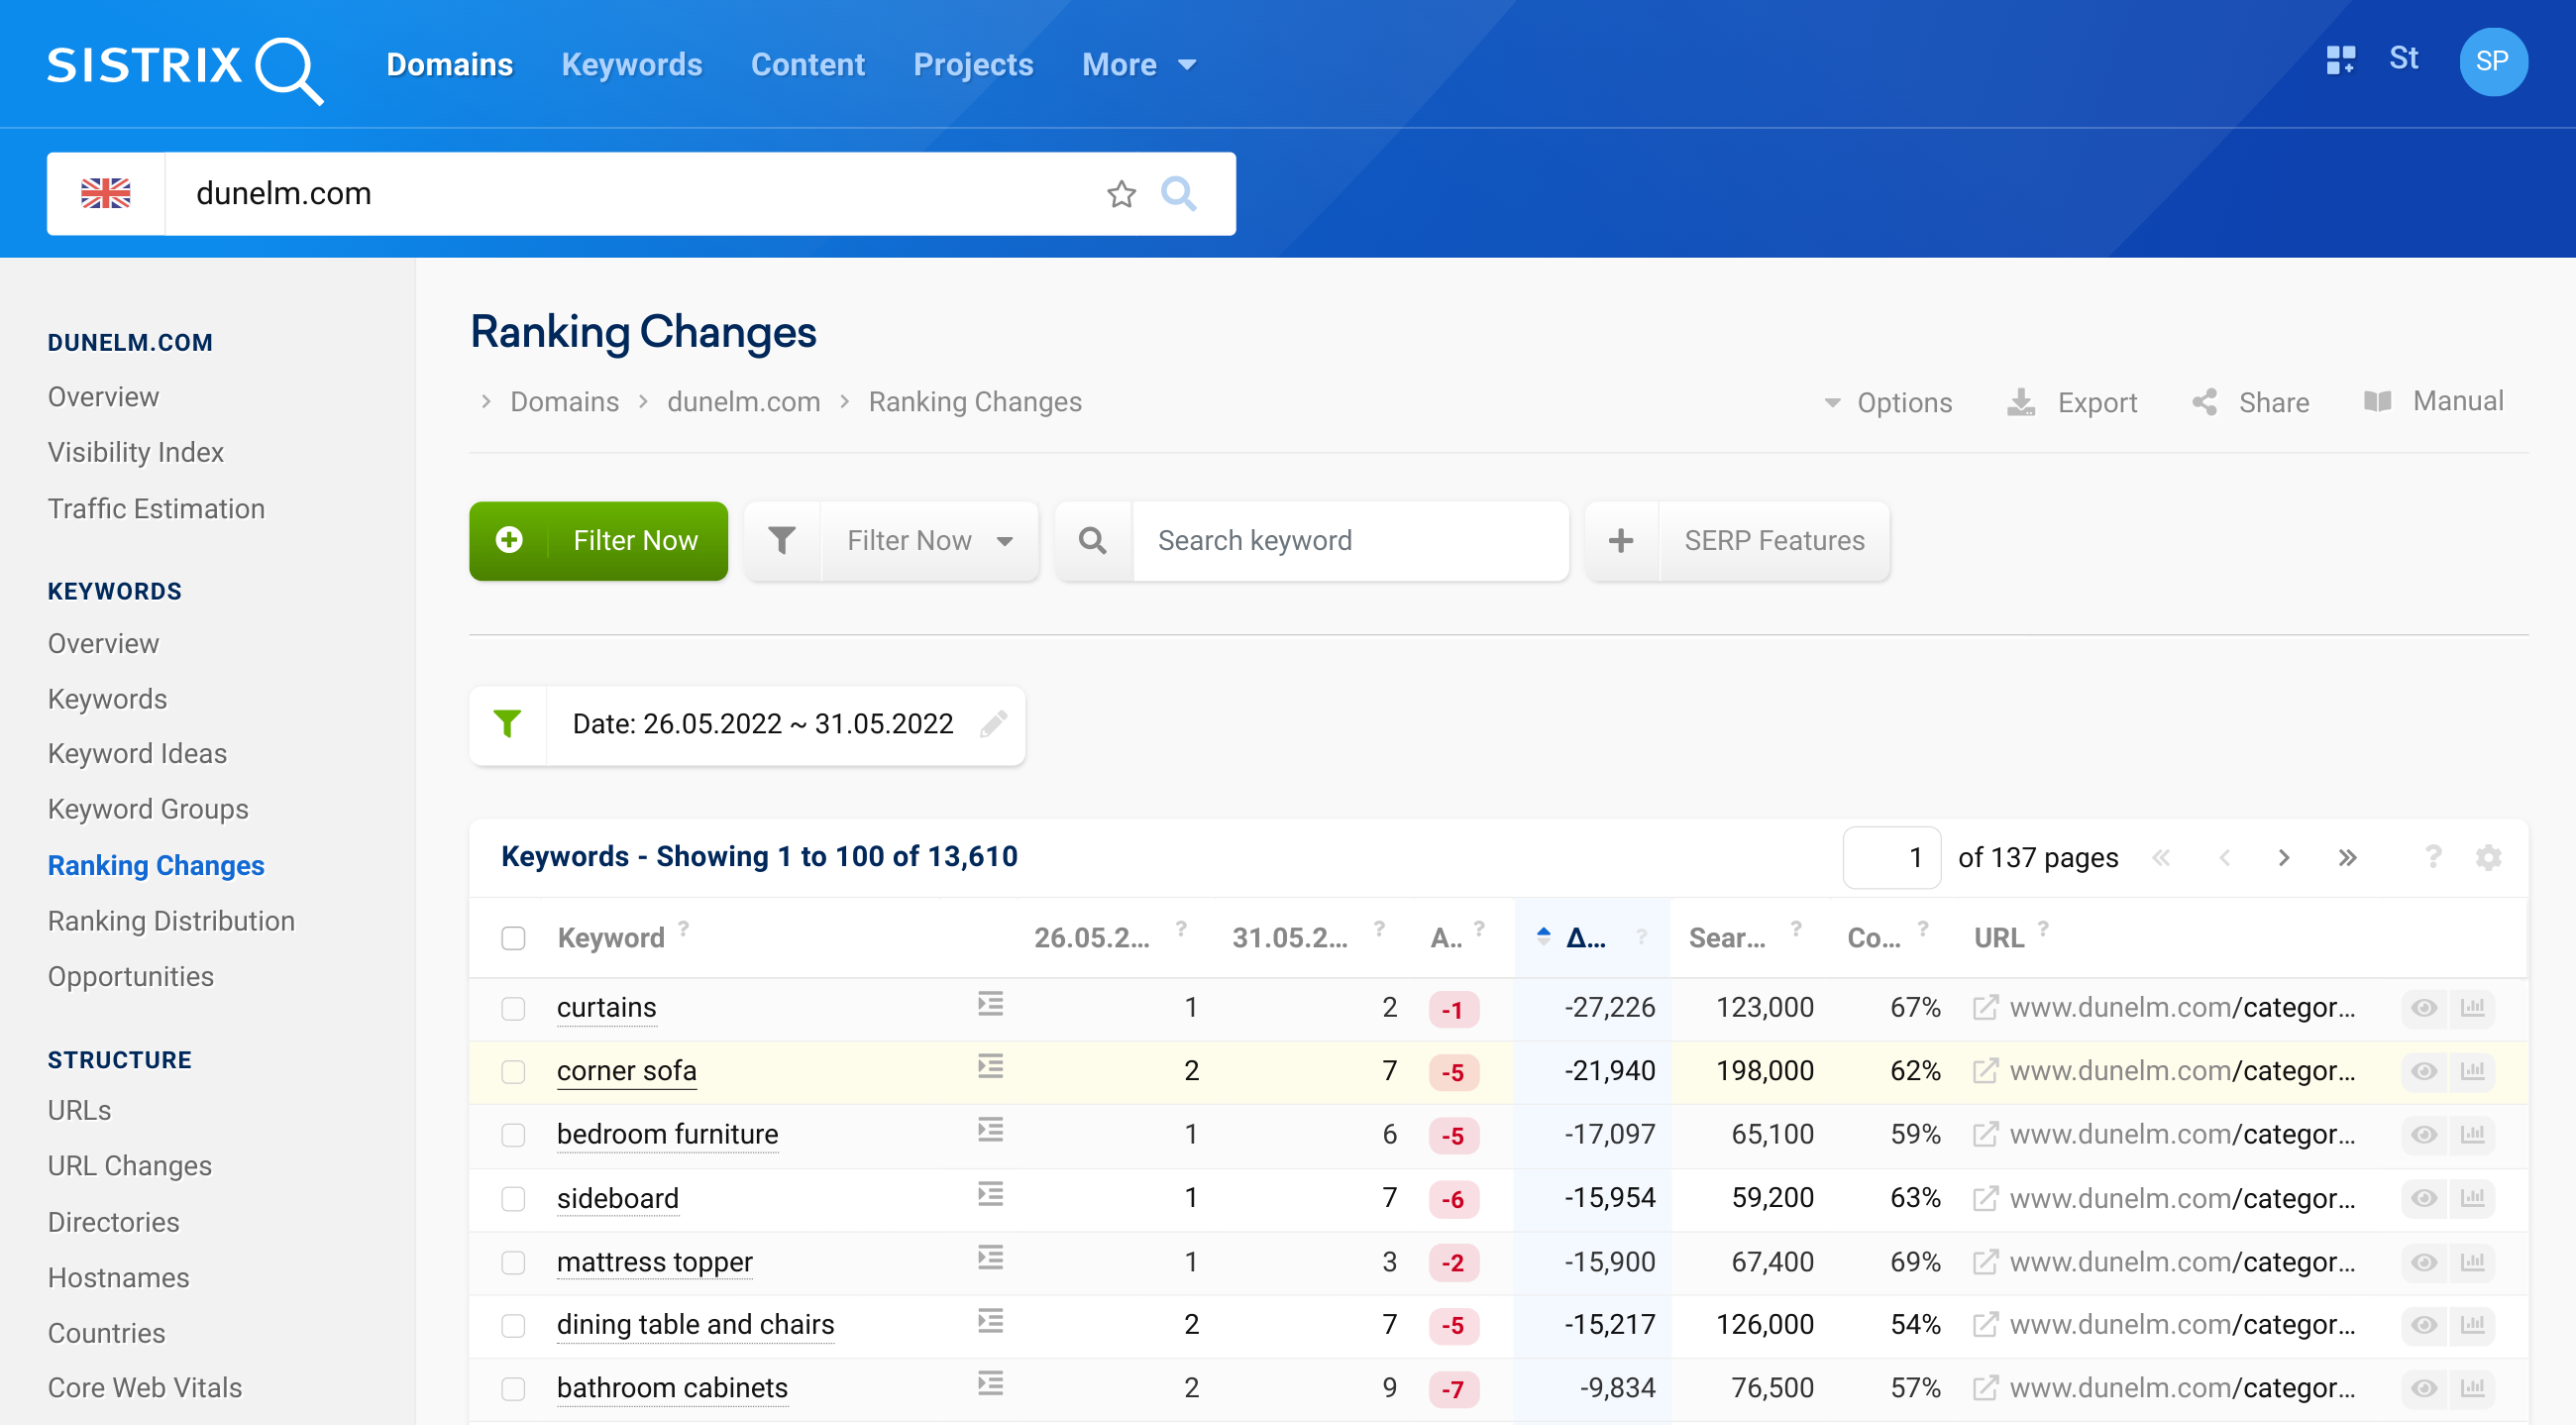
- Interesting, and important losses can be found in page 1 movements. Anyone who remembers typical CTR curves for clicks in the SERPs knows how severe the loss of clicks is when dropping from position 1. Let’s take an example: corner sofa 1 .
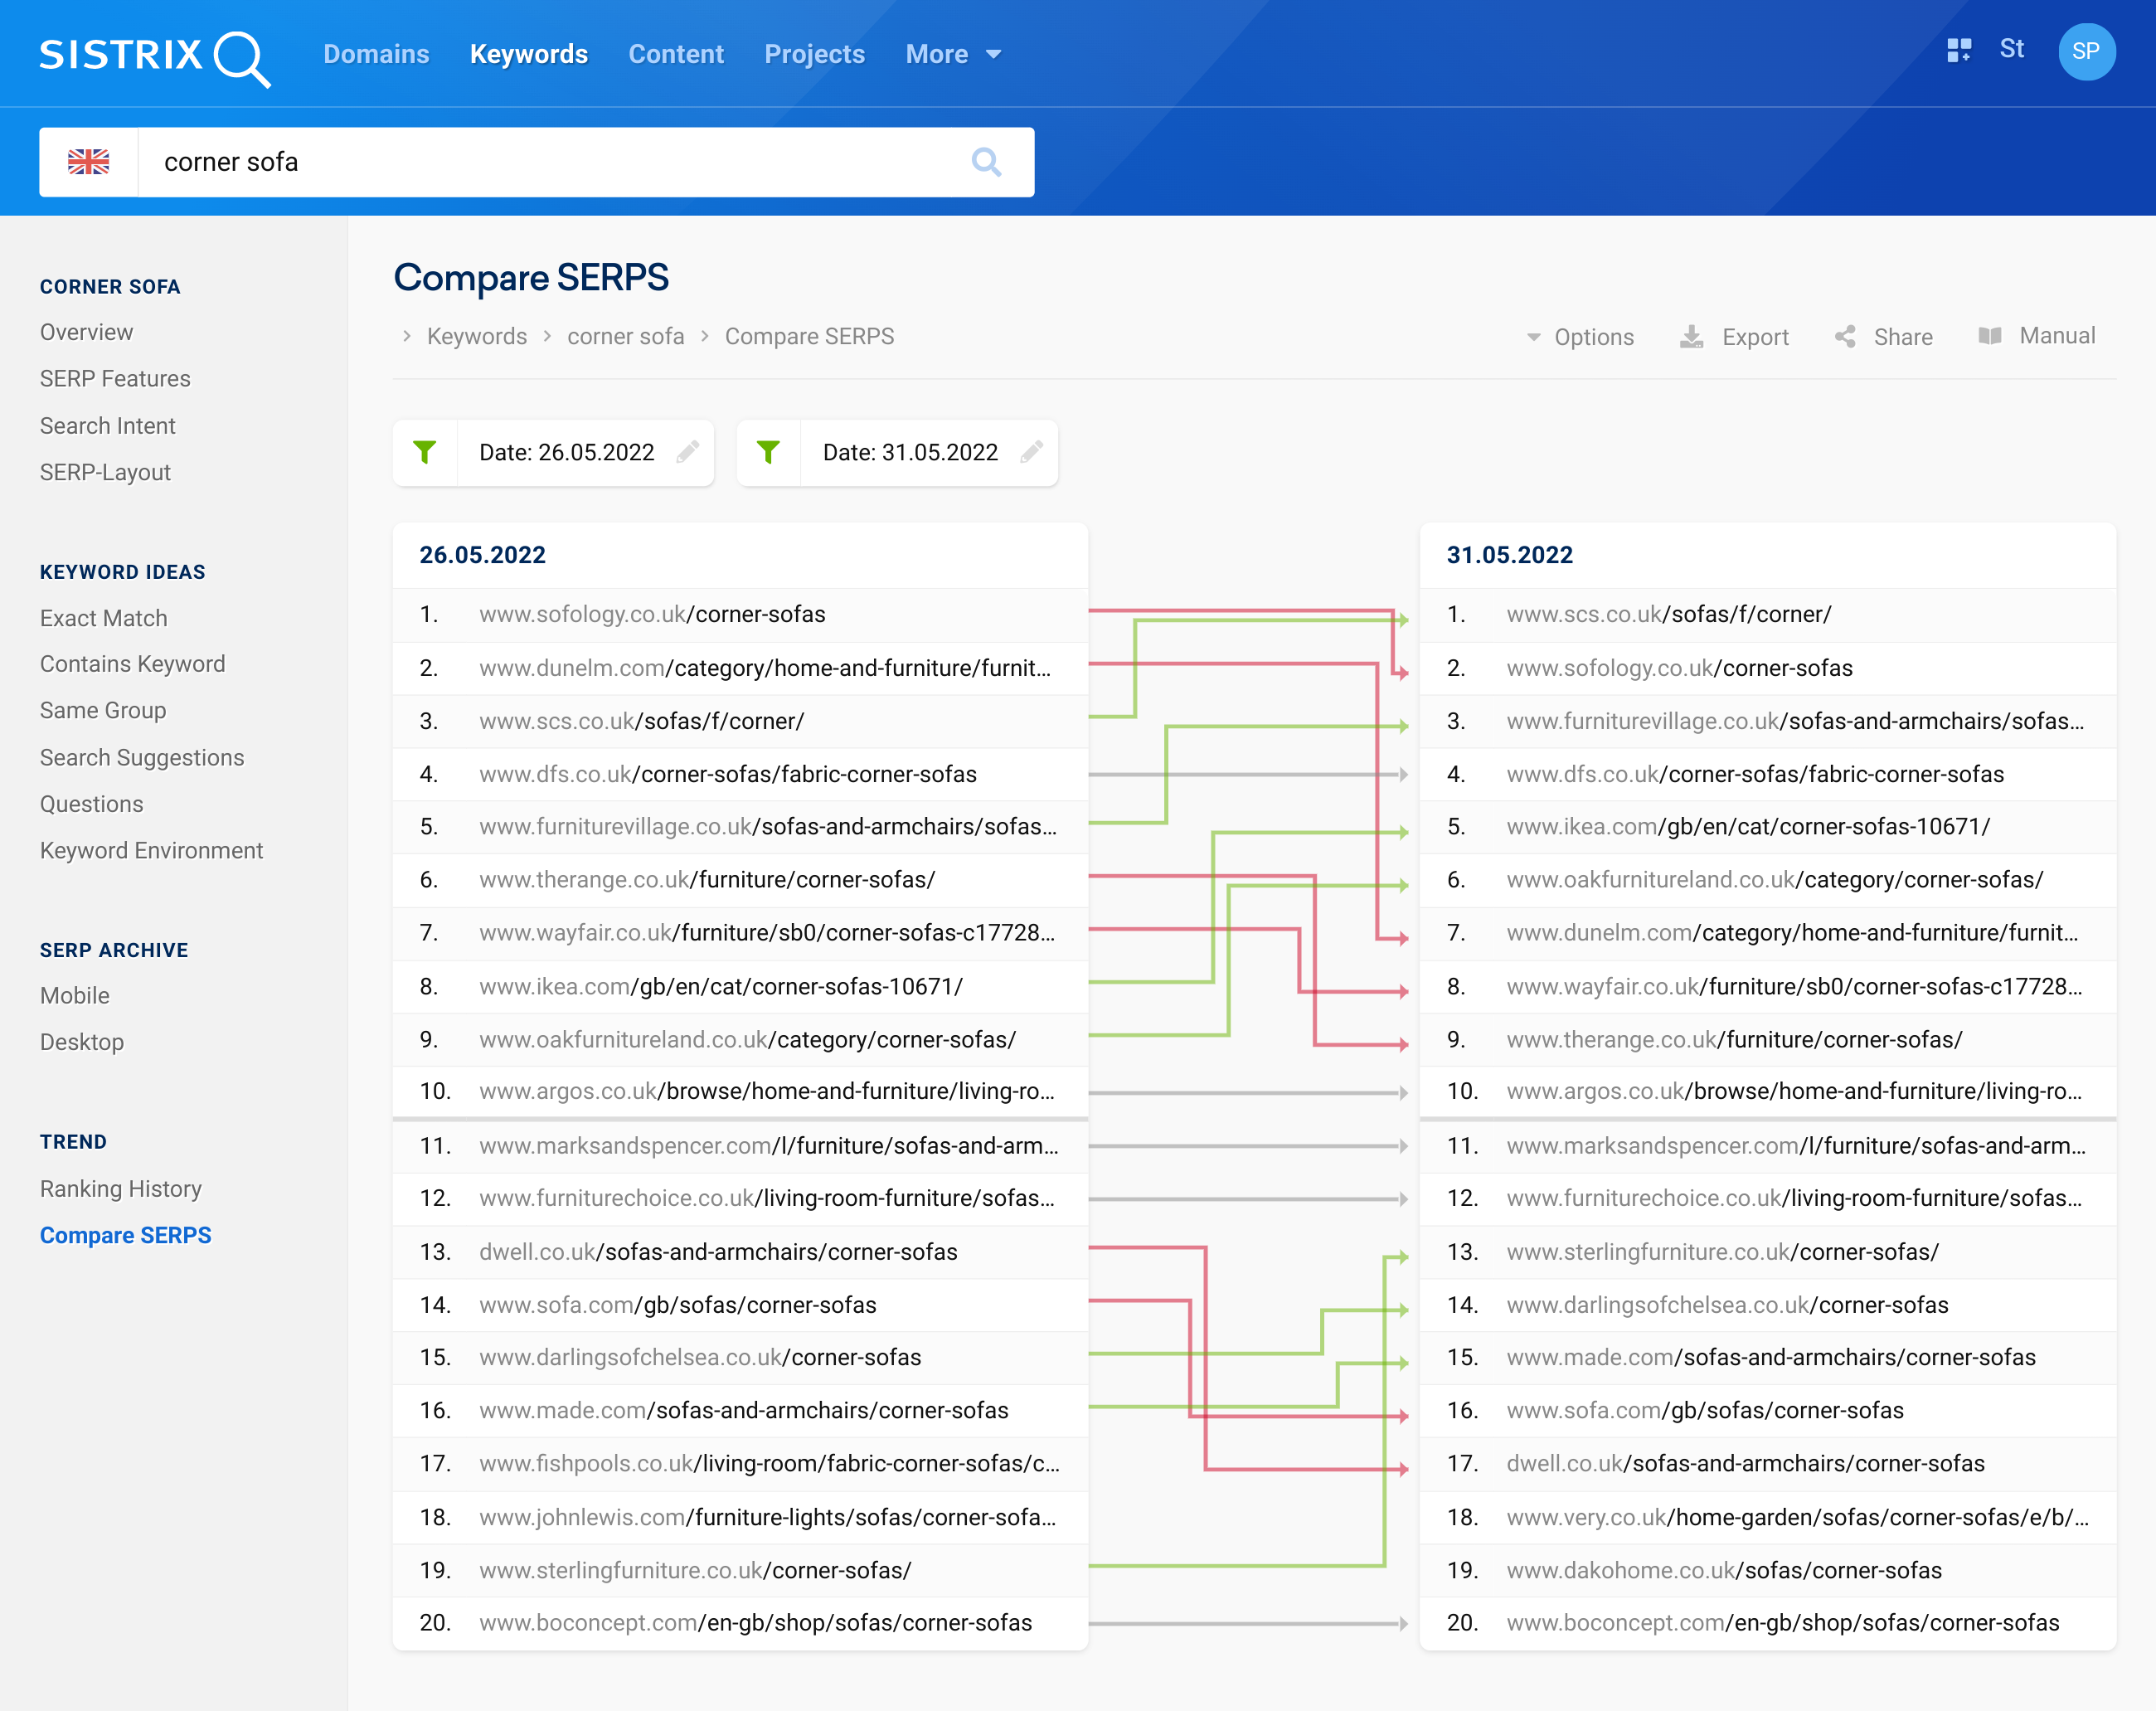
- In the SERP comparison, we can get a view of how other URLs have changed during this period. Here you can see very clearly that while dunelm.com has lost positioning from 2 to 7, other sites have had a boost:
- In the final step, assess the mobile content (84% of searches for this keyword are via mobile) from the perspective and intent of a user. Causes may be immediately apparent, or more subtle, such as style, or, perhaps in this case, a link away from the dunelm.com ranking page. One thing to note in this case – was the link also added recently?


UK Retail winners and losers
Using our Oxford Street tracker, we’ve extracted the top 10 winners and losers in the May 2022 Core Update. The winners are going to be disappointing for UK-based ecommerce companies. This latest boost for solidifies the position of Amazon and Ebay on the high street.
| Domain | VI 26.05.2022 | VI 30.05.2022 | VI change | Percentage change |
|---|---|---|---|---|
| amazon.co.uk | 2821.72 | 3064.36 | 242.64 | 8.60% |
| ebay.co.uk | 1013.84 | 1087.33 | 73.49 | 7.25% |
| etsy.com | 578.26 | 616.68 | 38.42 | 6.64% |
| amazon.com | 177.69 | 202.81 | 25.12 | 14.14% |
| asos.com | 100.21 | 111.64 | 11.44 | 11.41% |
| argos.co.uk | 490.89 | 499.94 | 9.05 | 1.84% |
| houseoffraser.co.uk | 66.68 | 74.78 | 8.10 | 12.15% |
| very.co.uk | 44.40 | 50.22 | 5.81 | 13.09% |
| zalando.co.uk | 25.56 | 31.30 | 5.74 | 22.47% |
| gumtree.com | 70.63 | 76.28 | 5.66 | 8.01% |
The losers also include established players, and all of them are UK based businesses apart from Wayfair.
| Domain | VI 26.05.2022 | Vi 30.05.2022 | VI Change | Percent change |
|---|---|---|---|---|
| dunelm.com | 89.90 | 71.05 | -18.85 | -20.96% |
| screwfix.com | 192.78 | 177.24 | -15.54 | -8.06% |
| johnlewis.com | 233.36 | 224.05 | -9.31 | -3.99% |
| hobbycraft.co.uk | 40.76 | 34.92 | -5.84 | -14.33% |
| homebase.co.uk | 28.23 | 22.46 | -5.77 | -20.45% |
| ao.com | 35.45 | 29.74 | -5.71 | -16.10% |
| debenhams.com | 30.43 | 25.07 | -5.37 | -17.63% |
| superdrug.com | 45.88 | 40.59 | -5.29 | -11.52% |
| notonthehighstreet.com | 41.83 | 36.99 | -4.84 | -11.57% |
| wayfair.co.uk | 136.53 | 132.04 | -4.48 | -3.28% |