
After exploring the winners and losers industry-wide, we’re now putting the retail sector under the microscope. COVID-19 has had a considerable impact across multiple sectors over the last couple of years, with retailers worldwide experiencing peaks and troughs. But did the picture get rosier as we moved through 2021?
We’ve analysed the data for 250 retail domains to understand which have succeeded and which have suffered due to mistakes, competitors and Google’s algorithm.
Background: Digital retail in the UK
There is no question about it. Over the last two years, digital retail has evolved from a nice-to-have to a must-have for most players in the industry. ONS, the government’s body for statistics, has reported that the number of retail sales made online has increased by 6.7% over the last 24 months (from 21% to 27.7%).
One website that has benefitted from this transformation is next.co.uk. Next, the leading fashion retailer with the highest UK search visibility, is estimated to be attracting approximately 50 million organic clicks monthly, with their online sales far exceeding other sales.
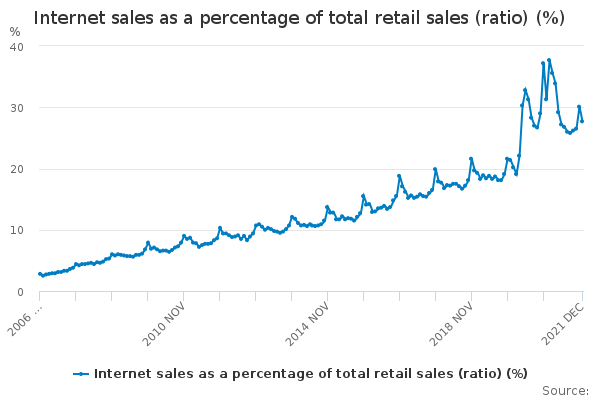
In January 2022, online sales increased by 13.1% in the grocery sector (compared to December 2021). This is particularly interesting given that the UK has had virtually no COVID restrictions in place.
It is evident that Page 1 of the SERPs is becoming more than just a significant sales opportunity; it is transforming into the digital equivalent of Oxford Street! Companies are keen for Page 1 to showcase their brand’s virtual storefront, and if it is not there, they are losing the eyeballs of millions of potential customers.
If only there were more than 10 organic positions on the first page. The space may be rent-free, but our digital landlord, Google, is the one who determines who can stake their claim on them!
On this topic, we must mention fast-fashion retailer Primark. They may still refuse to offer online sales; however, they have announced a website revamp to provide users with more informational content. Perhaps they have realised the benefit of being in the search results when customers look for product details, images and availability? The new website is due to launch soon, and we will be keeping an eye on that throughout 2022.
This report looks at the total shopfront sizes for one million UK search results, based on the Visibility Index data (share of search values that are processed daily). Our data provides transparency of the SERP landscape, and through this, you can learn about leading examples, Google’s changes and the domain that might not have had the correct SEO care applied to them.
Retail risers
The highest risers in the visibility stakes are marketplaces that provide quality products at convenience and speed.
Etsy
Etsy.com may have lost favour with sellers recently due to the introduction of additional fees and their controversial Star Seller scheme. However, their 28.7% year on year increase in Google visibility suggests that they are still the go-to place for those looking for handmade and vintage items.
Over the last five years, they have experienced continual growth, and out of all marketplaces analysed, Etsy saw the most considerable absolute change in Visibility Index points from 2020 to 2021 (+98.2).
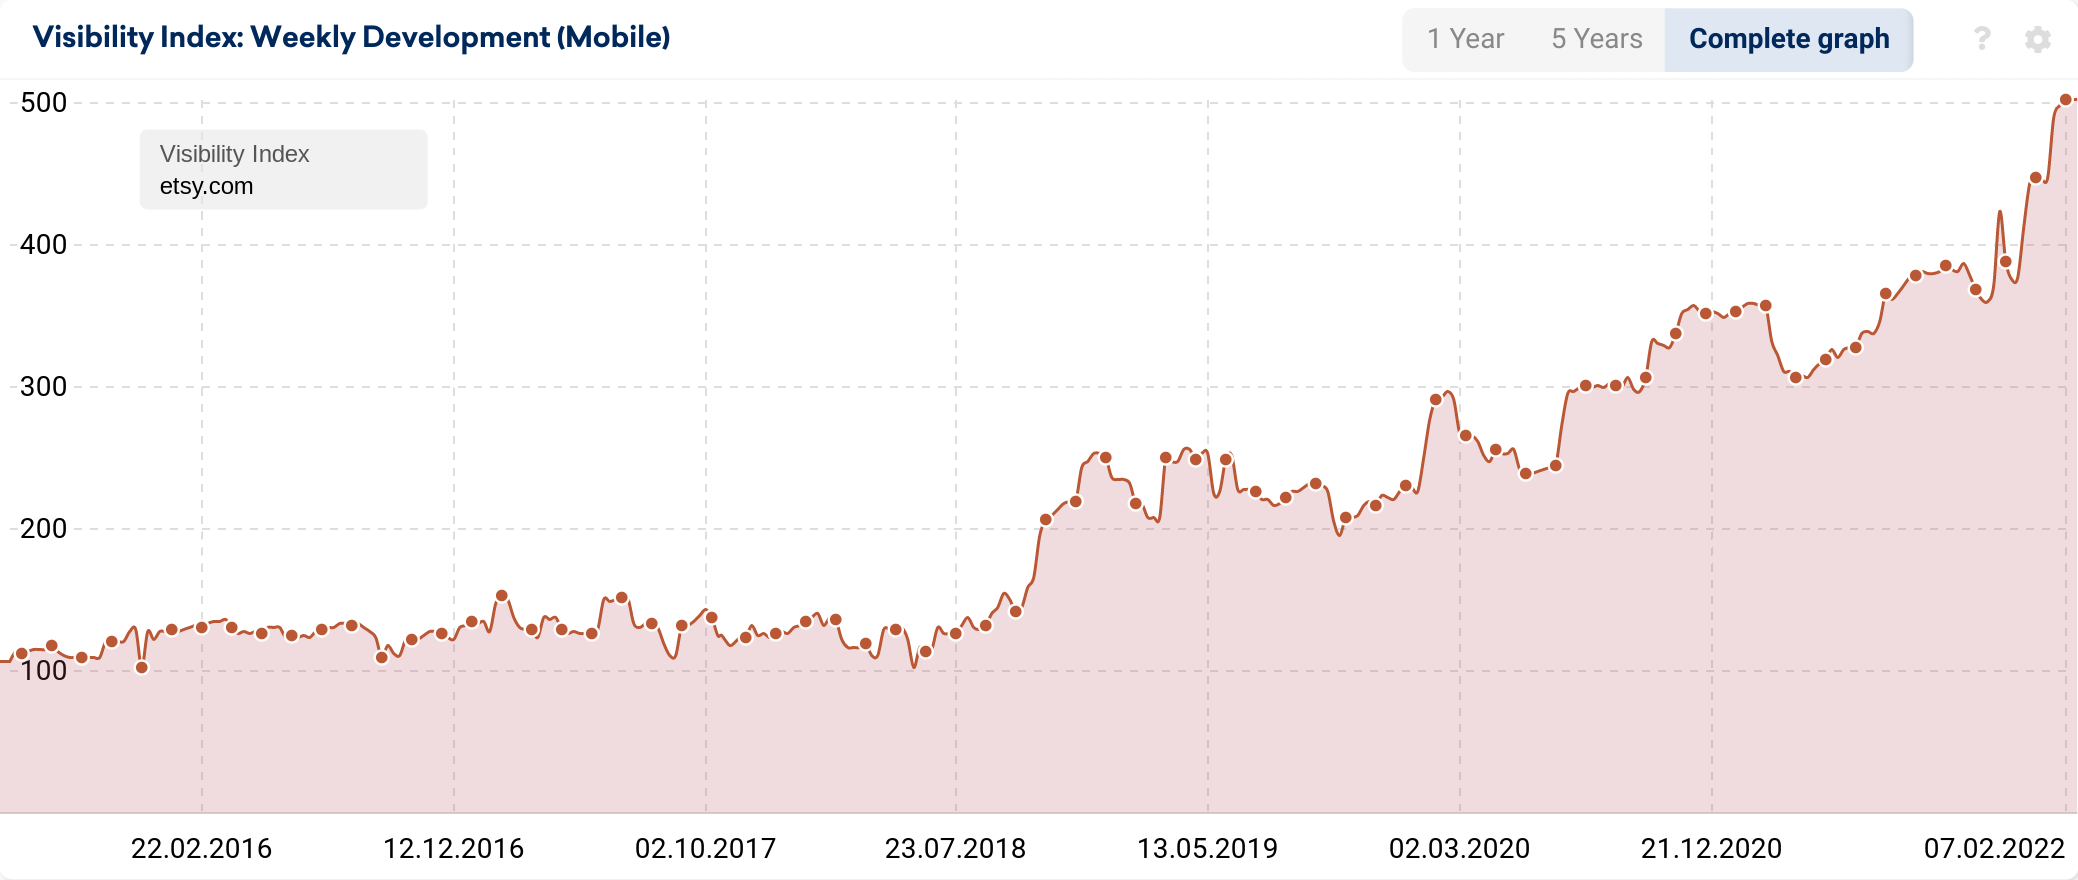
Following the December 2020 Core Update, Etsy.com did see a temporary decrease in organic visibility. However, this improved in April 2021 when Google launched the first of two Product Review Updates.
In December 2021, when the second Product Review Update went live, the domain got its second wind, and as of 7th February 2022, Etsy.com’s Google visibility is at its all-time highest level.
Secret Sales
Secret Sales by name, but not by nature! Secretsales.com has been far from secretive on the UK’s Google search engine results. In 2021, Secret Sales saw the highest percentage increase in visibility (+183.2%).
Secretsales.com is an online fashion outlet that sells designer brands at discounted prices. Interestingly, unlike Etsy, Secret Sales’ journey to the top has been more turbulent.
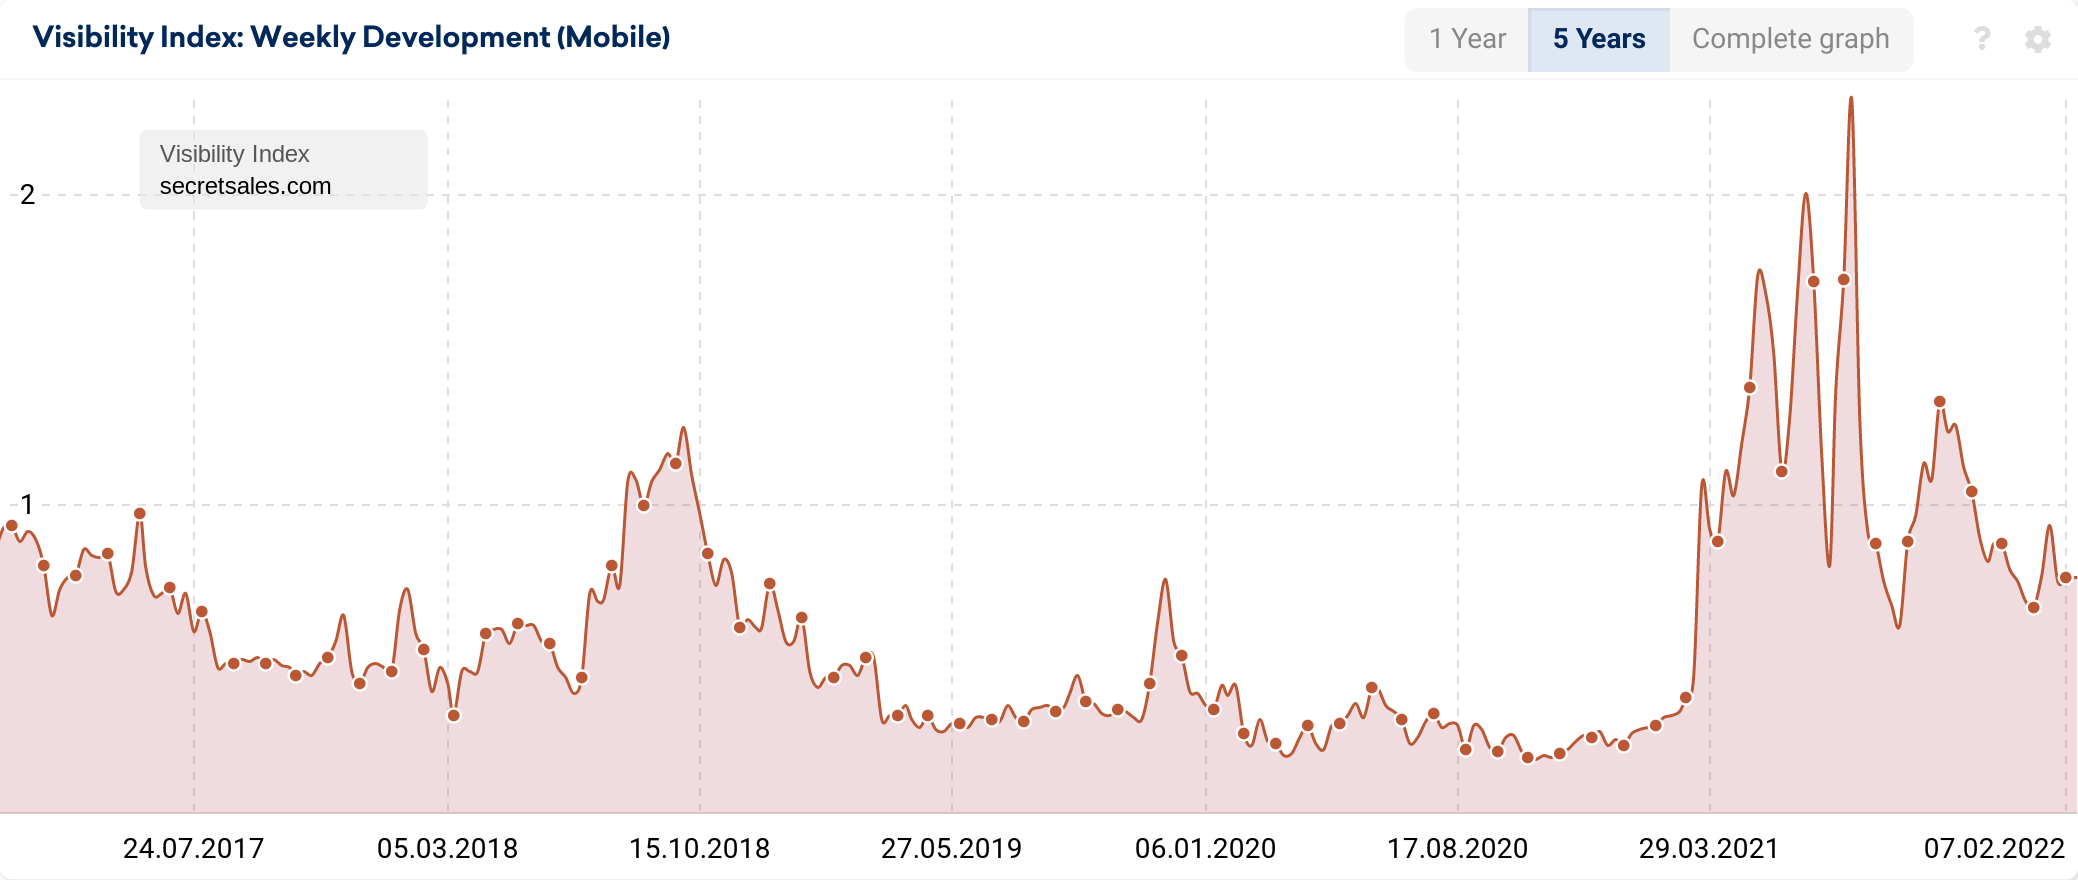
Although they have seen the highest percentage visibility growth over time, including from 2020 to 2021, their organic visibility at the beginning of 2022 was significantly lower than three other occasions recorded throughout 2021.
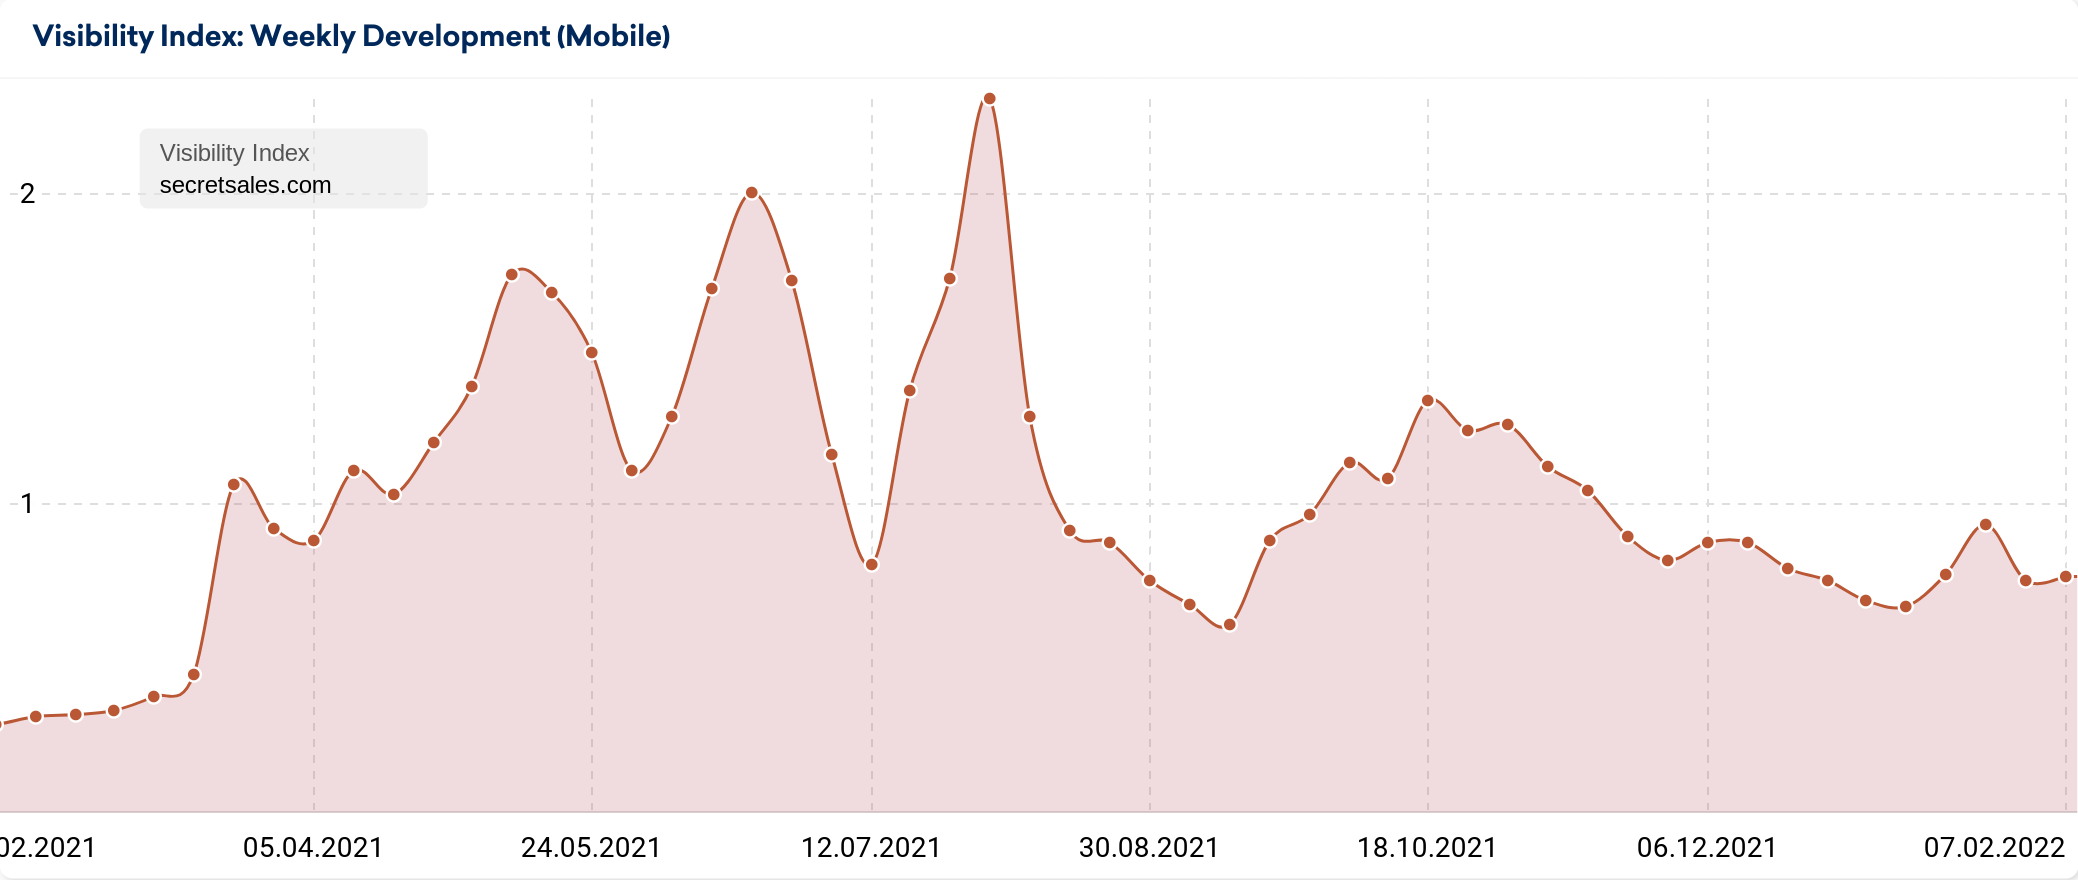
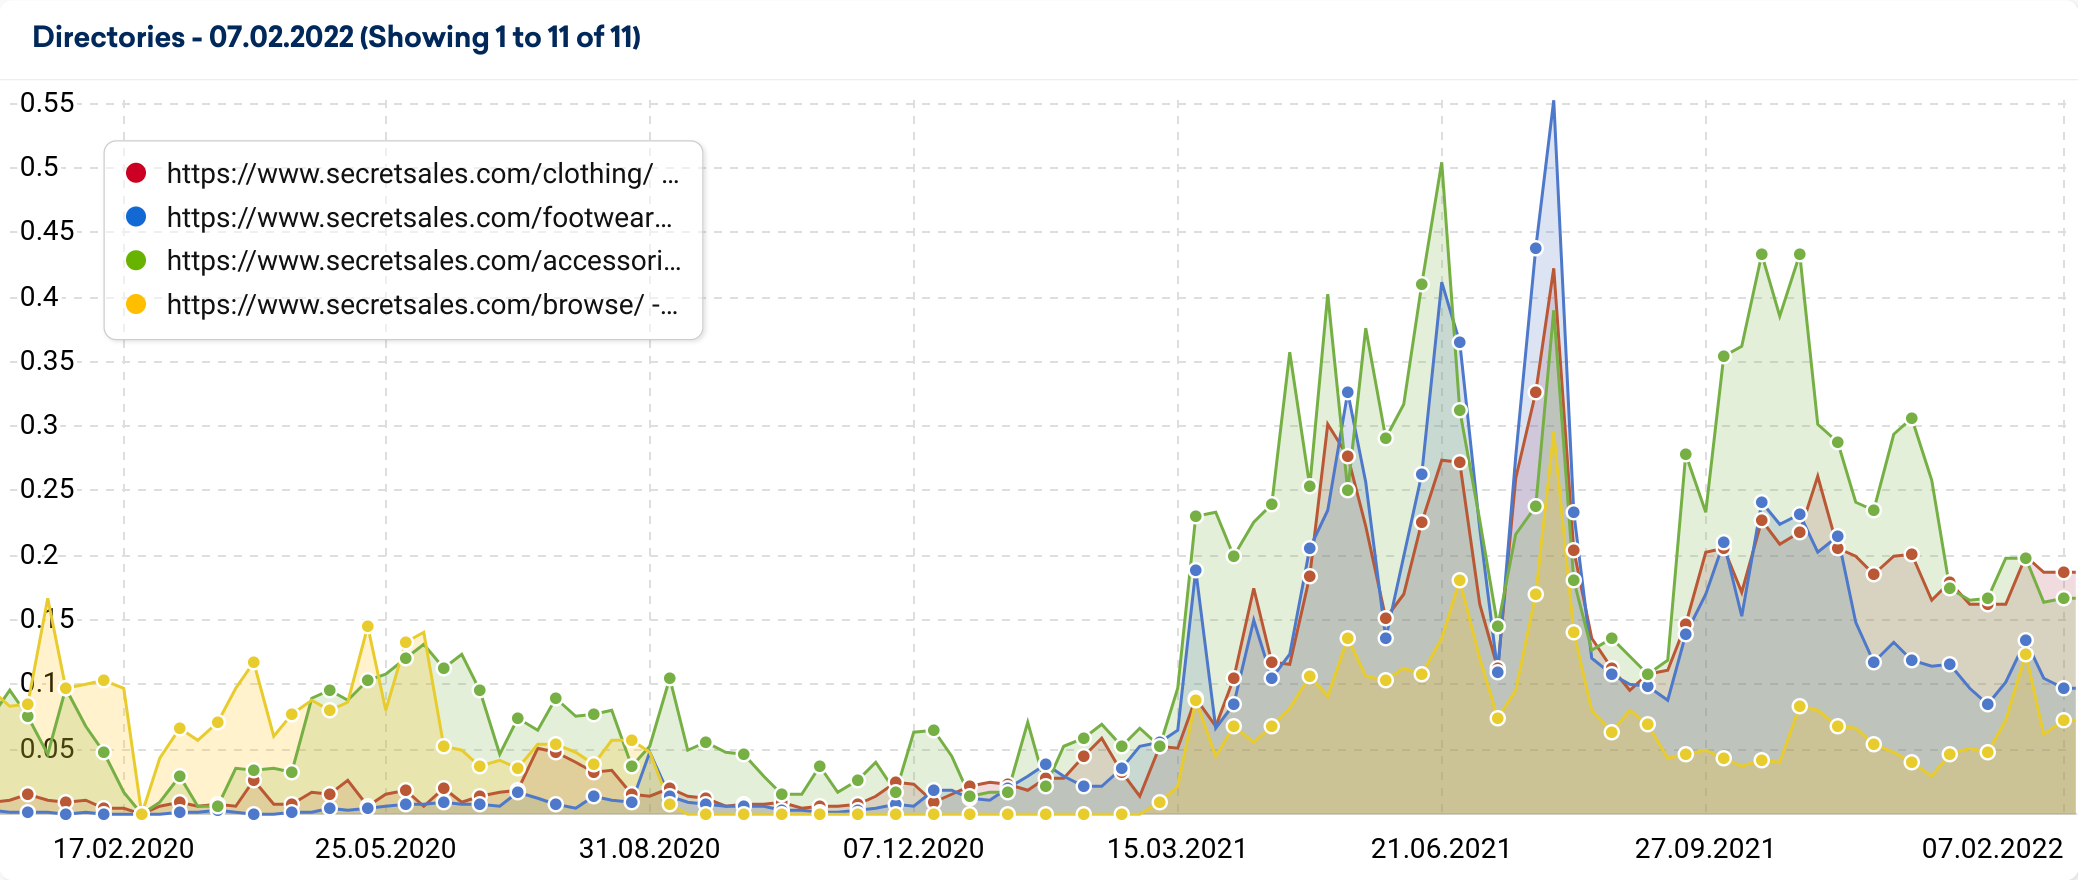
There were notable influxes in secretsales.com’s visibility on 10th May (following the April Product Review Update), 21st June (just before the June Core Update) & 2nd August (approximately one month after the start of July Core Update rollout).
At its highest point, secretsales.com’s Visibility Index score reached 2.31. As of early 2022, this has dropped to 0.24 (-89.6%).
From delving deeper into the website’s visibility data, it is clear that historically lower-performing directories – such as Browse and Footwear – saw an improvement in visibility around these particular dates too.
Reviewing historical versions of the site also confirms that Secret Sales had a brand refresh in early/mid-2020, updating their logo and modernising their website design. As part of this refresh, they also changed the website structure.
With this knowledge, the year on year visibility increase is likely due to the ripple effect of enriching product and category pages as part of the migration.
Top 10 list of 2021 retail winners
Based on 250 retail domains tracked, these are the top 10 winning domains by percentage and absolute visibility in 2021. First, the absolute winners:
| Domain | 2021-01-04 | 2022-01-03 | Absolute VI gain |
|---|---|---|---|
| etsy.com | 349.92 | 448.13 | 98.21 |
| johnlewis.com | 148.58 | 236.53 | 87.95 |
| argos.co.uk | 390.89 | 453.19 | 62.30 |
| amazon.co.uk | 2,151.62 | 2,182.02 | 30.41 |
| gumtree.com | 93.34 | 121.90 | 28.56 |
| screwfix.com | 129.79 | 153.40 | 23.61 |
| houseoffraser.co.uk | 48.02 | 65.36 | 17.34 |
| boots.com | 74.37 | 90.10 | 15.74 |
| boohoo.com | 30.27 | 44.59 | 14.33 |
| notonthehighstreet.com | 20.45 | 34.43 | 13.98 |
| diy.com | 84.19 | 98.17 | 13.98 |
| marksandspencer.com | 34.87 | 48.74 | 13.87 |
| halfords.com | 58.70 | 72.15 | 13.45 |
| asda.com | 72.80 | 86.16 | 13.36 |
| dunelm.com | 77.15 | 88.91 | 11.76 |
| asos.com | 102.46 | 113.76 | 11.30 |
| therange.co.uk | 66.16 | 76.80 | 10.64 |
| ao.com | 25.97 | 34.32 | 8.35 |
| wayfair.co.uk | 128.38 | 135.64 | 7.26 |
| wilko.com | 32.17 | 38.99 | 6.81 |
| sainsburys.co.uk | 41.53 | 48.09 | 6.56 |
| gear4music.com | 34.27 | 40.56 | 6.30 |
| alibaba.com | 12.56 | 18.85 | 6.29 |
| aliexpress.com | 12.25 | 18.39 | 6.13 |
| wiggle.co.uk | 17.02 | 22.98 | 5.96 |
In the table below, the winners by percentage VI gain during 2021.
| Domain | 4 Jan 2021 | 3 Jan 2022 | Percentage VI gain |
|---|---|---|---|
| secretsales.com | 0.24 | 0.69 | 183% |
| nastygal.com | 2.12 | 5.77 | 172% |
| jackwills.com | 0.45 | 1.18 | 161% |
| nordstrom.com | 2.52 | 6.46 | 156% |
| mccolls.co.uk | 0.07 | 0.19 | 155% |
| annsummers.com | 0.20 | 0.49 | 146% |
| fortnumandmason.com | 0.84 | 1.90 | 125% |
| mango.com | 1.50 | 3.25 | 117% |
| booths.co.uk | 0.21 | 0.44 | 107% |
| superdry.com | 0.68 | 1.28 | 88% |
| hamleys.com | 1.04 | 1.94 | 86% |
| mandmdirect.com | 2.73 | 5.03 | 84% |
| jdwilliams.co.uk | 0.95 | 1.70 | 78% |
| whistles.com | 0.74 | 1.29 | 74% |
| accessorize.com | 3.09 | 5.35 | 73% |
| accessorize.com | 3.09 | 5.35 | 73% |
| wish.com | 4.93 | 8.42 | 71% |
| notonthehighstreet.com | 20.45 | 34.43 | 68% |
| monsoon.co.uk | 2.75 | 4.62 | 68% |
| coop.co.uk | 2.74 | 4.58 | 67% |
| ohpolly.com | 0.56 | 0.90 | 61% |
| inthestyle.com | 0.68 | 1.09 | 60% |
| johnlewis.com | 148.58 | 236.53 | 59% |
| morrisons.com | 8.71 | 13.58 | 56% |
| coastfashion.com | 1.70 | 2.64 | 55% |
Retail fallers
Although Secret Sales saw great success, this wasn’t the same story for all clothing brands. Many of the websites that experienced year on year decreases in visibility were those specialising in fashion and homeware.
Matalan
Whilst some clothing websites thrived, others fell, one of those being matalan.co.uk. Matalan is known for selling clothing and homeware at a much lower price than typical high street stores.
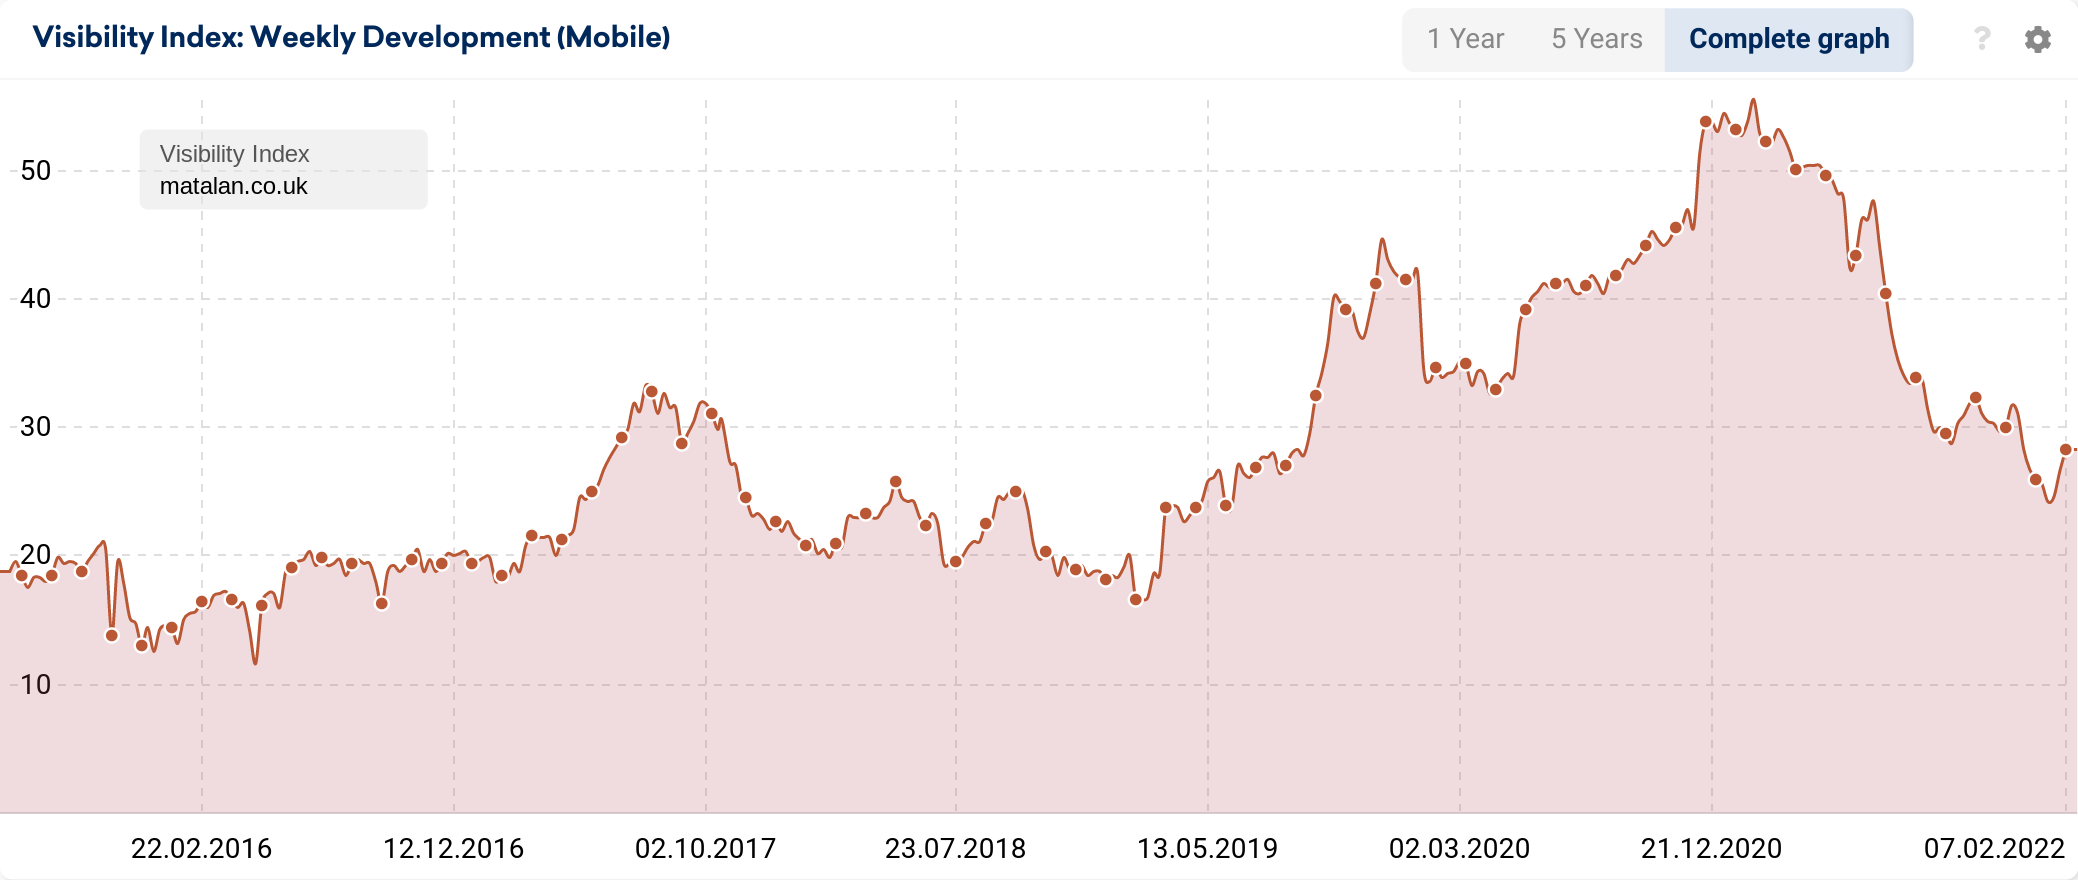
Since 2016, matalan.co.uk has experienced gradual organic growth. However, this positive trend tailed off following the April 2021 Product Review Update. Since then, their authority on Google search engines has continued to dwindle, resulting in a 52.3% SERP visibility decrease compared to 2020.
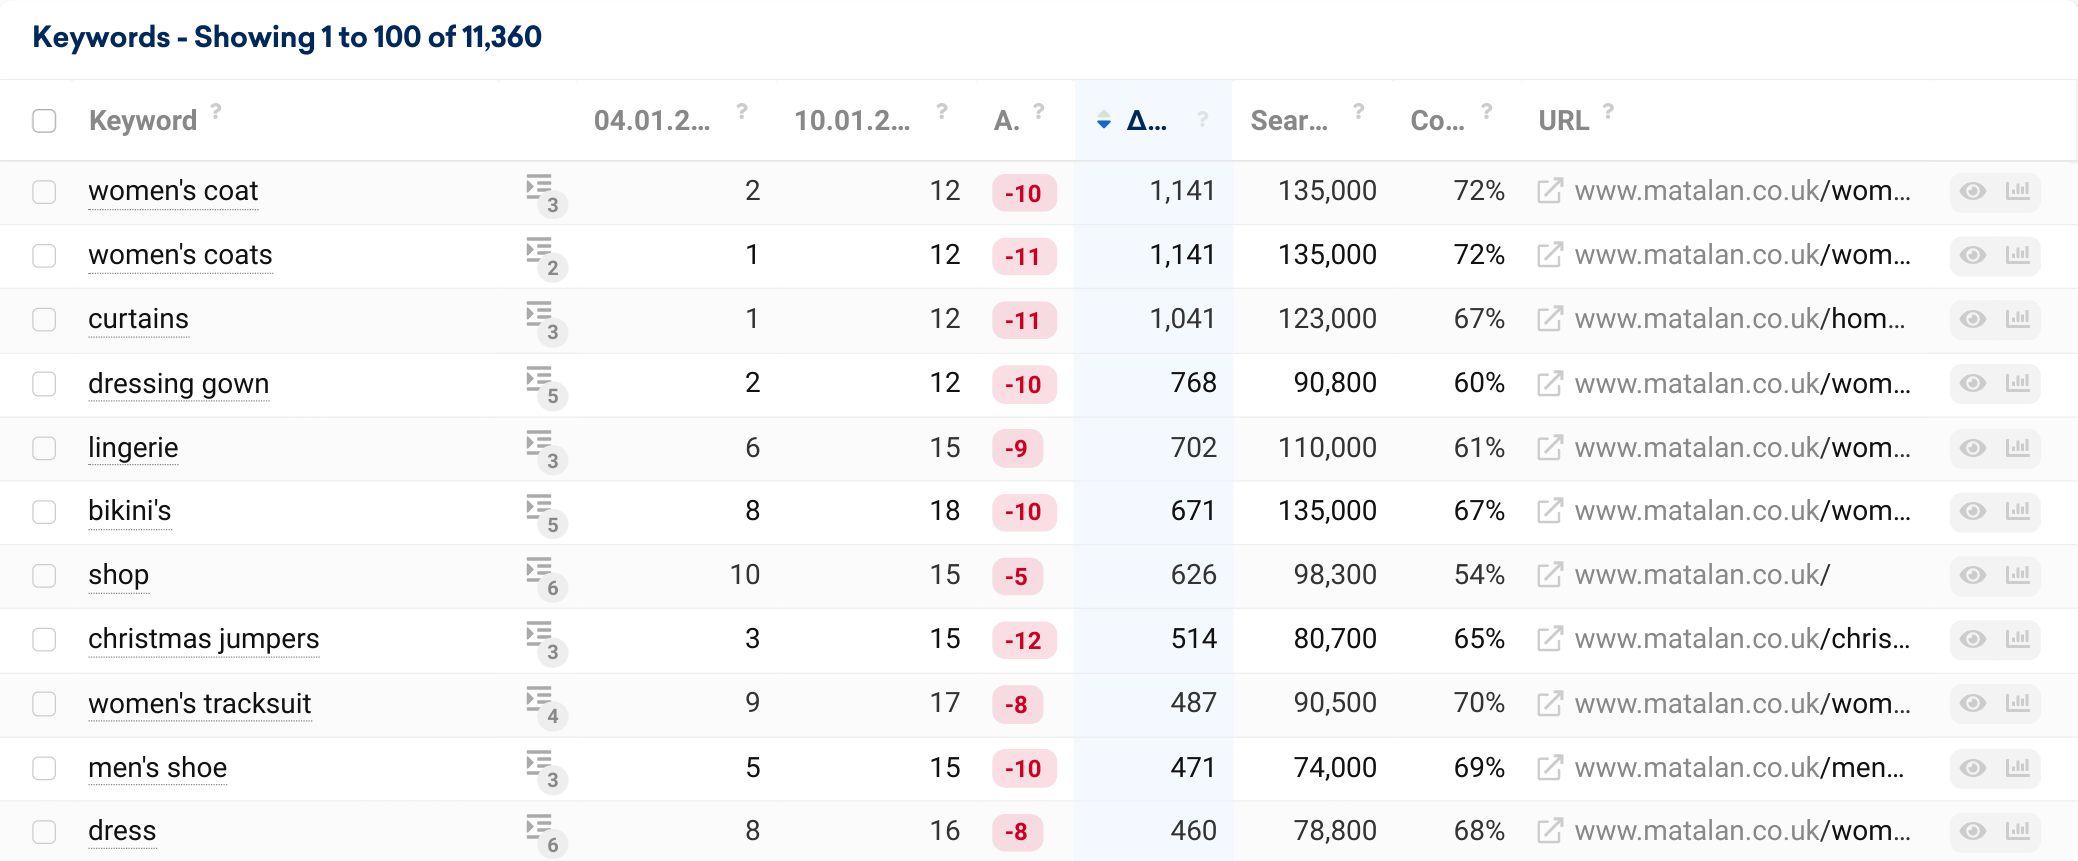
A closer inspection of Matalan’s keyword rankings indicates that year on year, they have lost top 100 rankings for 159,931 of the 50 million keywords we regularly track in the UK. We registered 11,360 keywords that dropped out, including some extremely significant keywords.
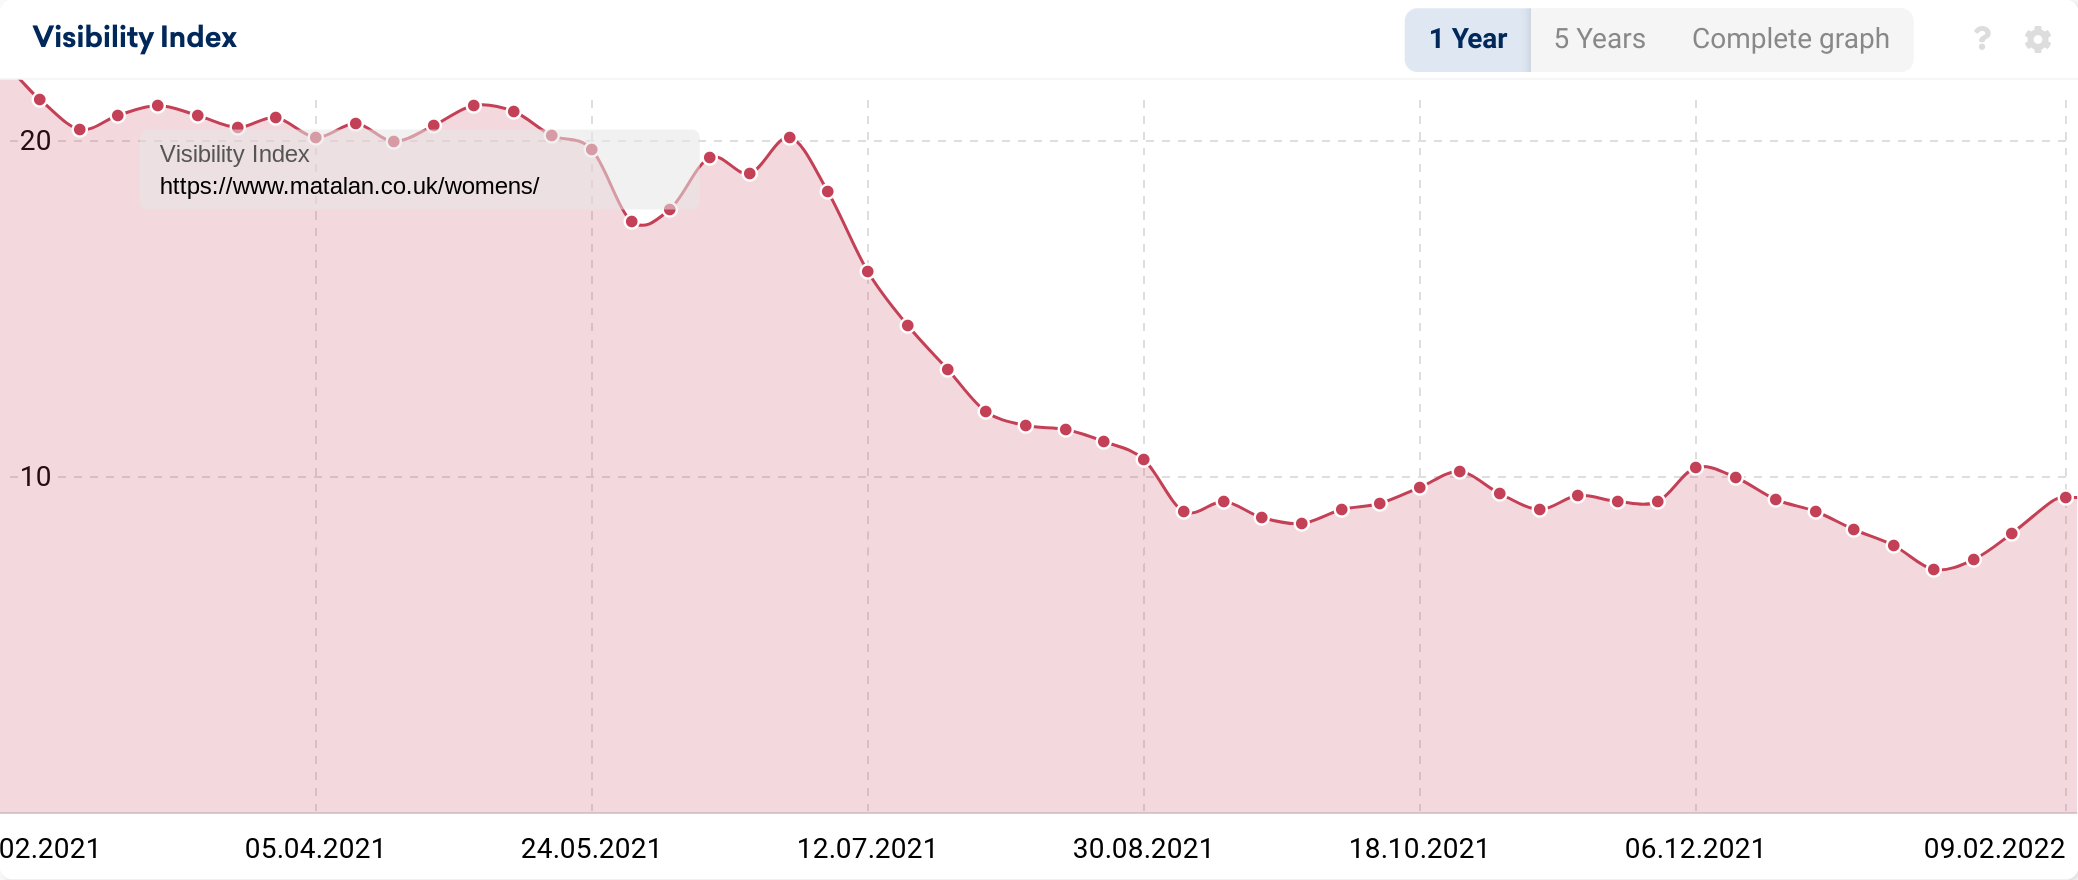
These keyword ranking decreases and drop-offs have had a significant impact on the visibility of Matalan’s highest performing directory – /womens. Whilst this situation has started to improve in early 2022, this directories’ visibility decreased from 20.7 to 8.43 (-12.3 VI points/59.2%) year on year.
Skechers
The Google search visibility of footwear specialists Skechers was also kicked to the curb in 2021. The Visibility Index score for their skechers.com domain decreased from 1.24 to 0.30 (-75.8% year on year).
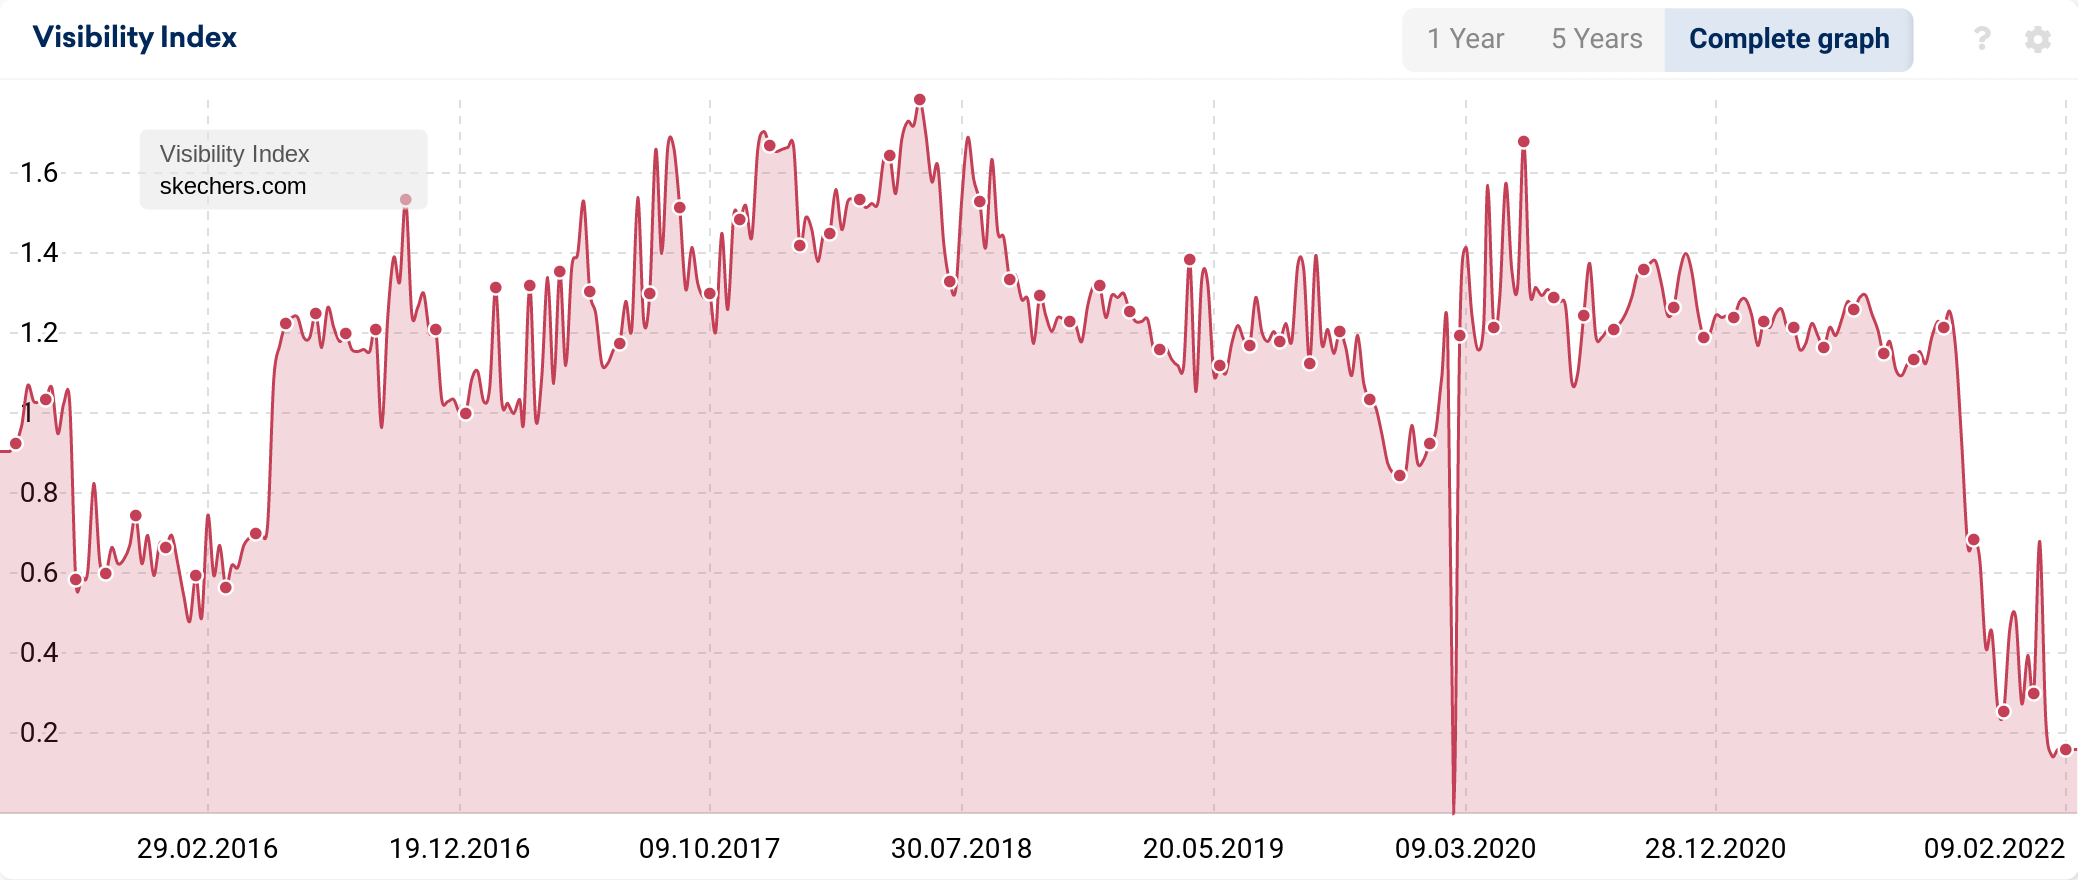
The dramatic decrease in skechers.com’s visibility started around 4th October 2021, following a year of notable visibility growth across all of their directories.
From conducting further research, it is apparent that Skechers has implemented a 302 (temporary) redirect for UK users from skechers.com to their new skechers.co.uk domain, ensuring users land on the most relevant version of the site based on their geographic location. If we overlay the two domains’ history we see that Skechers had consolidated into the .com domain in 2016 making this a rare case of a brand that has chosen to return to in-country domains.
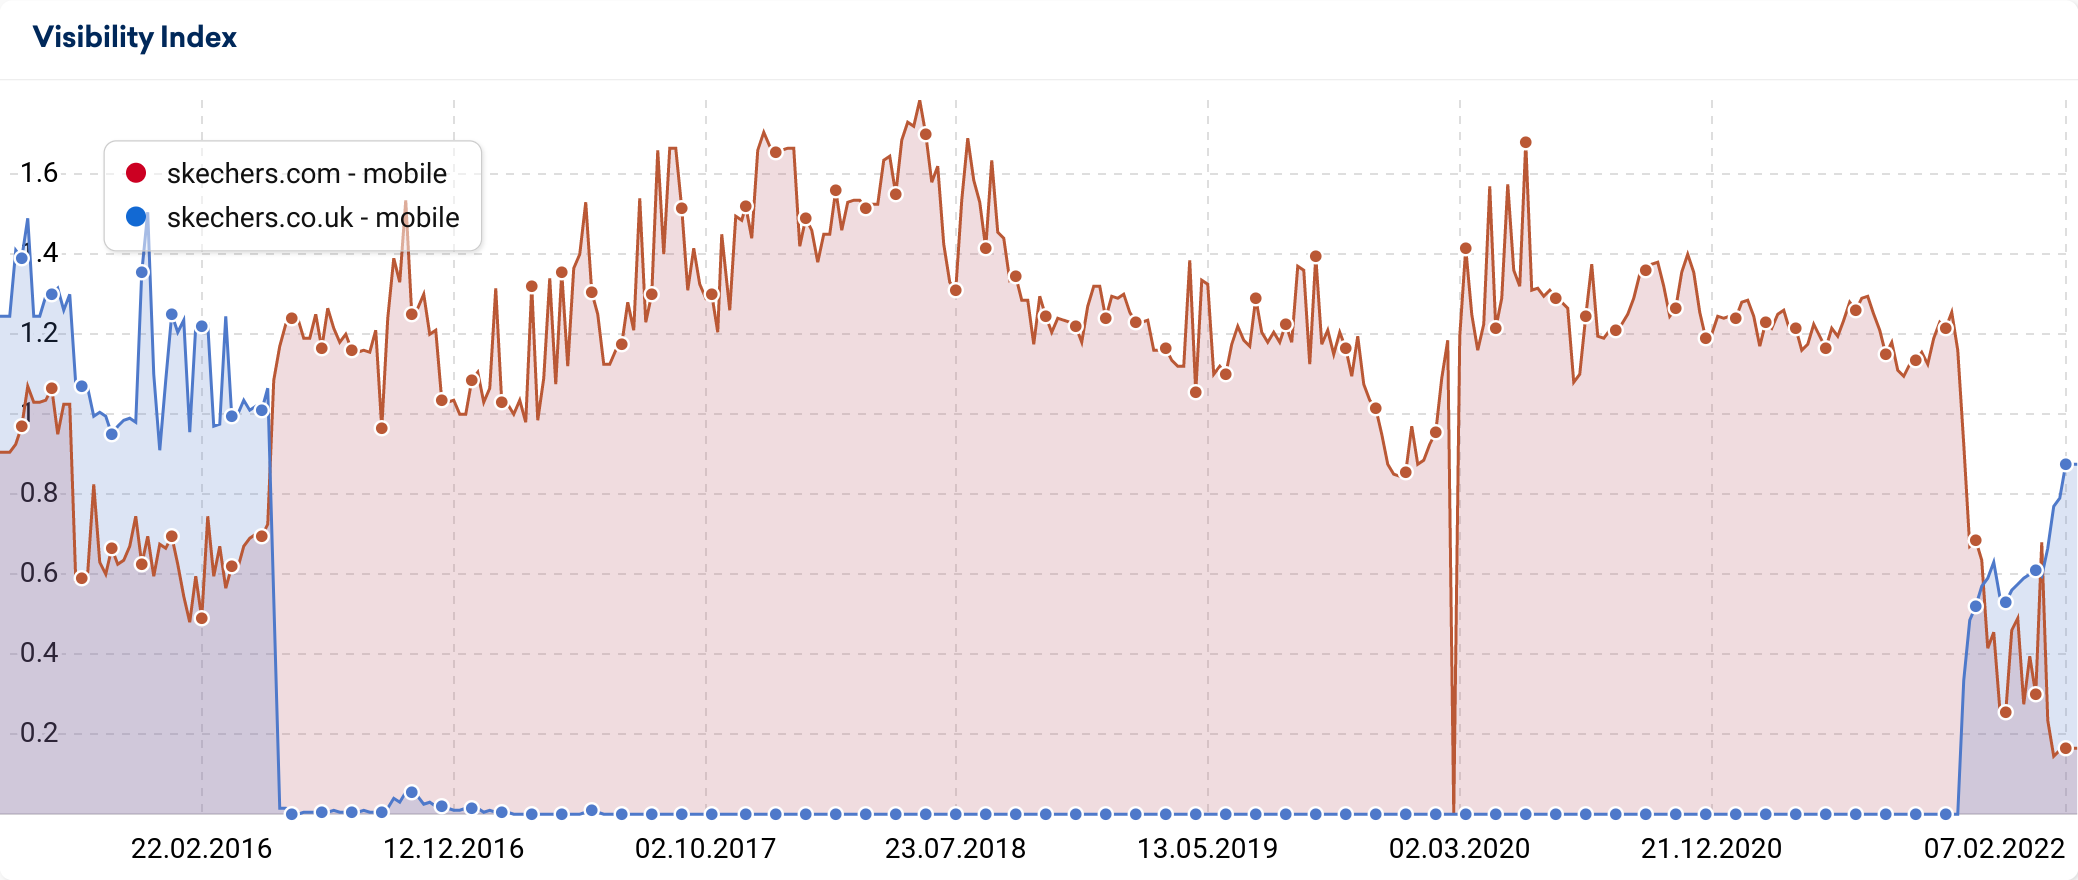
At face value, implementing redirects to country-specific domains does seem illogical. However, as we explore the website’s technical foundations, it is more apparent as to why they’ve opted for this approach over creating country-level subfolders on skechers.com.
All the Skechers websites use Salesforce Commerce Cloud (formerly known as Demandware). SFCC is a popular Ecommerce solution used by several fashion brands, including Adidas, Lacoste, and Marks & Spencer, because it is highly customisable, making it very flexible from an SEO optimisation perspective.
Every CMS has its sticking points, though. In the case of Salesforce Commerce Cloud, it is Hreflang. In 2016, SALT.agency highlighted that historically using “rel=alternate” tags across .com and country-specific subfolders did not work correctly. In a more recent guide created by NOVOS, it seems that page-level Hreflang is still problematic. Is this why Skechers have opted to direct users to CCTLDs (Country Code Top-Level Domains) instead?
Top 10 list of 2021 retail losers
Based on 250 retail domains tracked, these are the top 10 losing domains by absolute and percentage visibility in 2021. First, the absolute losers:
| Domain | 4 Jan 2021 | 3 Jan 2022 | Absolute VI loss |
|---|---|---|---|
| amazon.com | 579.69 | 197.64 | -382.05 |
| ebay.co.uk | 1,261.33 | 940.05 | -321.28 |
| ebay.com | 112.89 | 30.50 | -82.39 |
| debenhams.com | 87.37 | 21.76 | -65.61 |
| matalan.co.uk | 54.53 | 25.97 | -28.56 |
| game.co.uk | 40.52 | 17.22 | -23.30 |
| homebase.co.uk | 44.35 | 21.74 | -22.61 |
| wickes.co.uk | 60.66 | 48.61 | -12.04 |
| missguided.co.uk | 20.58 | 9.82 | -10.76 |
| tkmaxx.com | 22.70 | 12.70 | -10.00 |
| zara.com | 15.18 | 6.92 | -8.26 |
| hm.com | 31.36 | 23.25 | -8.11 |
| lakeland.co.uk | 22.21 | 14.32 | -7.89 |
| superdrug.com | 46.93 | 39.22 | -7.71 |
| hobbycraft.co.uk | 42.40 | 35.30 | -7.10 |
| topshop.com | 5.53 | 0.00 | -5.53 |
| dawsons.co.uk | 6.44 | 1.94 | -4.50 |
| aldi.co.uk | 12.45 | 8.03 | -4.43 |
| harveynichols.com | 9.88 | 5.57 | -4.31 |
| scan.co.uk | 20.34 | 16.11 | -4.23 |
| carphonewarehouse.com | 9.63 | 5.47 | -4.16 |
| footlocker.co.uk | 5.68 | 2.04 | -3.65 |
| blacks.co.uk | 11.26 | 7.80 | -3.46 |
| office.co.uk | 19.62 | 16.37 | -3.24 |
| hsamuel.co.uk | 33.84 | 30.67 | -3.17 |
In the table below, the losers by percentage VI gain during 2021.
| Domain | 4 Jan 2021 | 3 Jan 2022 | Percentage VI loss |
|---|---|---|---|
| skechers.com | 1.24 | 0.30 | -75.82% |
| debenhams.com | 87.37 | 21.76 | -75.10% |
| ebay.com | 112.89 | 30.50 | -72.98% |
| dawsons.co.uk | 6.44 | 1.94 | -69.93% |
| amazon.com | 579.69 | 197.64 | -65.91% |
| footlocker.co.uk | 5.68 | 2.04 | -64.18% |
| game.co.uk | 40.52 | 17.22 | -57.51% |
| trouva.com | 1.39 | 0.60 | -56.72% |
| monki.com | 1.32 | 0.58 | -56.14% |
| gap.co.uk | 5.71 | 2.58 | -54.85% |
| zara.com | 15.18 | 6.92 | -54.43% |
| burton.co.uk | 3.05 | 1.39 | -54.39% |
| iwantoneofthose.com | 4.06 | 1.91 | -52.98% |
| matalan.co.uk | 54.53 | 25.97 | -52.38% |
| missguided.co.uk | 20.58 | 9.82 | -52.28% |
| matchesfashion.com | 4.13 | 1.97 | -52.27% |
| whitestuff.com | 2.51 | 1.21 | -51.78% |
| homebase.co.uk | 44.35 | 21.74 | -50.98% |
| peacocks.co.uk | 4.38 | 2.18 | -50.18% |
| houseology.com | 0.07 | 0.03 | -49.05% |
| levi.com | 2.55 | 1.31 | -48.80% |
| spar.co.uk | 1.00 | 0.52 | -48.10% |
| fatface.com | 0.81 | 0.45 | -44.40% |
| tkmaxx.com | 22.70 | 12.70 | -44.04% |
| harveynichols.com | 9.88 | 5.57 | -43.62% |
Supermarket successes & sufferers
So we’ve looked at retailers more broadly, but how did the supermarkets fare? Our report in November 2021 showed that the online grocery competitors aren’t always what you’d expect but for this section, we’re looking at the well-known supermarket players. Also worth remembering is that some supermarkets perform well in areas outside of food & beverages. For example, most Marks & Spencer’s rankings are associated with clothing.
Co-op
Year on year, Co-op’s organic visibility grew by 66.9% (+1.83 VI points). As well as selling food, the Co-operative Group also offers legal services, insurance and funeral care, which are all promoted via coop.co.uk.
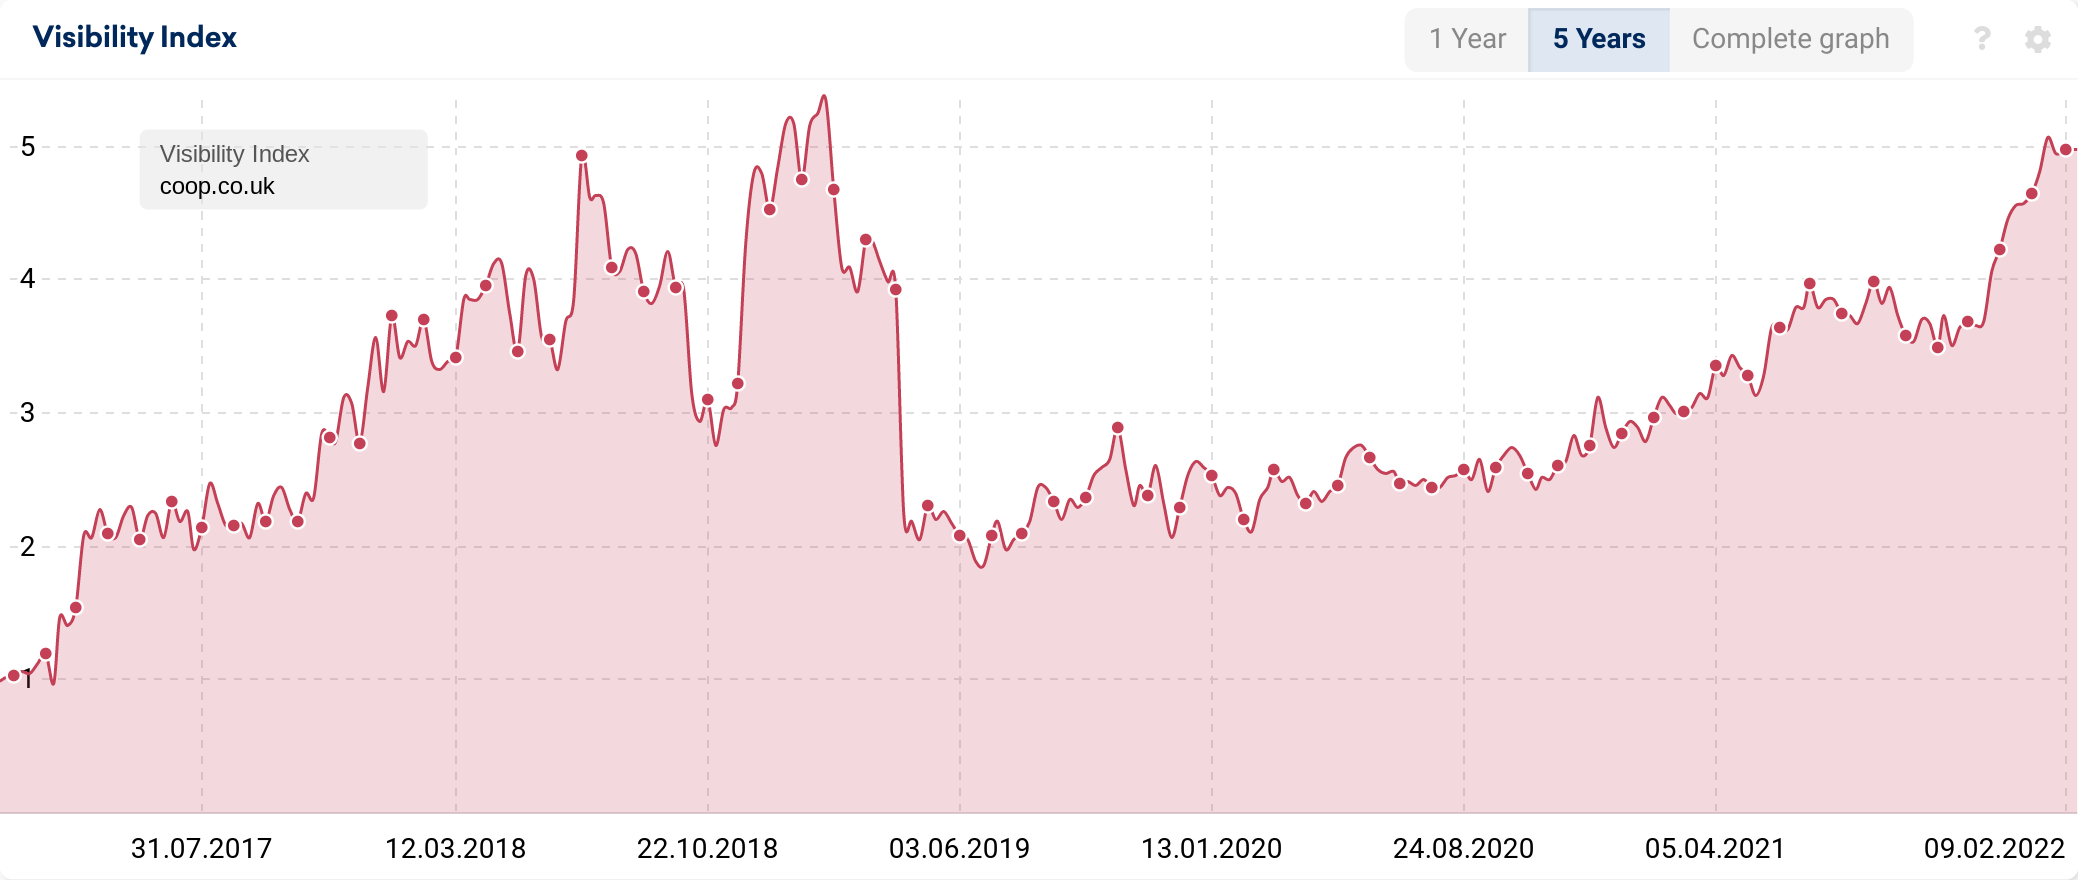
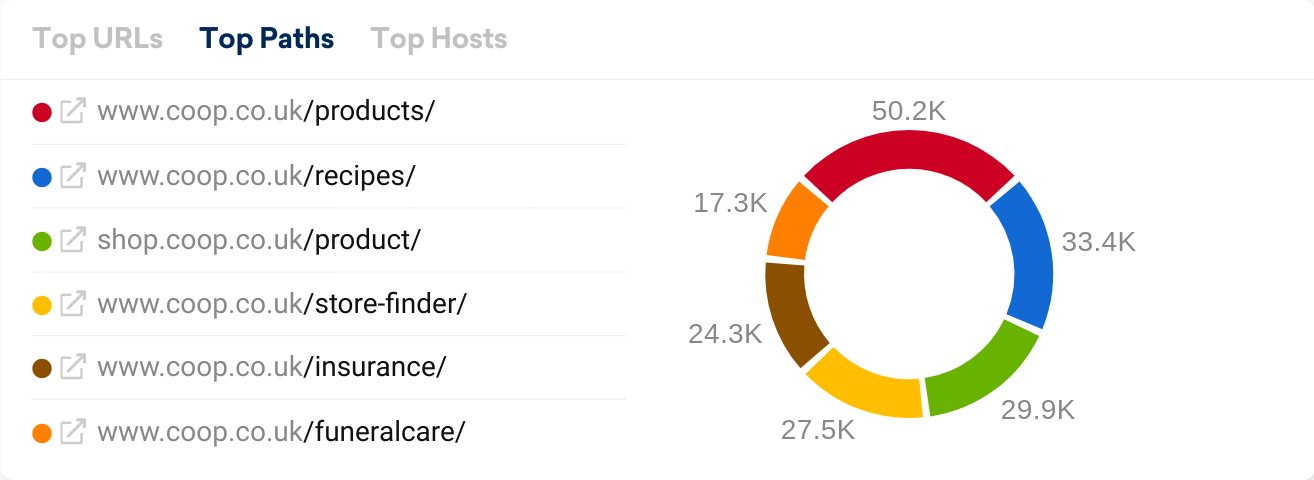
The domain hosts a range of subdomains too so a hat-tip to the web, SEO and content teams for managing what looks like quite the ‘stack’. Our technology tracker found 61 different software components across the domain.
Spar
Of course, where there are winners, there are also losers. Out of the supermarket domains, Spar saw the most prominent visibility decrease by percent (-48.1%).
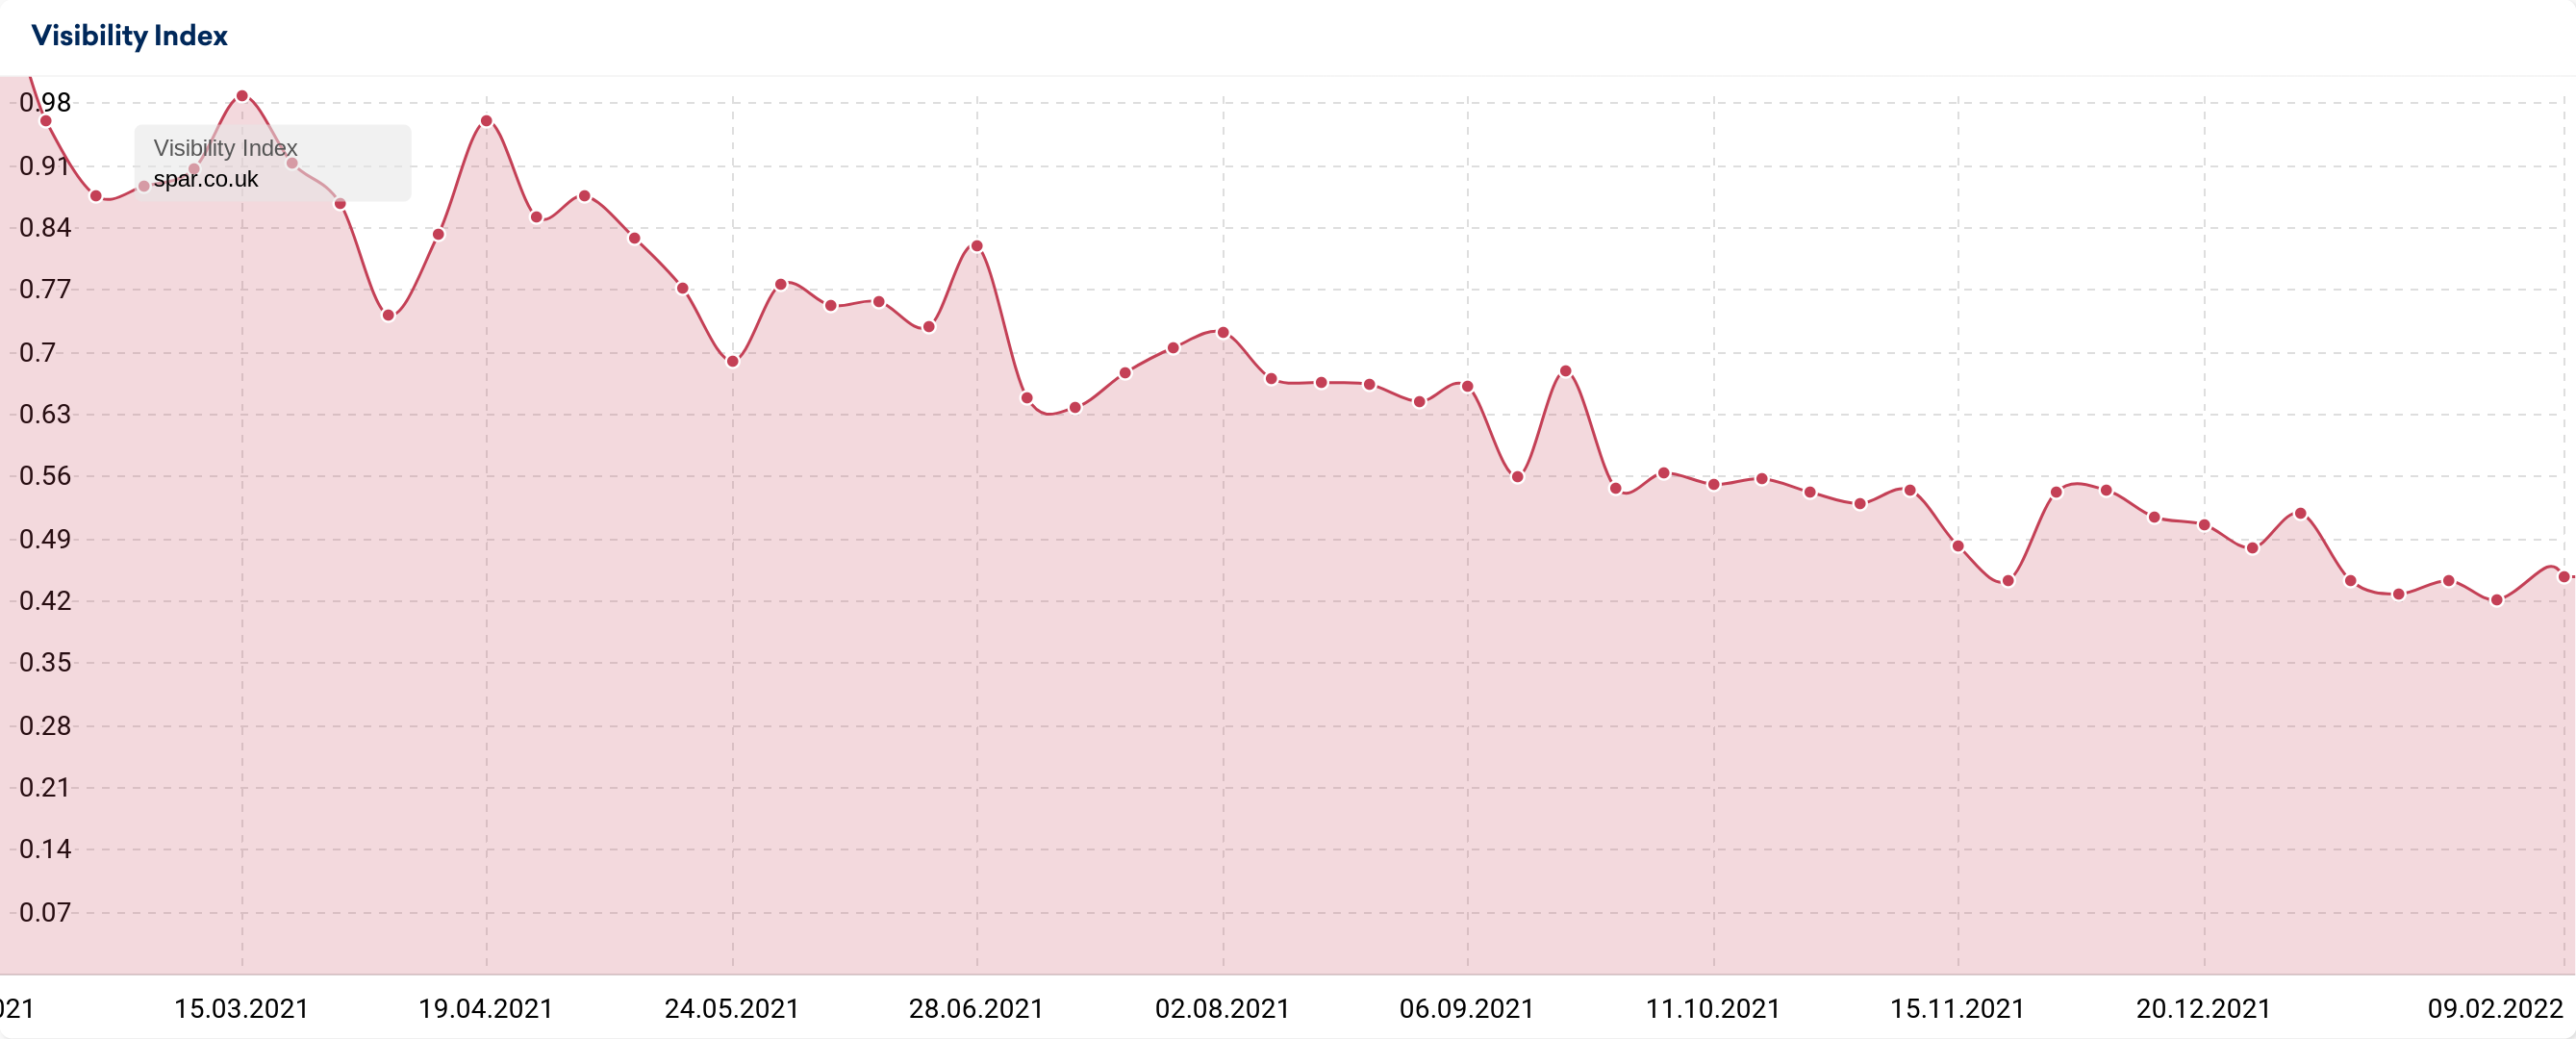
Unfortunately, a decline in Google visibility is not the only challenge that Spar faced in 2021. In early December, over 300 Spar convenience stores had to close when the company experienced a cyber attack, which led to stores temporarily resorting to cardless payment methods.
However, from looking at the Visibility Index data, it is clear that this decline wasn’t a result of December’s ransomware attack. Spar.co.uk’s search prominence has gradually decreased since the two Spam Updates in June.
Looking deeper into the directories we see significant visibility losses for the two top performing sections – /services and /deals-and-groceries.
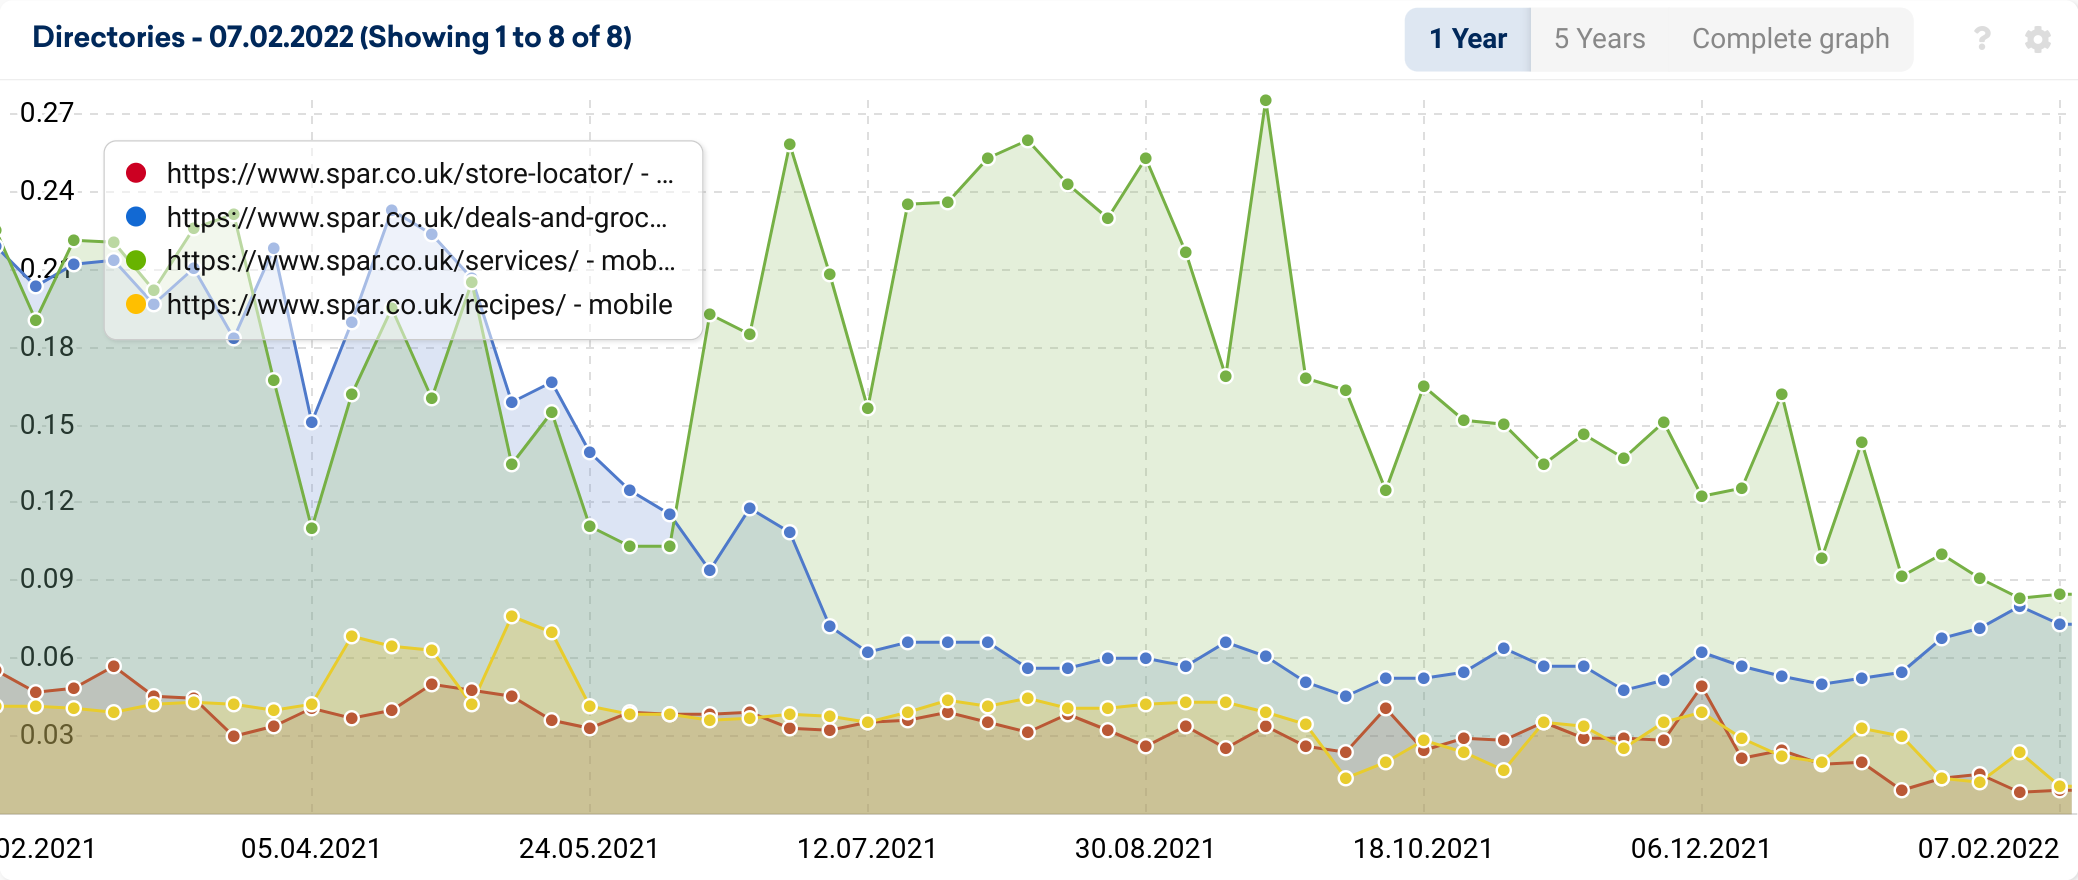
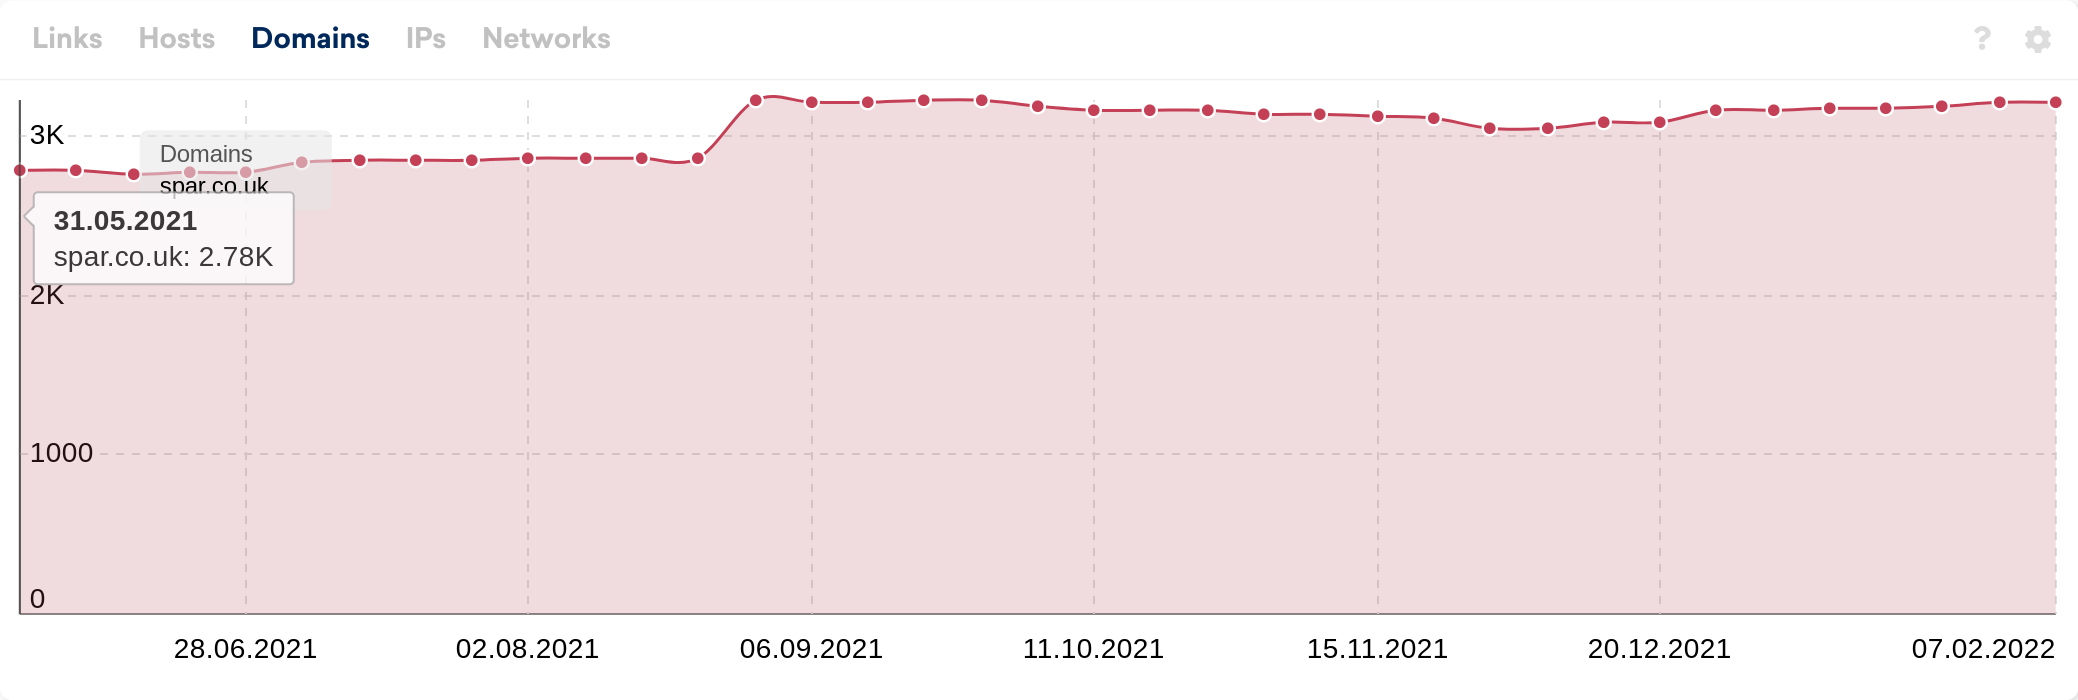
Since the initial drop off in visibility reported in April, there have been no obvious changes to these two directories. The fluctuation does not align with the roll-out of any Google updates. However, throughout 2021, there has been a decrease in the number of backlinks to the domain and in alignment with that, domain diversity has also increased. It is possible that Spar has lost some authoritative backlink equity from lost links?
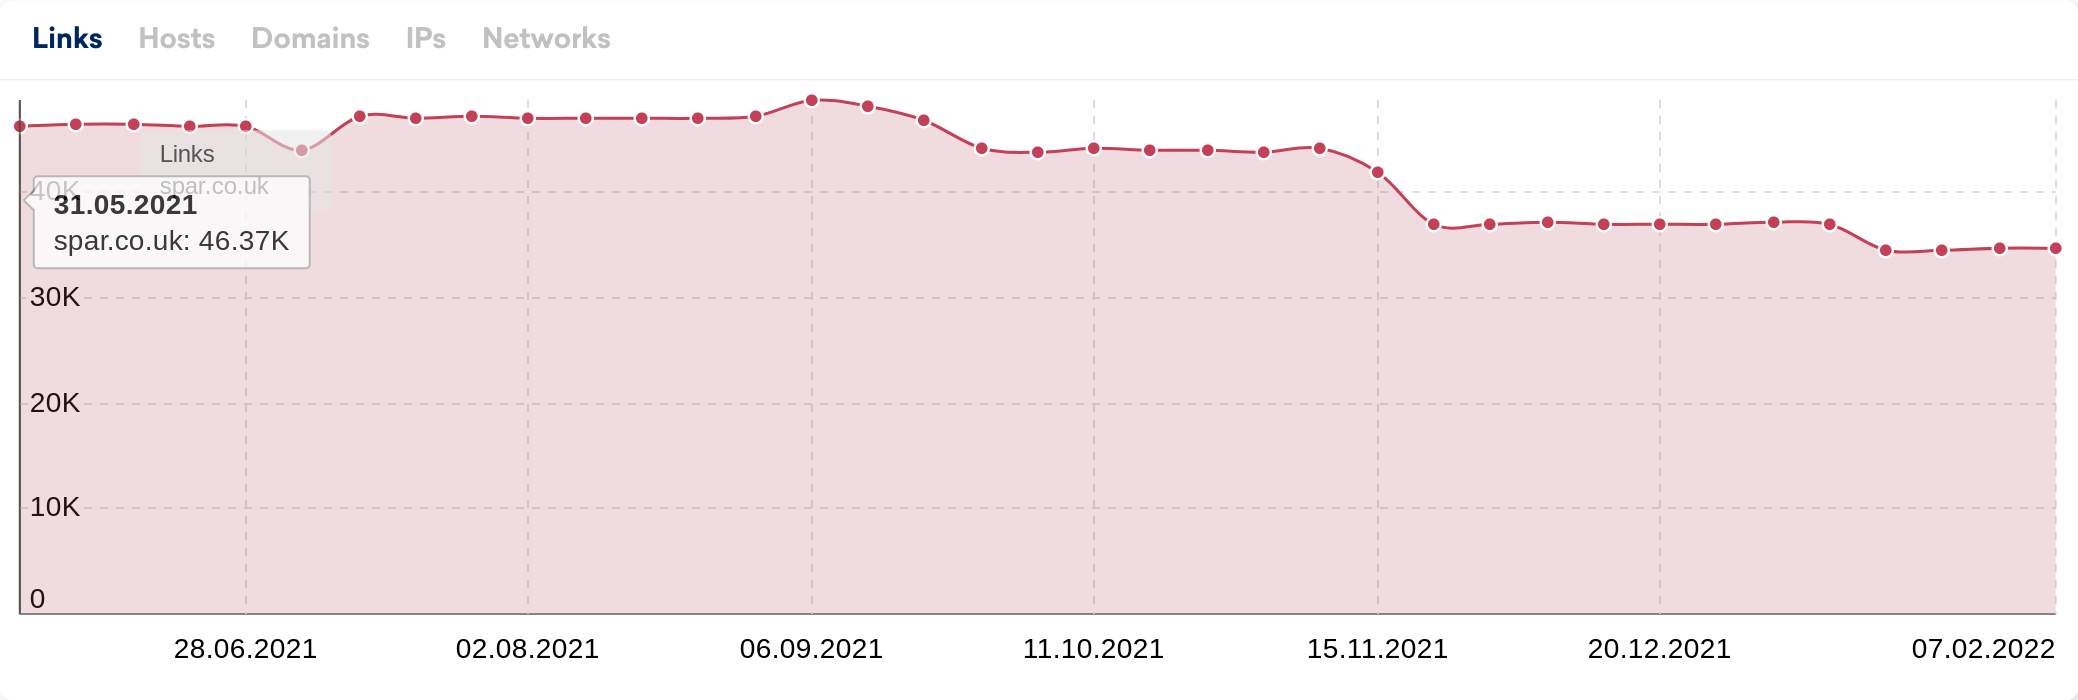
Interestingly, whilst backlinks have decreased, referring domain diversity has improved. This suggests that if Spar has lost valuable backlinks, the domains that they have obtained backlinks from have less trust and authority.
Full list of supermarket winners & losers
Below are the top 5 supermarket winners and losers. First, the winning supermarket domains by absolute and percentage VI.
| Domain | 4 Jan 2021 | 3 Jan 2022 | Absolute VI gain |
|---|---|---|---|
| marksandspencer.com | 34.87 | 48.74 | 13.87 |
| asda.com | 72.80 | 86.16 | 13.36 |
| sainsburys.co.uk | 41.53 | 48.09 | 6.56 |
| morrisons.com | 8.71 | 13.58 | 4.87 |
| tesco.com | 64.02 | 67.69 | 3.68 |
| Domain | 4 Jan 2021 | 3 Jan 2022 | Percentage VI gain |
|---|---|---|---|
| coop.co.uk | 2.74 | 4.58 | 66.90% |
| morrisons.com | 8.71 | 13.58 | 55.89% |
| marksandspencer.com | 34.87 | 48.74 | 39.76% |
| asda.com | 72.80 | 86.16 | 18.35% |
| sainsburys.co.uk | 41.53 | 48.09 | 15.79% |
Losing domains among UK supermarkets
| Domain | 4 Jan 2021 | 3 Jan 2022 | Absolute VI loss |
|---|---|---|---|
| aldi.co.uk | 12.45 | 8.03 | -4.43 |
| waitrose.com | 13.05 | 12.10 | -0.95 |
| iceland.co.uk | 7.95 | 7.33 | -0.61 |
| spar.co.uk | 1.00 | 0.52 | -0.48 |
| ocado.com | 8.60 | 8.23 | -0.37 |
| Domain | 04 Jan 2021 | 3 Jan 2022 | Percentage VI loss |
|---|---|---|---|
| spar.co.uk | 1.00 | 0.52 | -48.10% |
| aldi.co.uk | 12.45 | 8.03 | -35.55% |
| carrefour.com | 0.16 | 0.11 | -28.65% |
| iceland.co.uk | 7.95 | 7.33 | -7.69% |
| waitrose.com | 13.05 | 12.10 | -7.29% |
2021 really was a fascinating year in the world of retail, and we are intrigued to see how things continue to develop in the industry as we move through 2022.
Are there any other industries you’d like us to put the magnifying glass on? Please let us know in the comments!
Background research by Steve Paine.