In the Sentiment section, you can see the overall tone AI models use when discussing your brand, independent of any specific recommendation context. The core metric is the Net Sentiment Score, the balance between praise and criticism mentions. It’s complemented by a topic level, showing which topics are particularly polarizing, and a platform level, showing whether AI models like Google AI Mode, Google AI Overviews, or ChatGPT assess your brand differently.
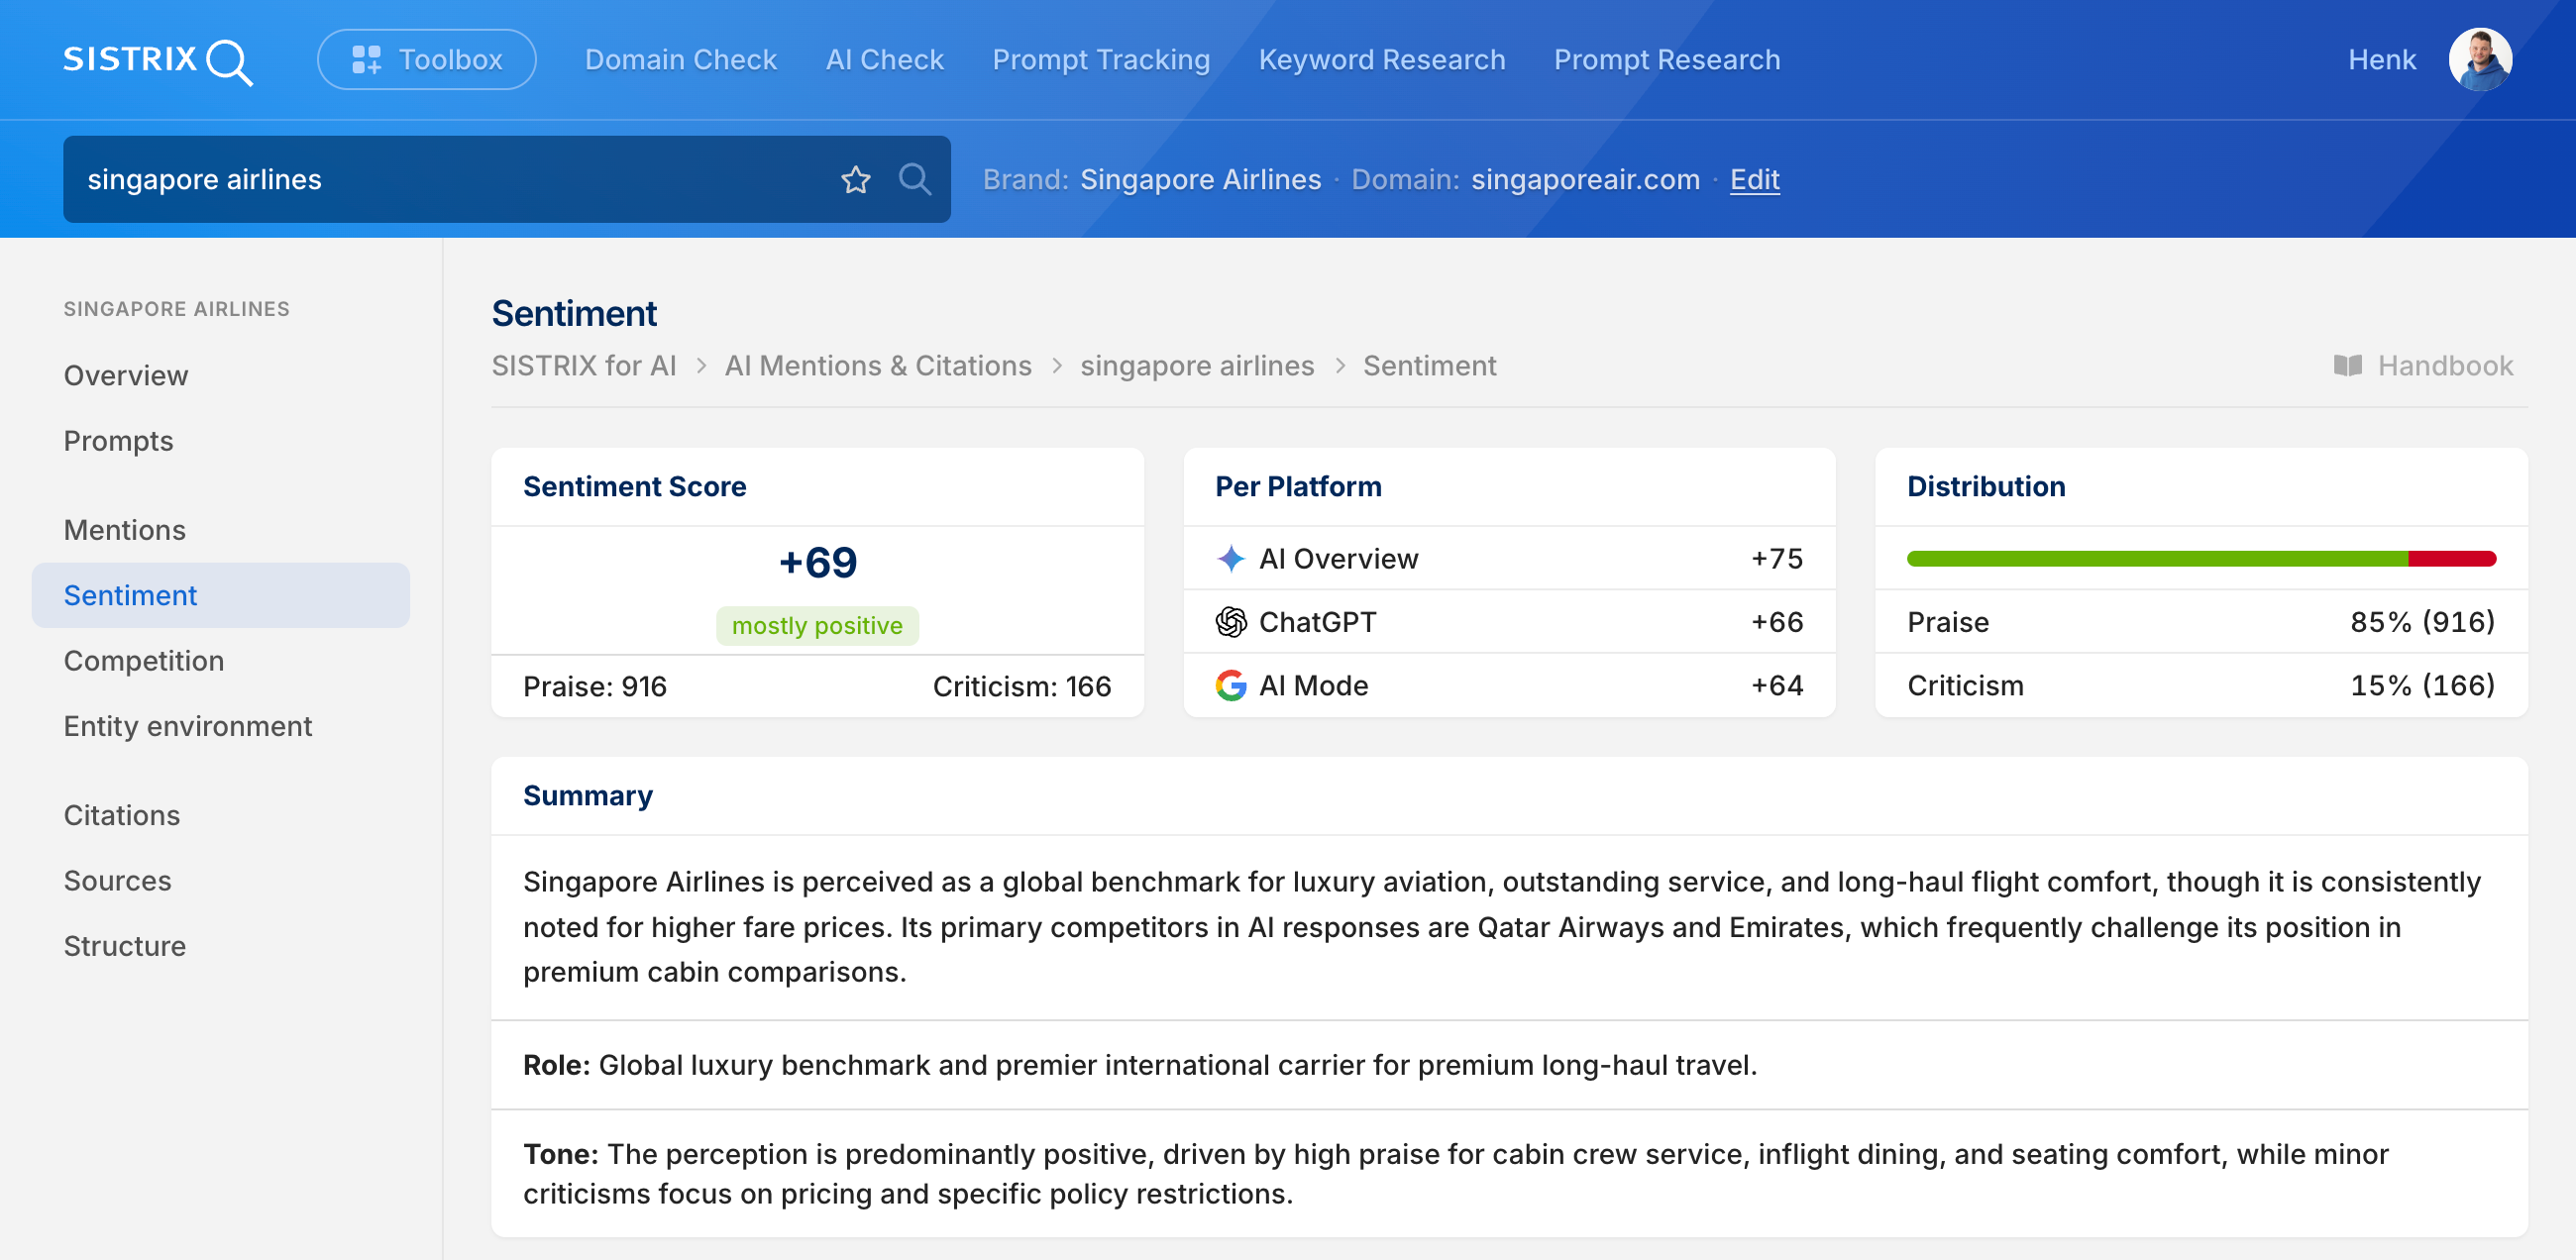
Sentiment score
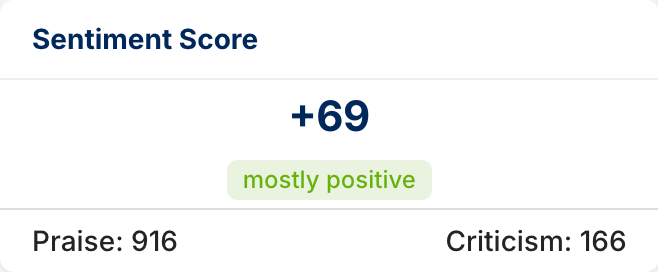
The Net Sentiment value on a scale from -100 to +100, together with the number of praise and criticism mentions. The factual midpoint isn’t 0: AI systems tend to phrase things positively, and across many brands the average sits closer to +50. How your own value actually compares is shown by the Sentiment Scale further down.
Per Platform
The sentiment score for each individual AI model. This makes it visible whether one model assesses your brand noticeably more positively or critically than the others, and whether a single model is shaping the overall value.
Distribution
A bar showing the share of praise and criticism as a percentage, supplemented with the absolute numbers.
Summary
A compact take on the overall picture, broken down into the role your brand plays in the topic context, and the tonality, i.e. the reasoning behind the tone classification.
Key findings
Key findings are the most important insights from the entire analysis in condensed form, not just figures, but already put into context.
Sentiment scale
On a shared axis from -100 to +100, the Sentiment Scale plots the overall score and the values for each individual platform as points. This makes it visible at a glance how far apart the platforms’ assessments actually are, not just as numbers, but spatially on the same scale.
Below that sits the classification compared to other brands: a category such as “upper-mid range”, the exact percentile, and the number of brands this comparison is based on. Only this comparison shows whether a score is genuinely strong or fairly average for the market, since most brands are rated positively to begin with.
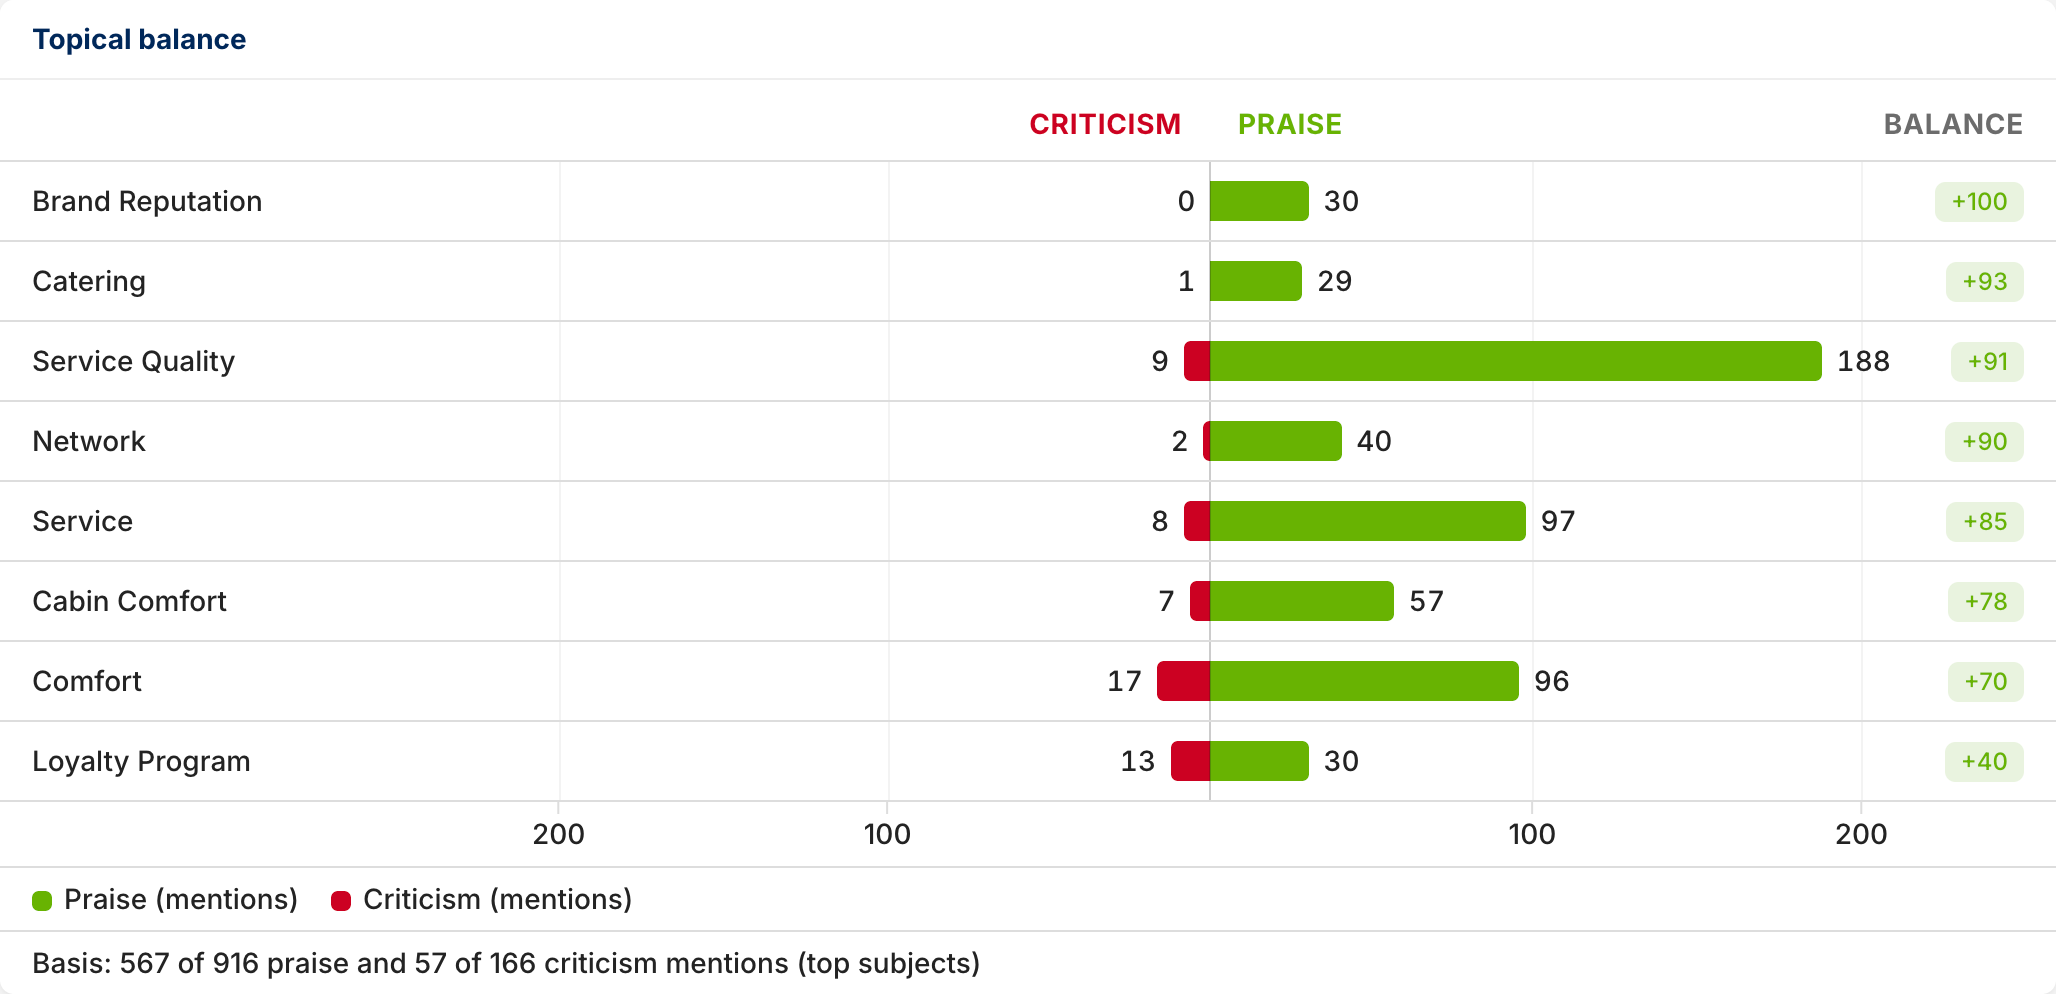
Topical balance
The topical balance breaks the overall sentiment score down by individual topic. Instead of just one figure for the whole brand, you see here how much each topic contributes to praise and criticism: a topic can be praised almost exclusively, criticized almost exclusively, or receive both in similar measure at the same time (in which case it’s ambivalent, meaning the brand is seen as controversial on this topic). The balance per topic shows whether that topic pulls the overall score up or down.
The baseline puts this into context by showing what percentage of all mentions are actually covered by the displayed top topics, i.e. whether the topics shown cover the bulk of the discussion or only a small slice of it.
Strengths
The topics for which your brand is praised most often, sorted by number of mentions. Each strength can be expanded. Underneath, you’ll find the original quotes per AI platform, the sources behind them (owned pages, media, and forums, each with the number of mentions), and a concrete recommendation for action.
Weaknesses
The limitations that AI models mention most often, sorted by number of mentions. The structure and expandable detail match the strengths section: original quotes per platform, sources with number of mentions, and a recommendation for action.
Profile per AI platform
A table with a tonality value for each platform, the typical conversational context, and a sample quote. It makes visible that individual AI models can assess your brand differently.
Co-mentioned competitors
Co-mentioned competitors are brands that AI models mention in the same context as your brand, each with a brief note on their positioning. Each competitor can be expanded. Underneath, you’ll find the specific comparison framing along with a supporting quote and sources.
Notable Quotes
This is a collection of particularly telling verbatim quotes, each labeled with the platform it comes from, and expandable to show the associated sources.
Related features
Sentiment Analysis is one of three analyses that look at the same underlying data from different angles:
- Competitive Perception: The topics on which your brand is praised or criticized compared to competitors.
- Recommendation Map: The specific occasions on which AI recommends your brand, and those where competitors are named instead.
- Prompts: The specific questions and full answers that these mentions come from.