The June 2025 Core Update was announced on the 30th June 2025 with a roll-out planned for three weeks. This is the second core update of 2025. Helpful statistics and analysis will be provided below including lists of affected domains across various countries.
Discover how SISTRIX can be used to improve your search marketing. 14 day free, no-commitment trial with all data and tools: Test SISTRIX for free
Latest update: 17th July 2025 – The Core Update rollout is complete.
- Google’s status page for the Core Update Start date: 30th June 2025. End date: 17th July 2025
- For detailed information and data on all previous Google updates, see the SISTRIX update tracking page
Google did not provide any additional information about which parts of the search algorithm will be improved with this core update.
SISTRIX Google Update and Feature Update Radar
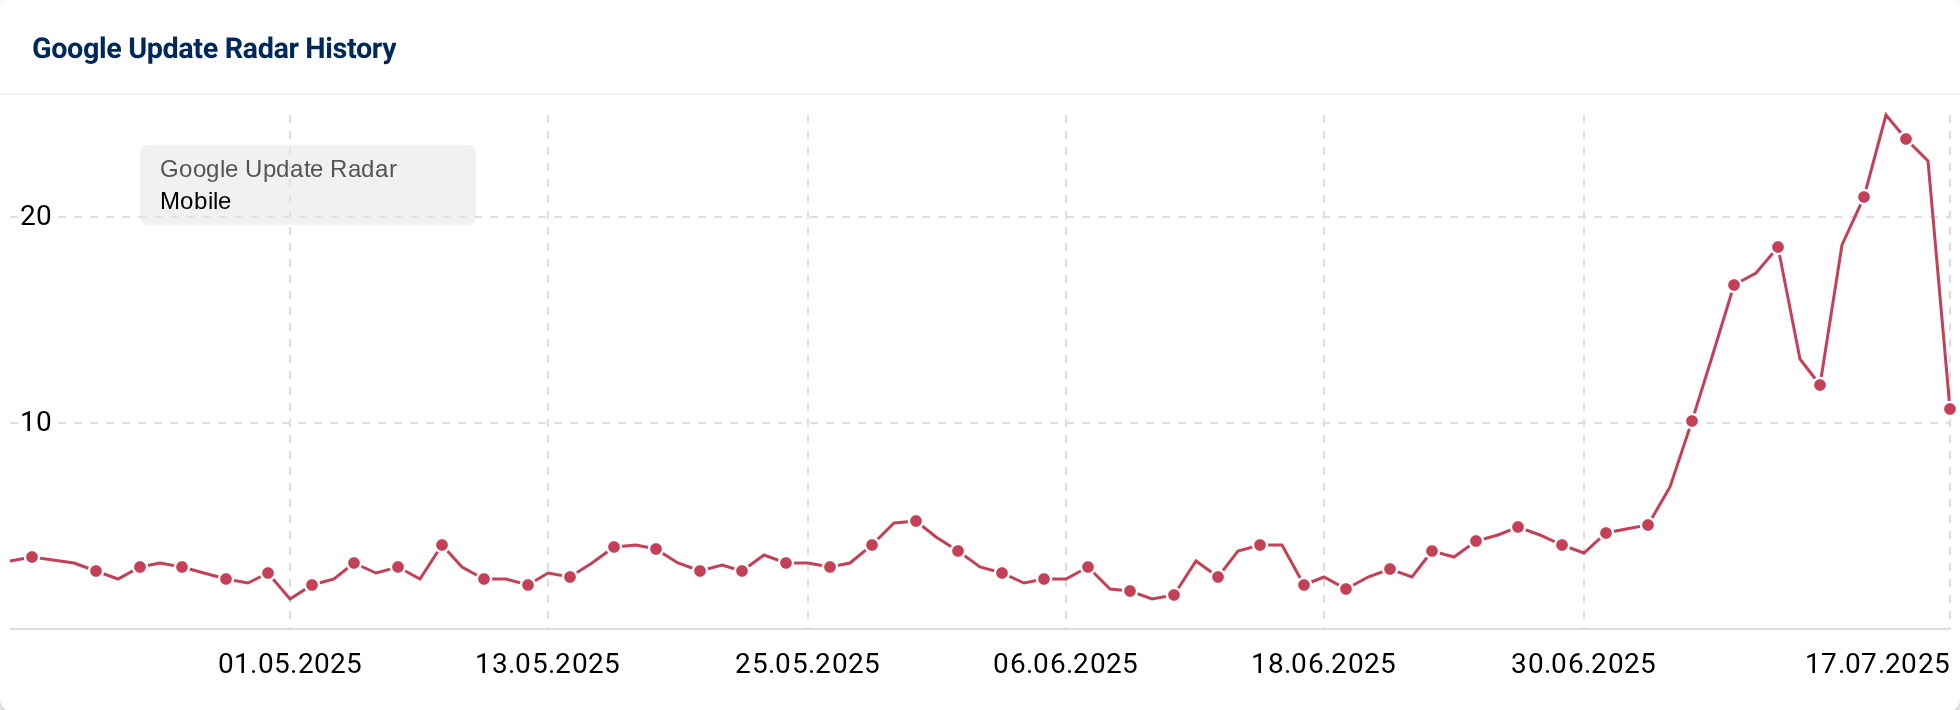
The daily view on SERP updates can always be viewed in our Google Update Radar which shows the current level of movement relative to the last 90 days. The radar graphics are an indicator of SERPs changes across 1 million SERPs every day. Graphs for UK and US are shown below:
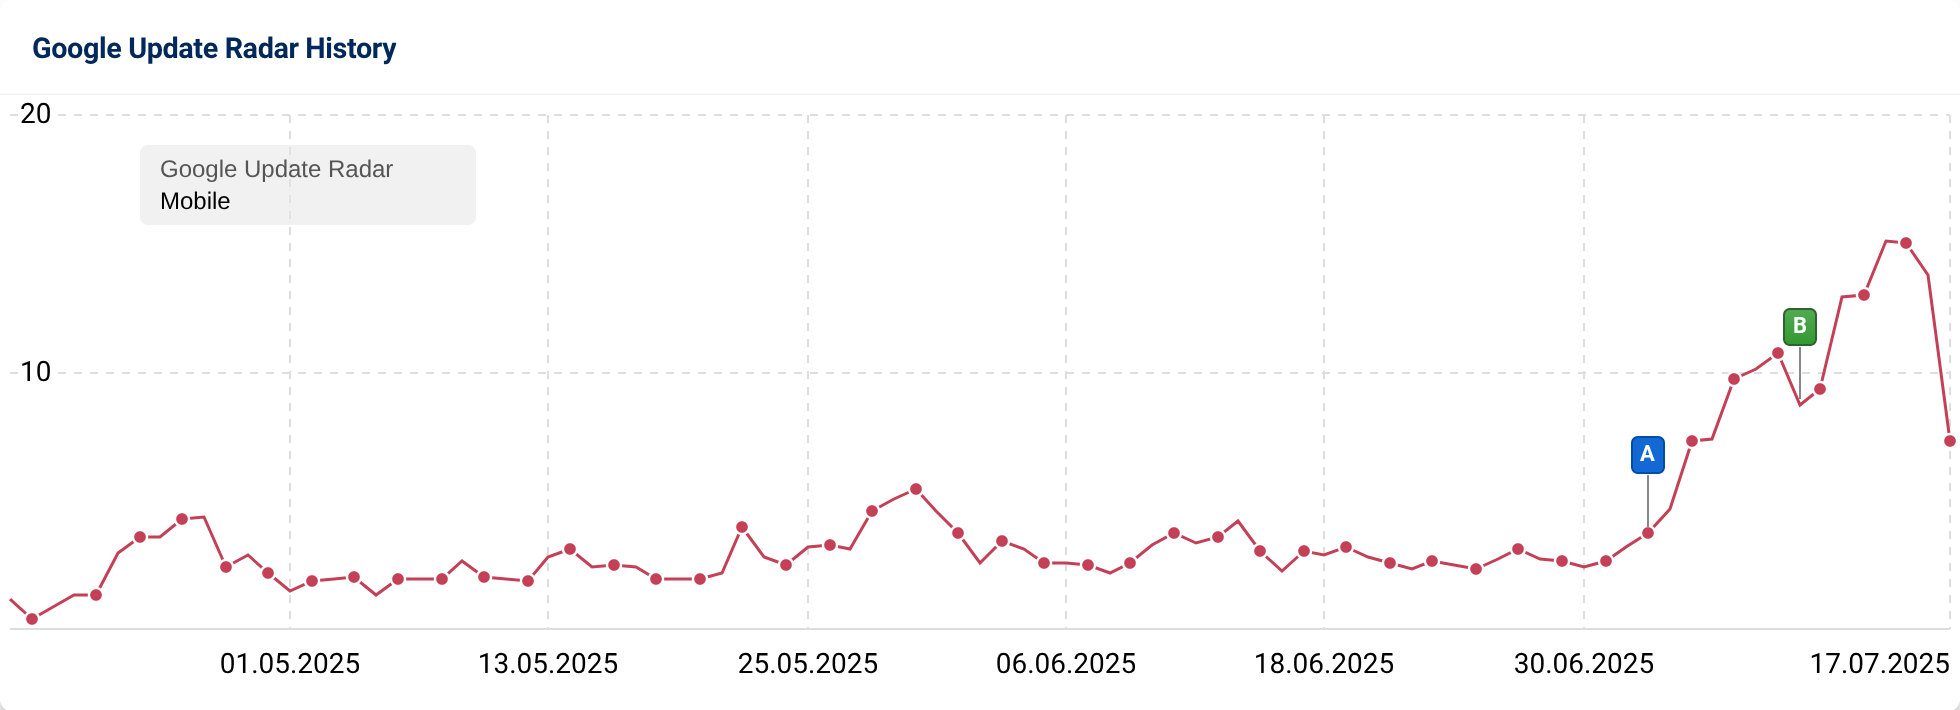
The effect of the June Core Update in the US rose to levels above that which we saw in the March Core Update. A second wave of changes, which is affecting a different set of domains, can be seen in the radar. (Examples below.)
SERP feature changes during the Core Update.
The feature update radar (below the main radar on the same page) gives us an overview of any major formatting changes that might have occurred. Features can impact CTR and therefore click-rates.
In the UK, the number of video and forums features increased but across other features in the US and UK results, there were no major changes. AIO overviews saw a small increase in the UK.
Domain winners and losers in the June Core Update
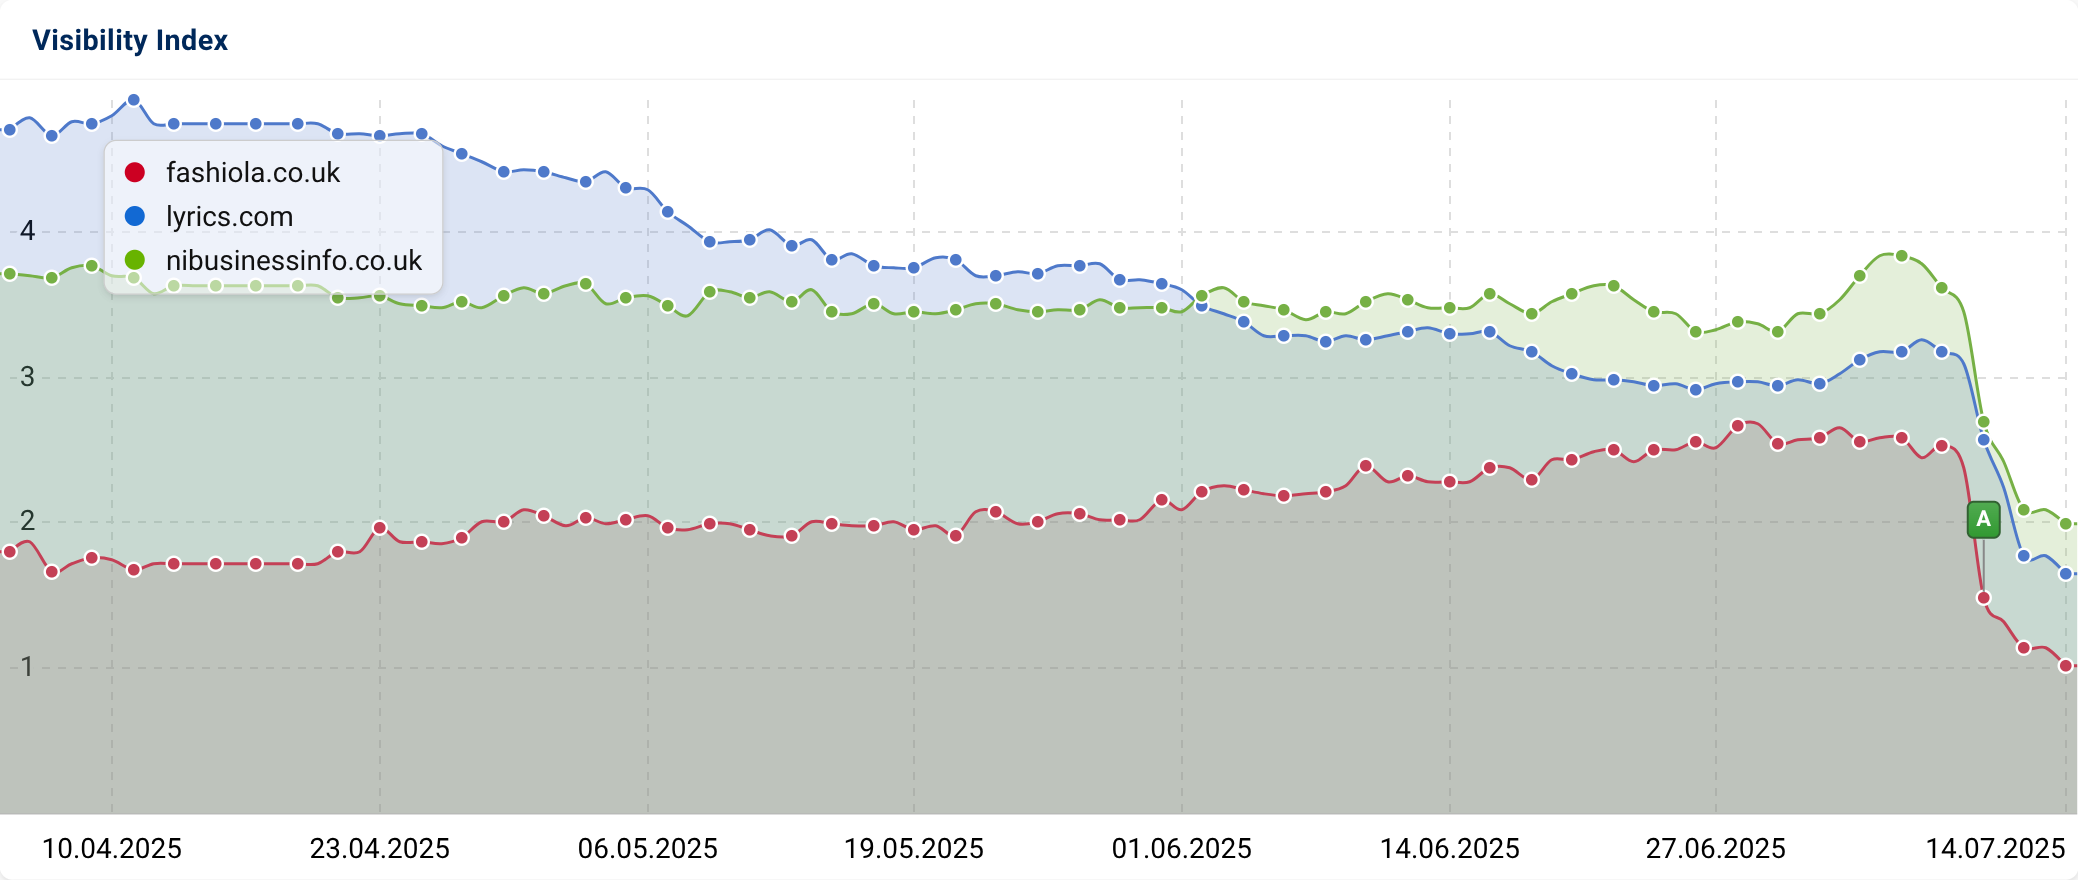
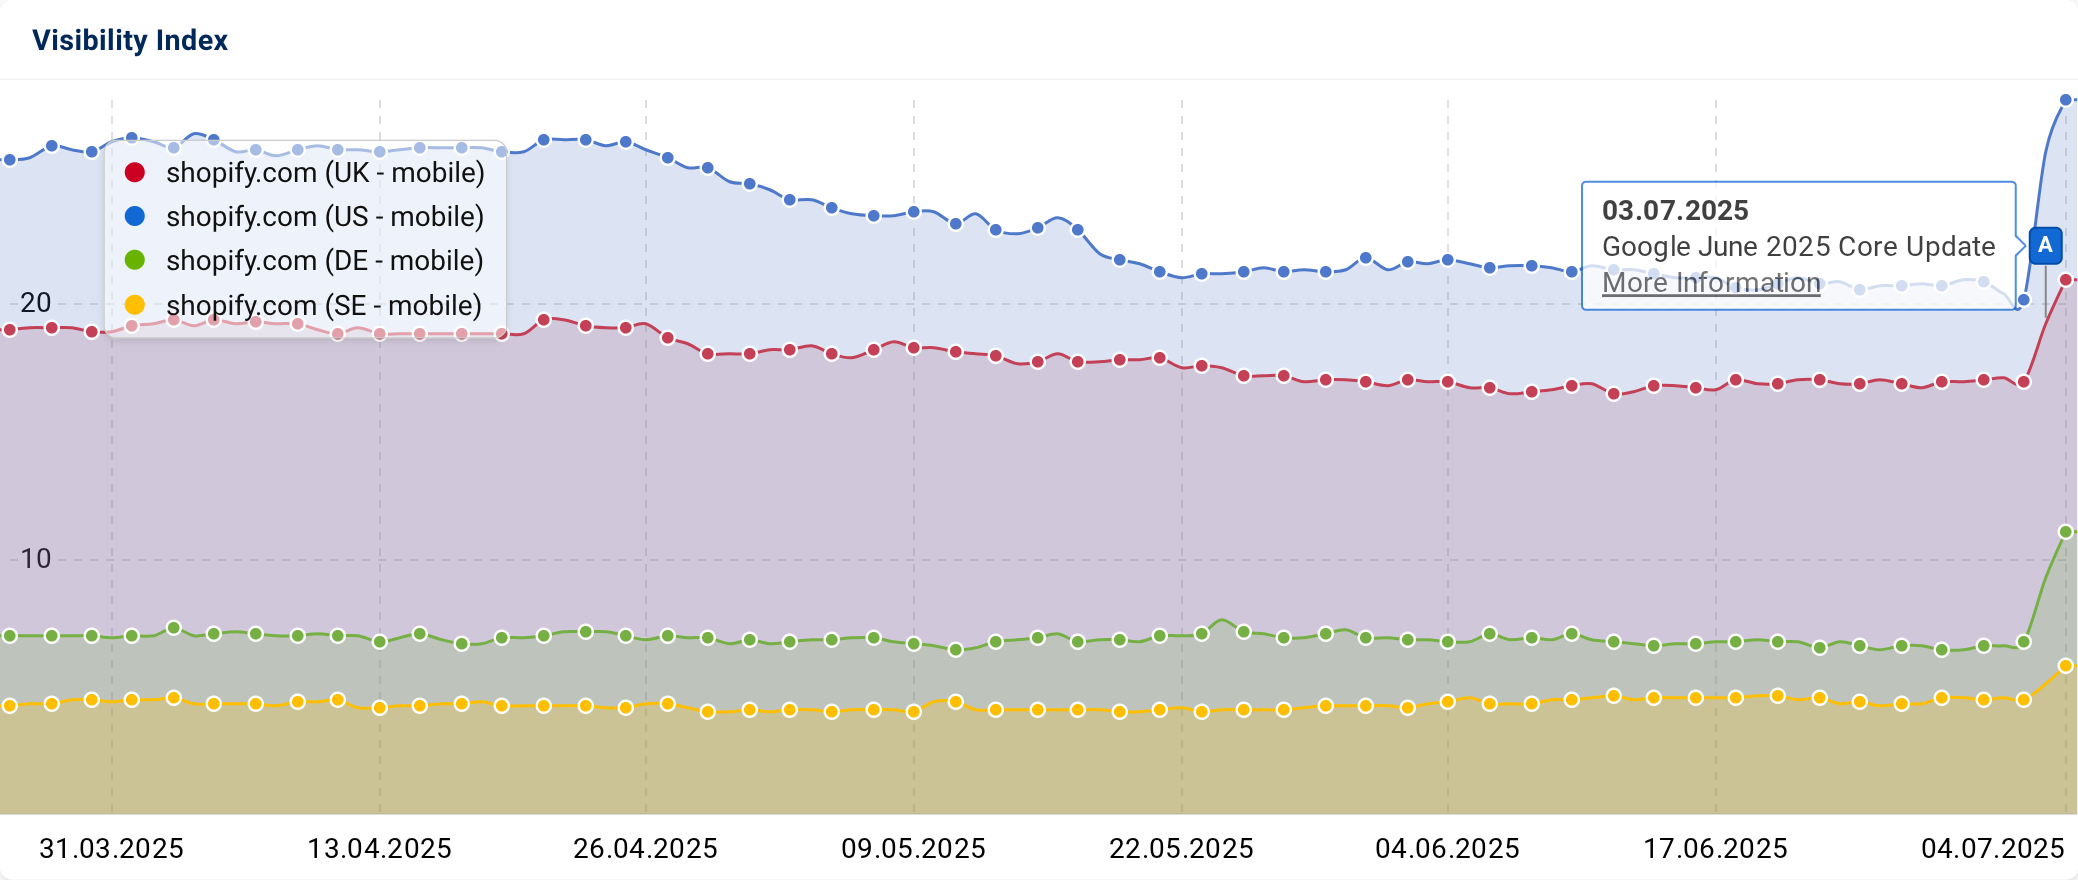
UK changes were first detected from the 2nd to 3rd of July. US changes also from the 2nd to 3rd July. A second wave of changes was detected around the 9th July, affecting a different set of domains.
Domains affected range from commercial to informational across many sectors although data shows a movements that are more prevalent across domains that are focused on informational content types.
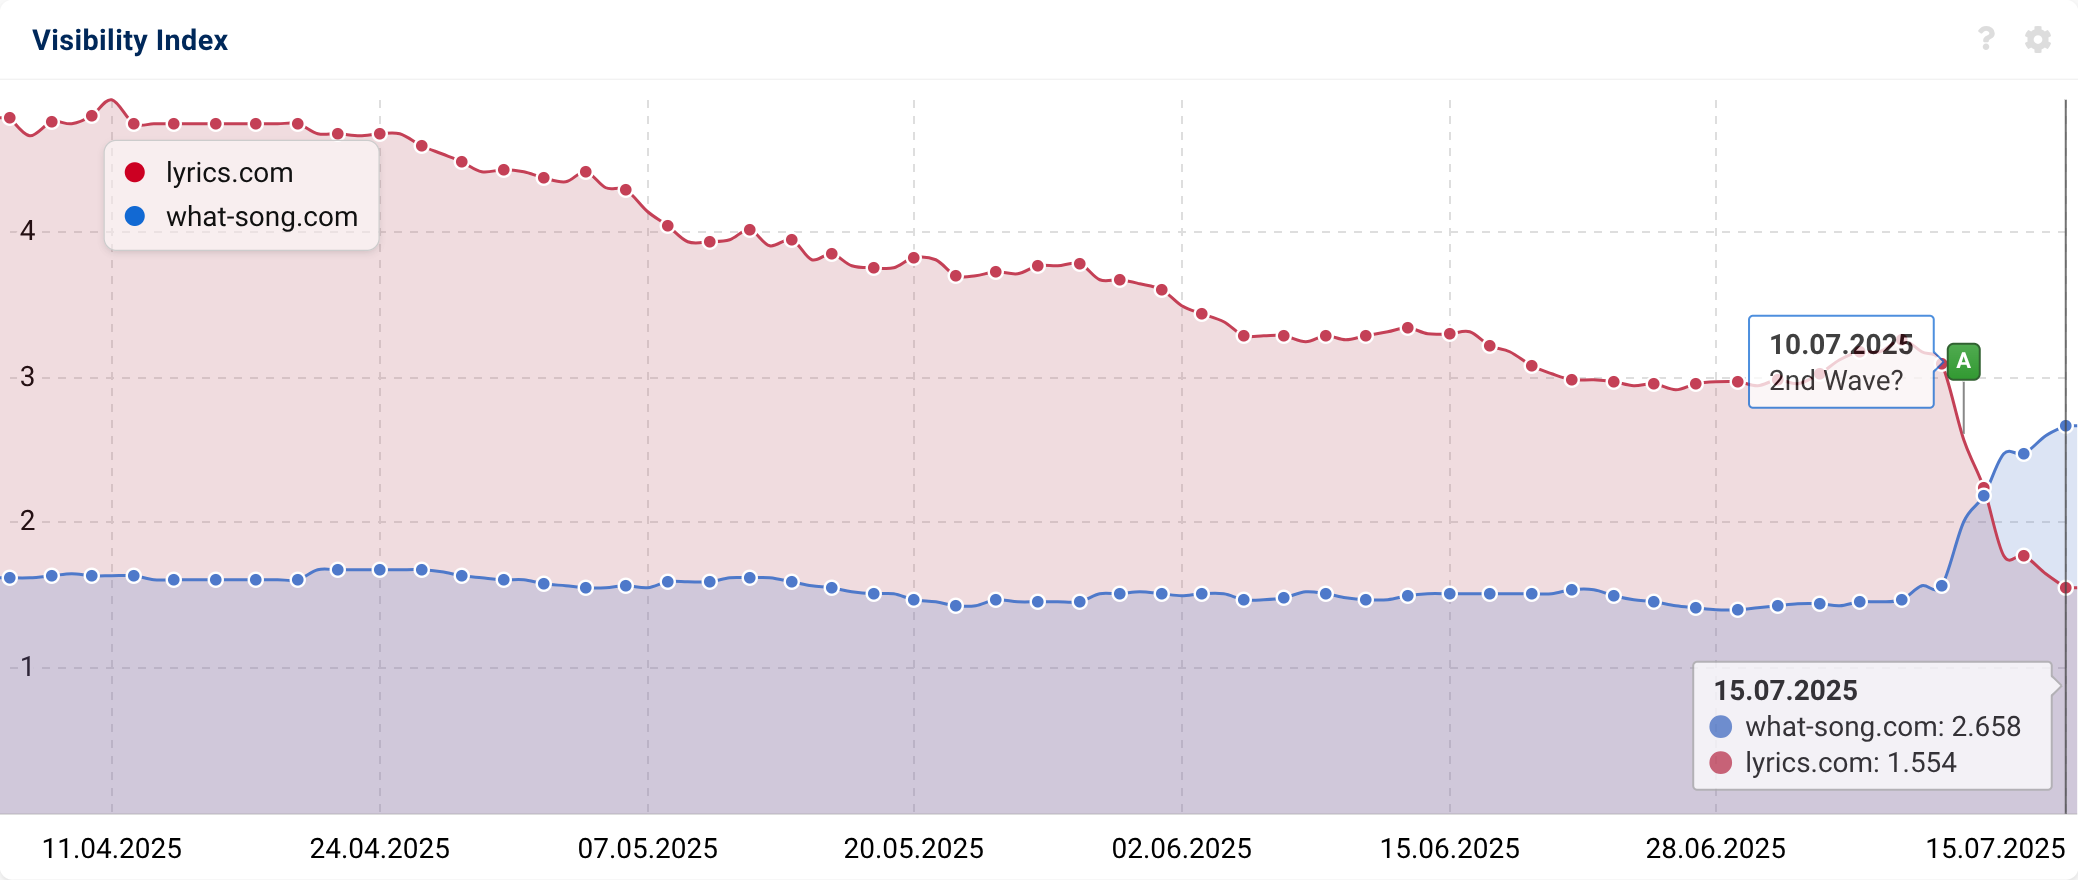
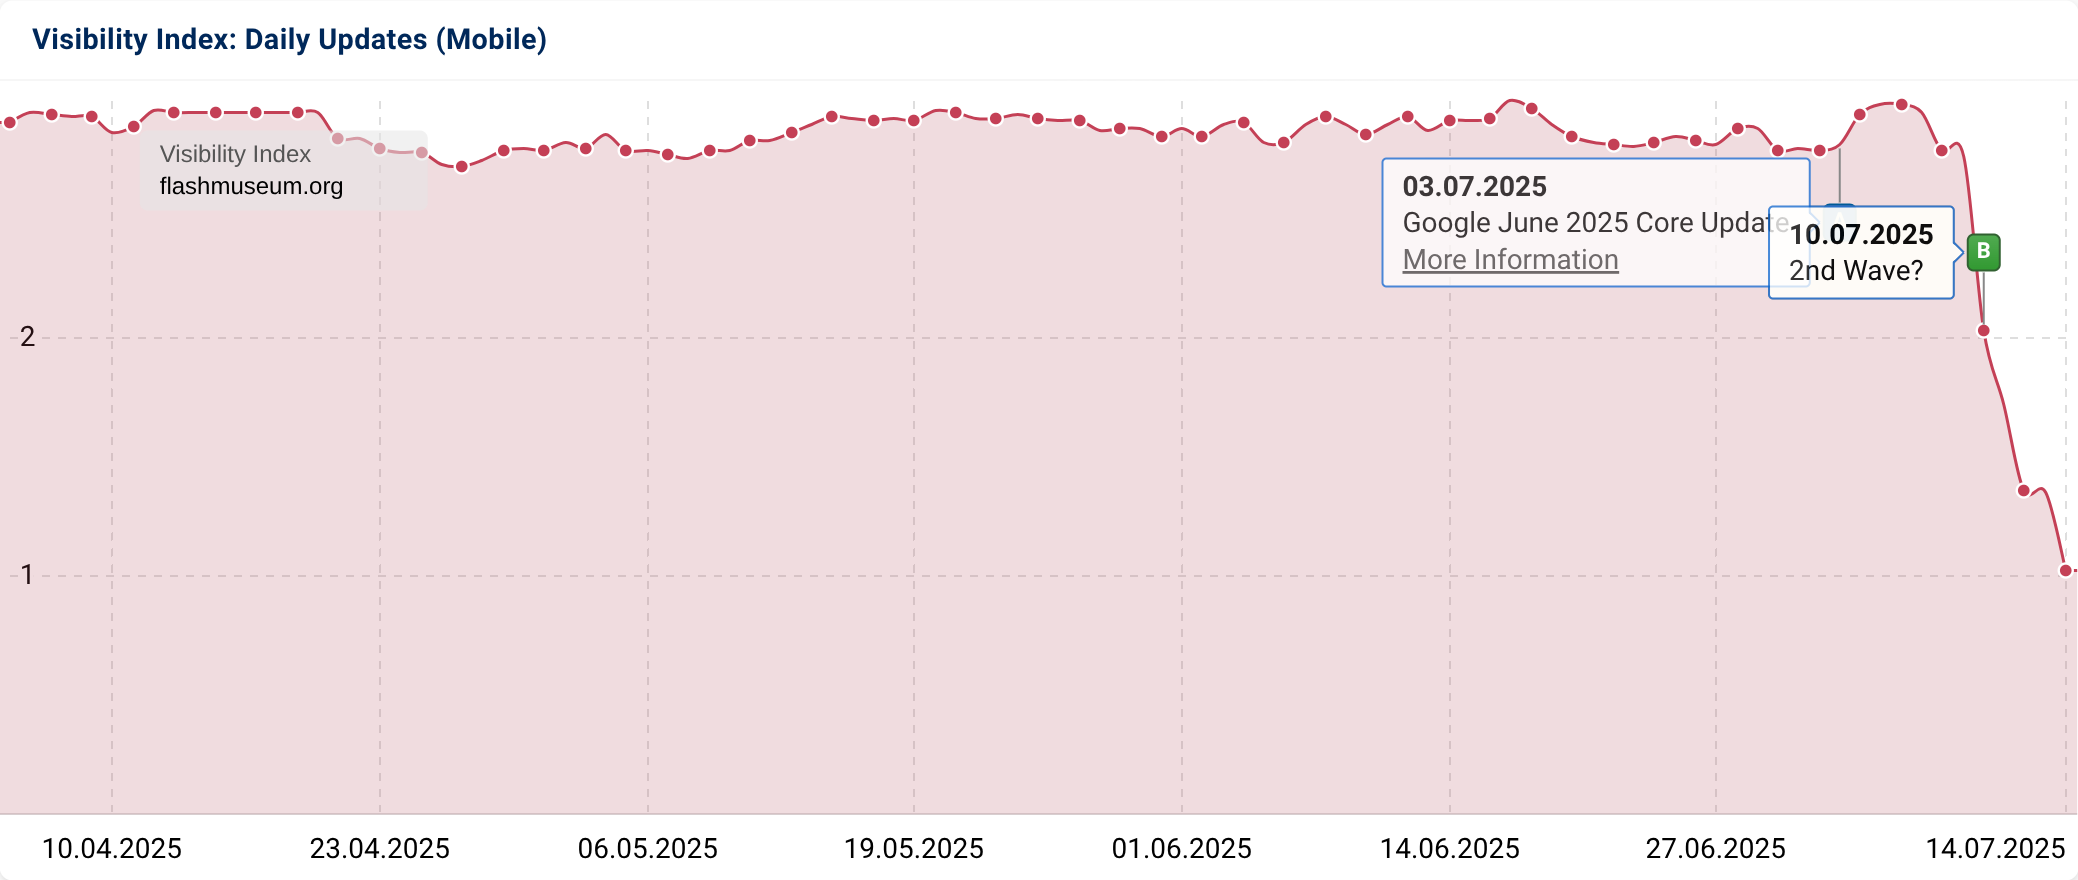
There are examples of domains that have only been affected in the early part of the Core Update:
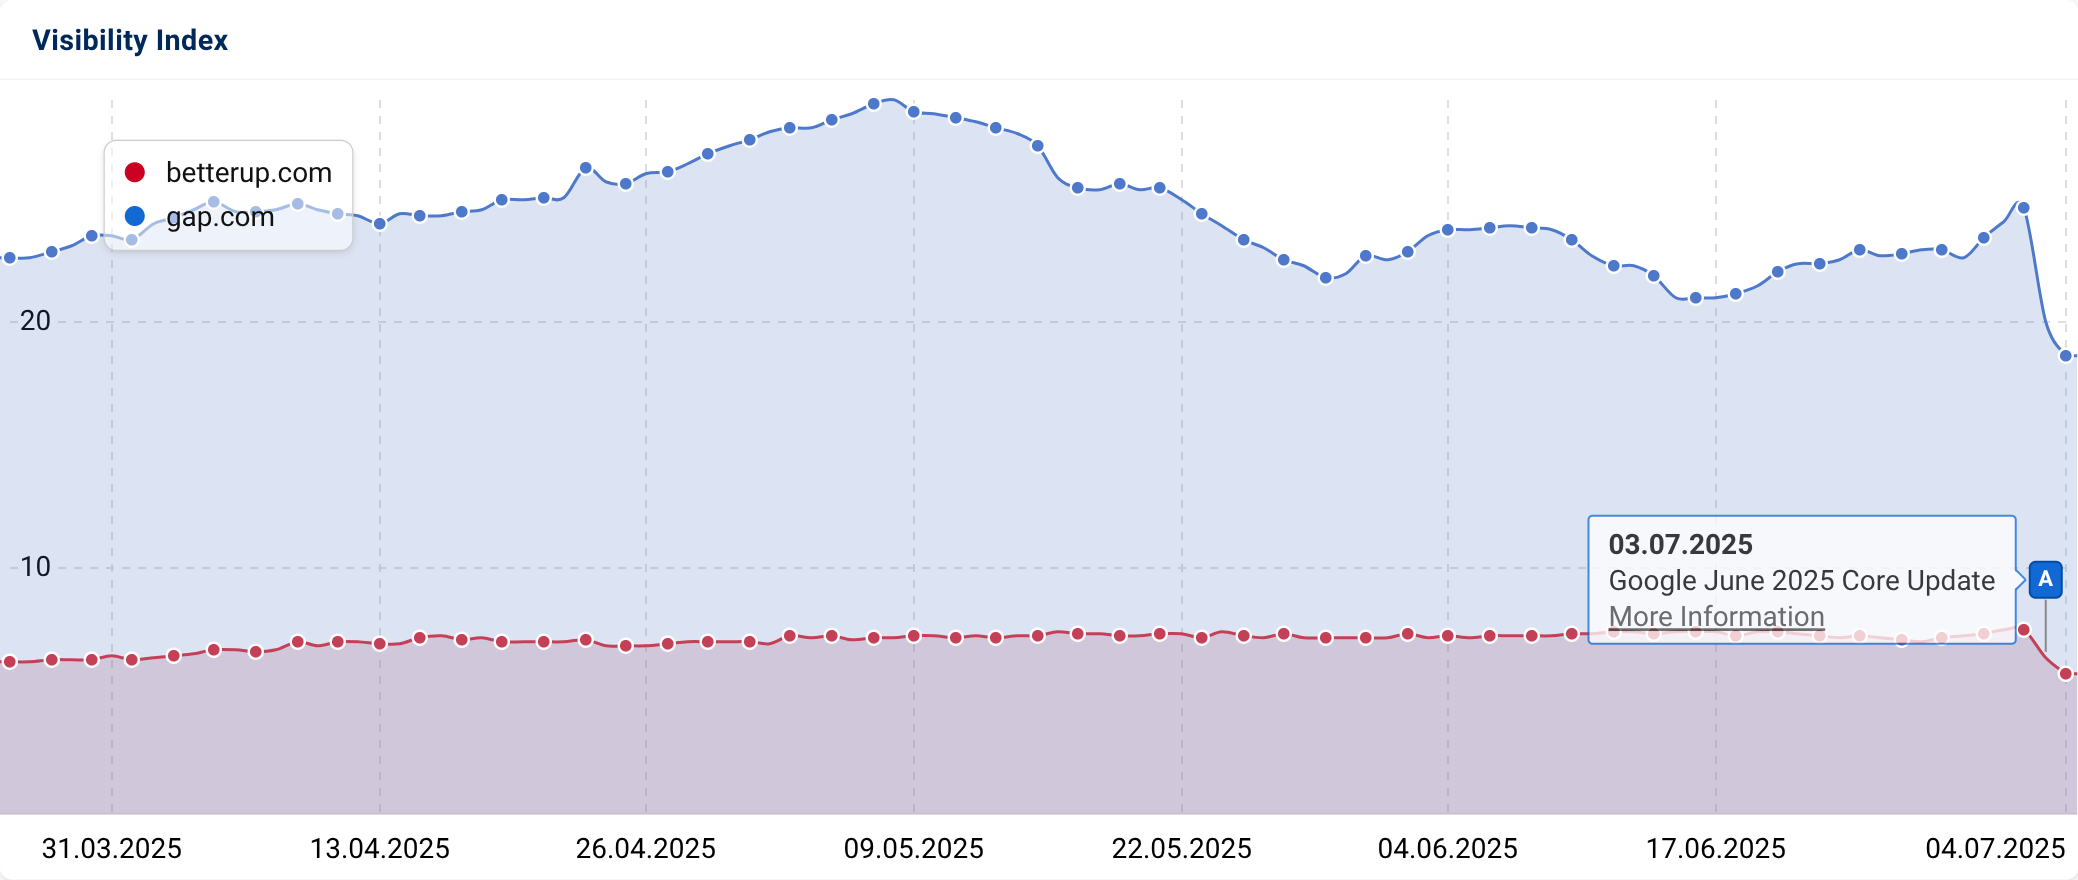
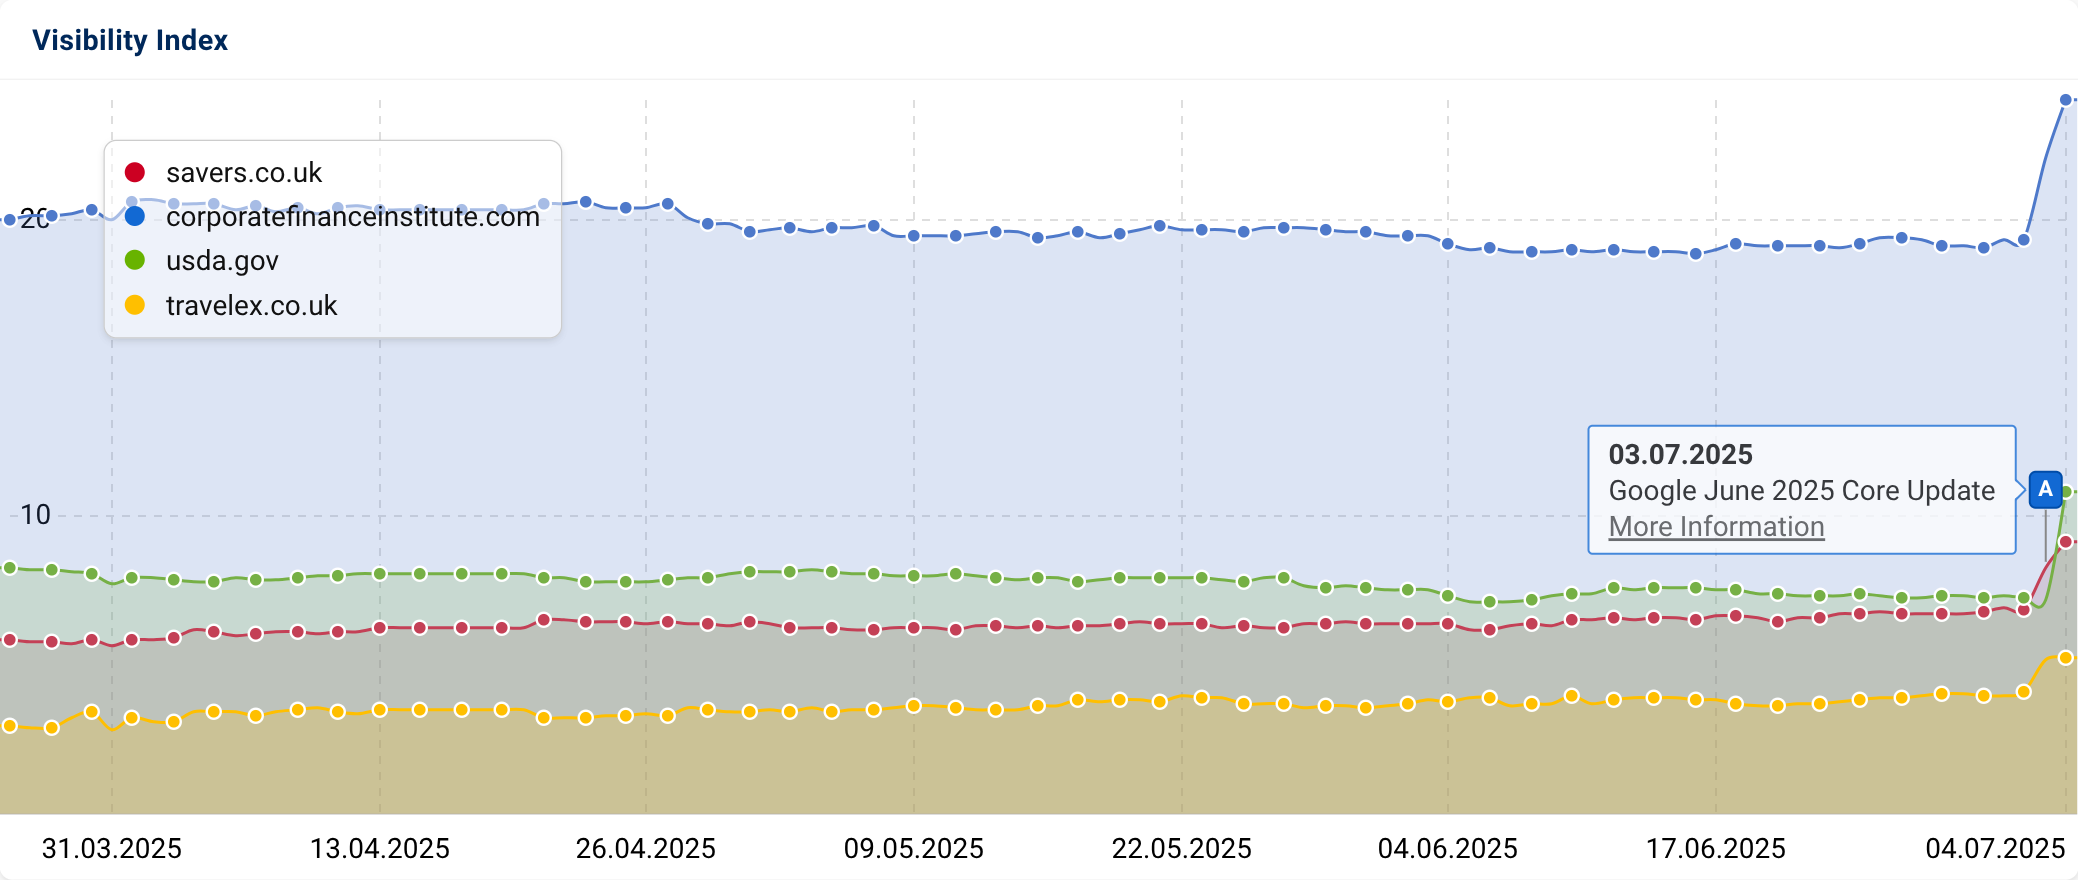
There examples of winning domains which shows us that the Core Update affected domains both positively and negatively.
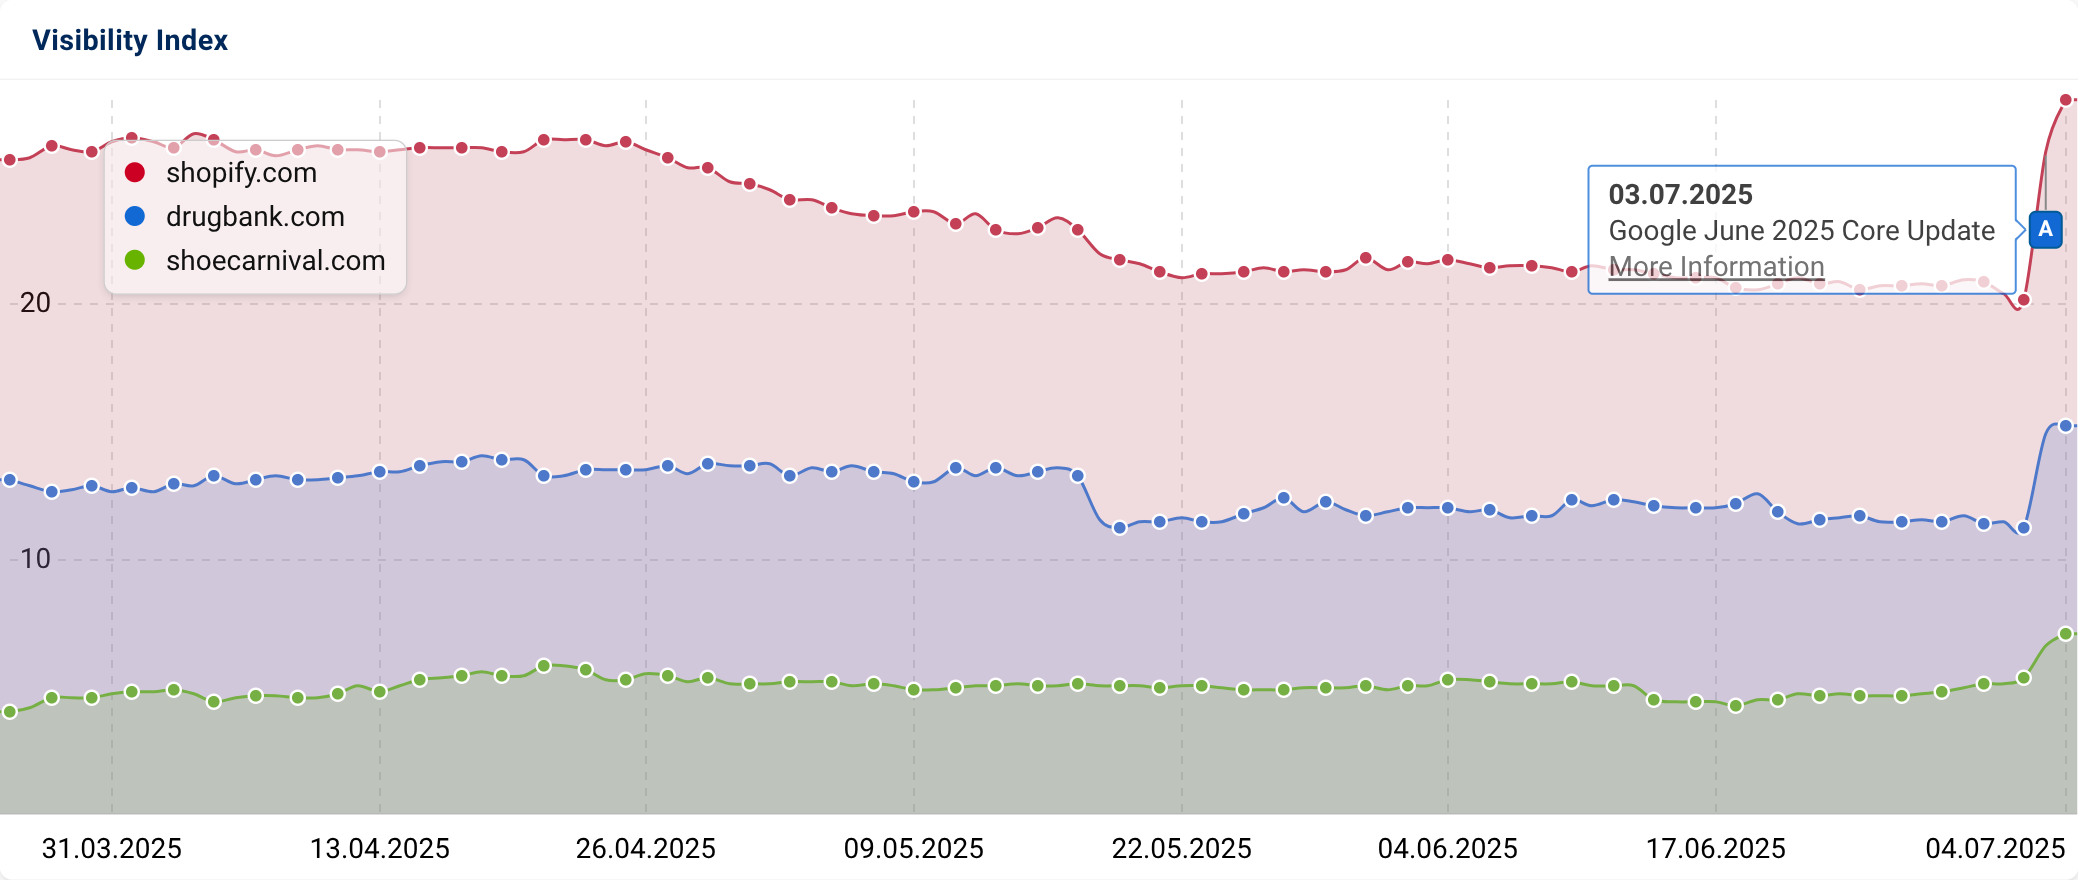
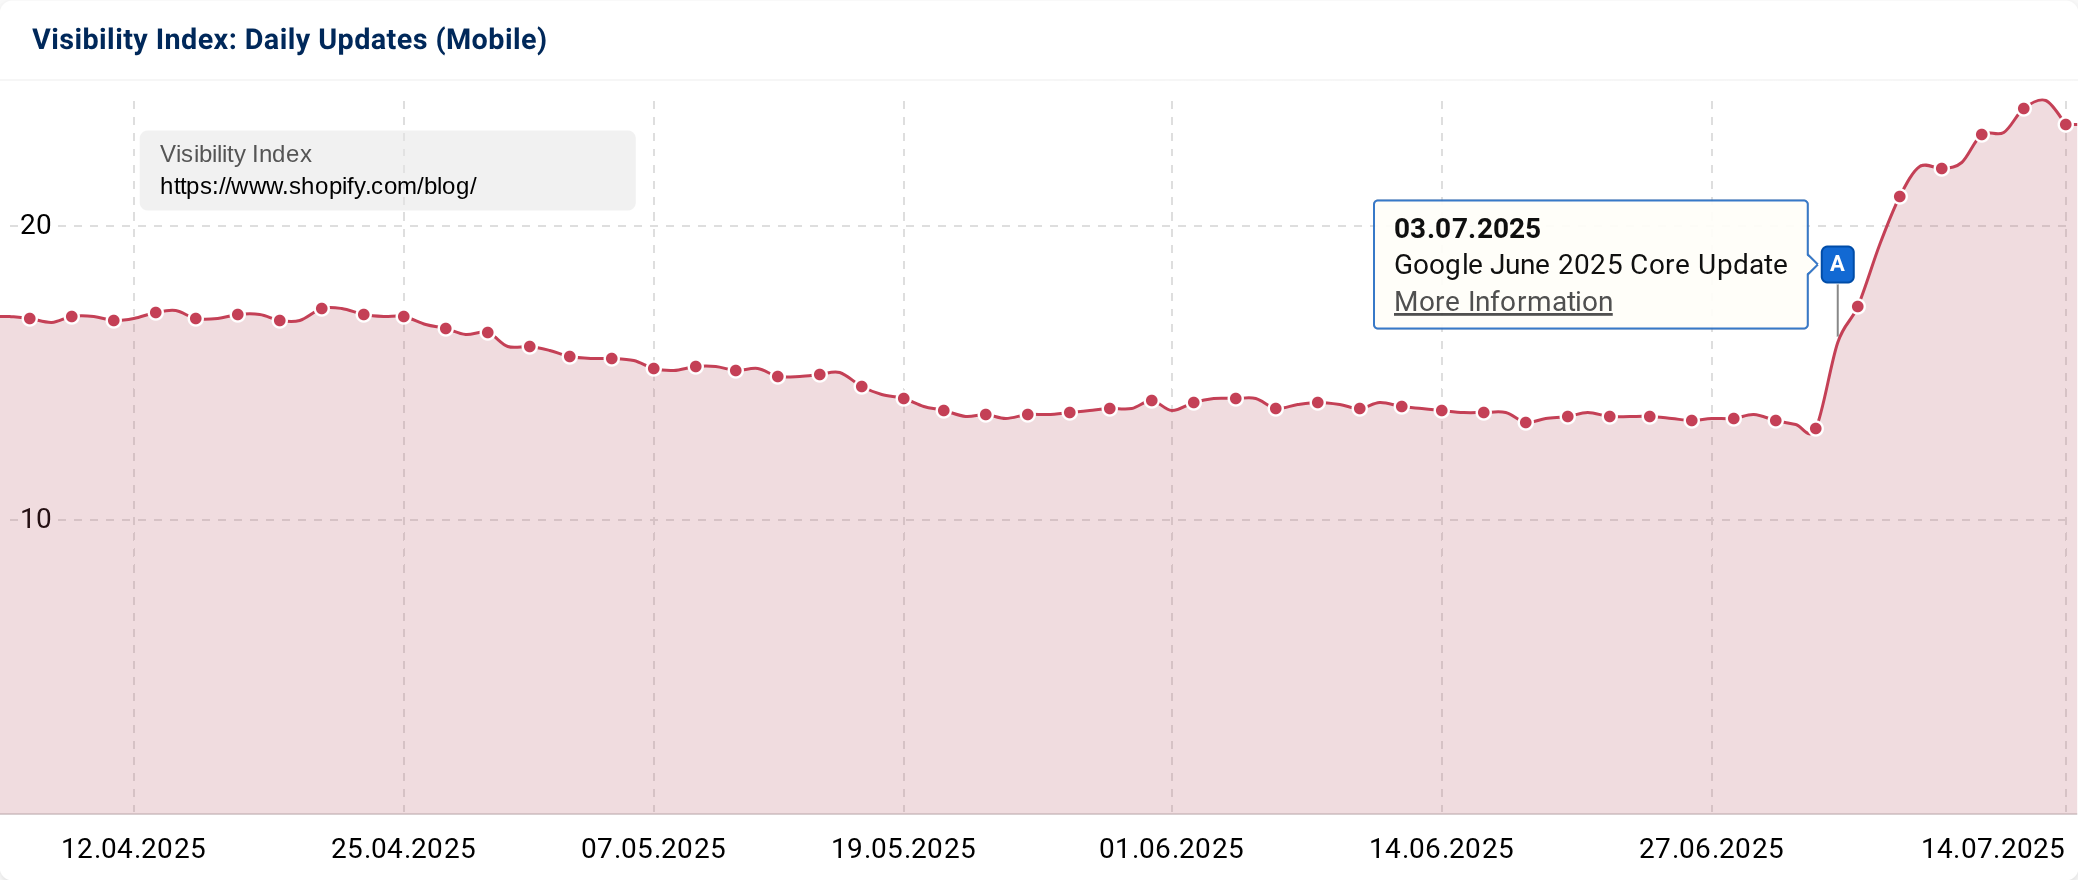
An interesting case here is Shopify. The domain is gaining in many countries.
The informational content in /blog is seeing large gains.
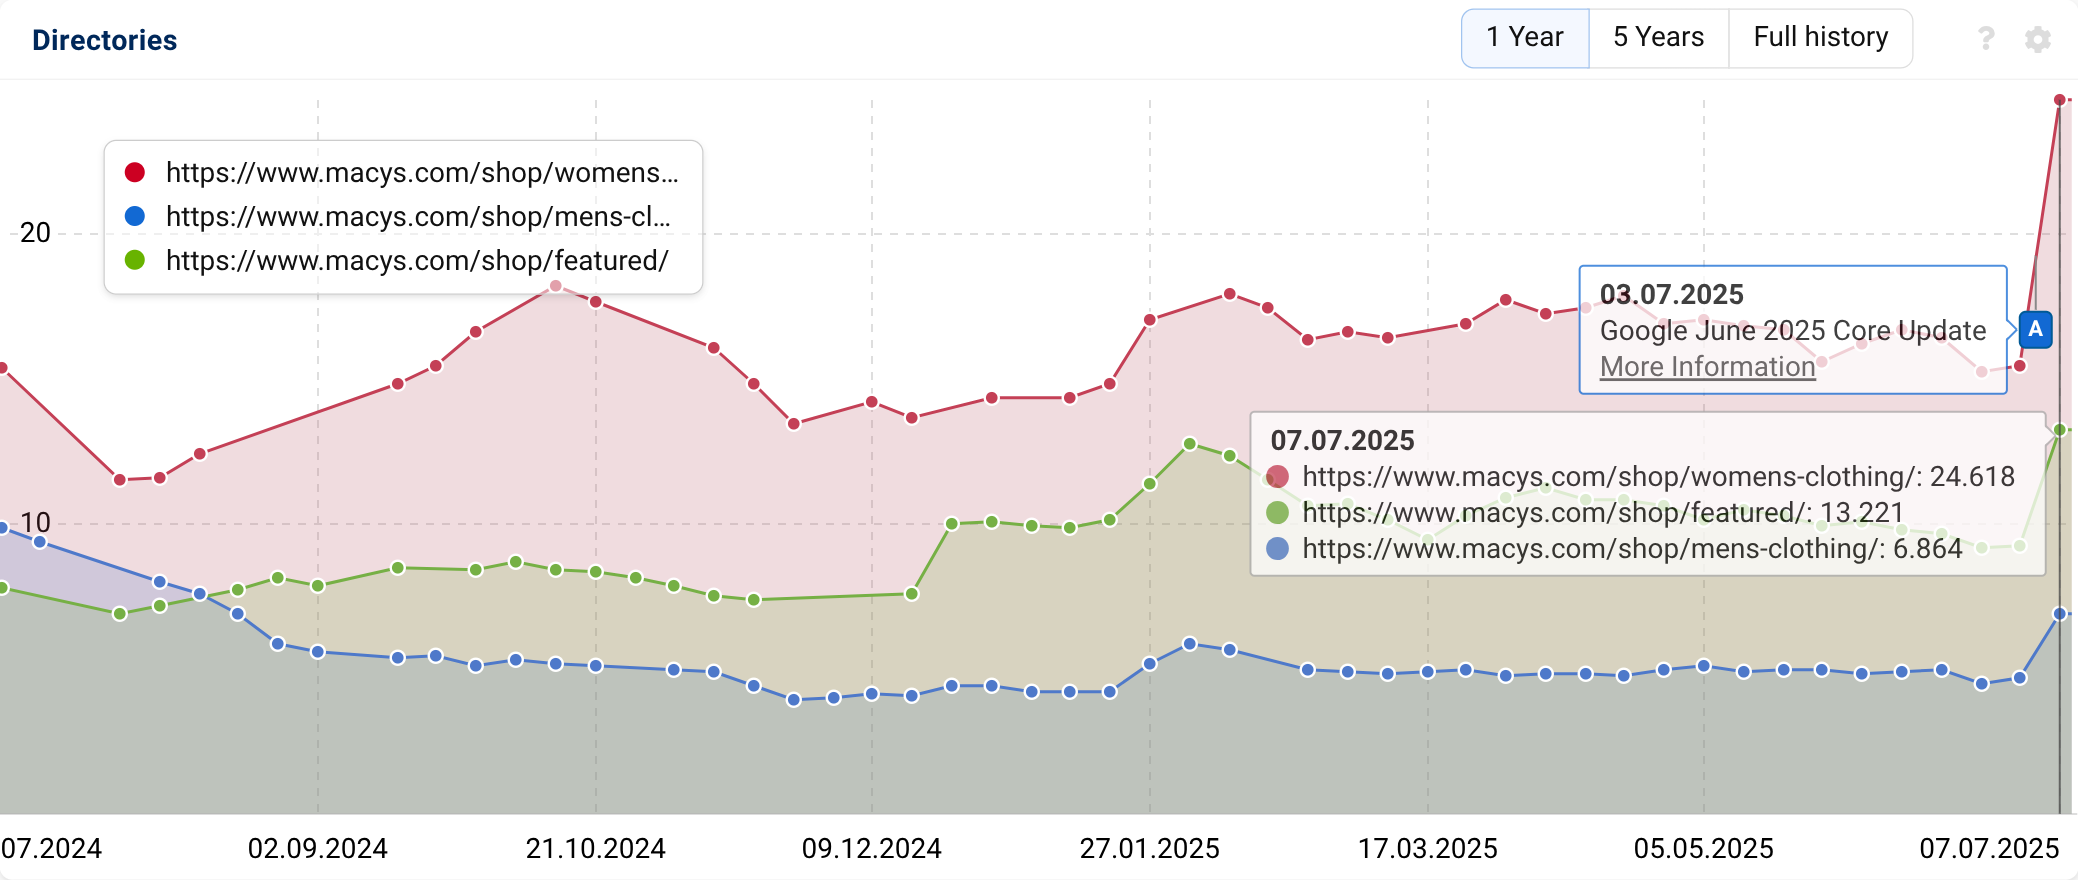
In the graph below we see Macys’ website rising in visibility across their commercial pages. Analysis reveals that visibility is gaining in both commercial and informational searches for these ecommerce directories.
Some domains show evidence that a third wave of changes happened in the last 3 days of the Core Update.


Winners and losers from the June Core Update (UK and UK, Sortable table)
These established domains (domains starting with a visibility of over 1) have risen or fallen significantly during the period of the June Core Update.
Examples of gains and losses during the period of the June Core Update from the US and UK are listed in the sortable, searchable table below.
| Domain | VI 02.07.2025 | VI 17.07.2025 | VI Change | % change | Country |
|---|---|---|---|---|---|
| nihcm.org | 2.18 | 11.05 | 8.87 | 406.88% | US |
| picclick.co.uk | 1.13 | 4.63 | 3.50 | 310.37% | UK |
| urbandictionary.com | 2.92 | 11.05 | 8.13 | 278.42% | US |
| puppies.com | 2.09 | 6.96 | 4.87 | 233.01% | US |
| urbandictionary.com | 6.40 | 20.09 | 13.69 | 213.84% | UK |
| fergusonhome.com | 1.32 | 3.58 | 2.26 | 171.21% | US |
| letterboxd.com | 10.17 | 26.72 | 16.55 | 162.73% | US |
| 24timezones.com | 2.92 | 7.52 | 4.60 | 157.53% | US |
| resetera.com | 1.51 | 3.78 | 2.27 | 150.33% | US |
| cazoo.co.uk | 3.67 | 8.98 | 5.31 | 144.63% | UK |
| zazzle.com | 2.43 | 5.84 | 3.41 | 140.33% | US |
| disboards.com | 1.25 | 2.91 | 1.66 | 132.80% | US |
| letterboxd.com | 18.50 | 41.74 | 23.24 | 125.59% | UK |
| songfacts.com | 4.36 | 9.79 | 5.43 | 124.54% | US |
| softwareadvice.co.uk | 1.86 | 4.14 | 2.28 | 122.67% | UK |
| seekingalpha.com | 1.79 | 3.86 | 2.07 | 115.64% | US |
| zoominfo.com | 3.10 | 6.62 | 3.52 | 113.55% | US |
| windsorstore.com | 3.15 | 6.67 | 3.52 | 111.75% | US |
| underarmour.com | 1.40 | 2.94 | 1.54 | 110.00% | US |
| zoominfo.com | 1.71 | 3.57 | 1.86 | 108.35% | UK |
| mobiles24.co | 2.67 | 5.56 | 2.89 | 108.24% | US |
| houseofbruar.com | 1.32 | 2.75 | 1.43 | 108.01% | UK |
| vets4pets.com | 1.47 | 3.04 | 1.57 | 107.09% | UK |
| passport.service.gov.uk | 1.33 | 2.74 | 1.42 | 106.55% | UK |
| songfacts.com | 8.06 | 16.63 | 8.57 | 106.34% | UK |
| azquotes.com | 1.48 | 2.97 | 1.50 | 101.42% | UK |
| mindtrip.ai | 1.32 | 2.65 | 1.33 | 100.76% | US |
| hinative.com | 2.33 | 4.61 | 2.27 | 97.39% | UK |
| thelawdictionary.org | 1.09 | 2.11 | 1.02 | 93.58% | US |
| shazam.com | 9.07 | 17.53 | 8.47 | 93.39% | UK |
| wordwebonline.com | 3.41 | 6.56 | 3.15 | 92.20% | UK |
| what-song.com | 1.44 | 2.76 | 1.32 | 92.07% | UK |
| snipesusa.com | 1.03 | 1.97 | 0.94 | 91.26% | US |
| hinative.com | 4.00 | 7.64 | 3.64 | 91.00% | US |
| chicos.com | 1.15 | 2.19 | 1.04 | 90.43% | US |
| amlegal.com | 1.03 | 1.96 | 0.93 | 90.29% | US |
| gardenbuildingsdirect.co.uk | 1.69 | 3.19 | 1.50 | 88.42% | UK |
| hockeydb.com | 1.63 | 3.07 | 1.44 | 88.34% | US |
| plowhearth.com | 1.25 | 2.34 | 1.09 | 87.20% | US |
| ofsted.gov.uk | 3.27 | 6.11 | 2.84 | 86.74% | UK |
| weddingbee.com | 1.28 | 2.39 | 1.11 | 86.72% | US |
| theparking-cars.co.uk | 1.44 | 2.68 | 1.24 | 86.12% | UK |
| truepeoplesearch.com | 1.20 | 2.22 | 1.02 | 85.00% | US |
| fineartamerica.com | 1.46 | 2.69 | 1.23 | 84.25% | US |
| shopify.com | 20.22 | 37.15 | 16.93 | 83.73% | US |
| nationaleatingdisorders.org | 1.02 | 1.84 | 0.82 | 80.39% | US |
| shoecarnival.com | 5.32 | 9.56 | 4.24 | 79.70% | US |
| screenonline.org.uk | 1.73 | 3.10 | 1.38 | 79.53% | UK |
| xhamster19.com | 1.21 | 2.16 | 0.96 | 79.25% | UK |
| zazzle.co.uk | 2.26 | 4.03 | 1.78 | 78.57% | UK |
| seascanner.co.uk | 1.02 | 1.81 | 0.79 | 76.86% | UK |
| westnorthants.gov.uk | 1.27 | 2.25 | 0.97 | 76.30% | UK |
| pricerunner.com | 14.10 | 24.80 | 10.70 | 75.89% | UK |
| justanswer.co.uk | 1.24 | 2.18 | 0.94 | 75.60% | UK |
| acl.gov | 1.13 | 1.98 | 0.85 | 75.22% | US |
| kiddle.co | 4.29 | 7.51 | 3.22 | 75.06% | US |
| driverscape.com | 1.01 | 1.76 | 0.75 | 74.26% | US |
| consumeraffairs.com | 2.01 | 3.50 | 1.49 | 74.13% | US |
| wordwebonline.com | 2.78 | 4.80 | 2.02 | 72.66% | US |
| kiddle.co | 5.40 | 9.25 | 3.85 | 71.44% | UK |
| schoolhouse.com | 1.01 | 1.73 | 0.72 | 71.29% | US |
| samhsa.gov | 7.96 | 13.61 | 5.65 | 70.98% | US |
| jetbluevacations.com | 1.97 | 3.36 | 1.39 | 70.56% | US |
| wagedayadvance.co.uk | 1.89 | 3.18 | 1.29 | 68.57% | UK |
| c-sharpcorner.com | 1.08 | 1.82 | 0.74 | 68.52% | US |
| biologyonline.com | 1.20 | 2.02 | 0.82 | 68.33% | US |
| almanac.com | 11.08 | 18.63 | 7.55 | 68.14% | US |
| threads.com | 4.22 | 7.08 | 2.86 | 67.77% | US |
| fortune.com | 2.51 | 4.18 | 1.67 | 66.53% | US |
| fiveable.me | 5.18 | 8.59 | 3.42 | 66.02% | UK |
| encyclopedia.com | 2.70 | 4.48 | 1.78 | 65.93% | US |
| free-codecs.com | 1.26 | 2.09 | 0.83 | 65.87% | US |
| shazam.com | 8.80 | 14.59 | 5.79 | 65.80% | US |
| hellothinkster.com | 2.17 | 3.57 | 1.40 | 64.52% | US |
| selectfashion.co.uk | 1.30 | 2.13 | 0.83 | 64.30% | UK |
| overstock.com | 2.71 | 4.45 | 1.74 | 64.21% | US |
| ludwig.guru | 1.95 | 3.20 | 1.25 | 64.10% | US |
| rocketreach.co | 1.30 | 2.13 | 0.83 | 63.75% | UK |
| john-clark.co.uk | 1.19 | 1.95 | 0.76 | 63.70% | UK |
| elixirgardensupplies.co.uk | 1.31 | 2.14 | 0.83 | 63.53% | UK |
| holisticshop.co.uk | 1.95 | 3.18 | 1.24 | 63.53% | UK |
| merseyworld.com | 1.02 | 1.66 | 0.64 | 63.35% | UK |
| stockanalysis.com | 1.52 | 2.48 | 0.96 | 63.16% | US |
| historyhit.com | 1.03 | 1.68 | 0.65 | 63.11% | US |
| pricespy.co.uk | 8.75 | 14.24 | 5.49 | 62.70% | UK |
| frontier.com | 1.50 | 2.43 | 0.93 | 62.00% | US |
| purewow.com | 1.03 | 1.67 | 0.64 | 61.92% | UK |
| grammarist.com | 1.09 | 1.76 | 0.67 | 61.84% | UK |
| hollywood.uk.com | 1.42 | 2.30 | 0.88 | 61.73% | UK |
| tubitv.com | 11.44 | 18.48 | 7.04 | 61.54% | US |
| kelkoo.co.uk | 1.97 | 3.17 | 1.20 | 61.18% | UK |
| robinhood.com | 2.67 | 4.29 | 1.62 | 60.67% | US |
| eloquii.com | 1.88 | 3.02 | 1.14 | 60.64% | US |
| online-learning-college.com | 1.07 | 1.71 | 0.64 | 60.38% | UK |
| almanac.com | 5.26 | 8.43 | 3.17 | 60.18% | UK |
| petrolprices.com | 1.11 | 1.78 | 0.67 | 60.05% | UK |
| yandex.com | 1.48 | 2.36 | 0.88 | 59.81% | UK |
| pricecharting.com | 3.37 | 5.38 | 2.01 | 59.64% | US |
| arxiv.org | 3.08 | 4.91 | 1.83 | 59.42% | US |
| encyclopedia.com | 5.80 | 9.25 | 3.45 | 59.40% | UK |
| thediamondstore.co.uk | 3.12 | 4.97 | 1.85 | 59.35% | UK |
| eyetek.co.uk | 1.39 | 2.21 | 0.82 | 59.14% | UK |
| money.com | 1.49 | 2.37 | 0.88 | 59.06% | US |
| notcutts.co.uk | 1.18 | 1.88 | 0.70 | 58.92% | UK |
| fox13news.com | 1.03 | 1.63 | 0.60 | 58.25% | US |
| fiveable.me | 7.83 | 12.39 | 4.56 | 58.24% | US |
| yandex.com | 3.32 | 5.25 | 1.93 | 58.13% | US |
| yorkfitness.com | 1.11 | 1.76 | 0.64 | 57.97% | UK |
| grandcanyonlodges.com | 1.35 | 2.13 | 0.78 | 57.78% | US |
| lawinsider.com | 2.64 | 4.16 | 1.52 | 57.63% | UK |
| unibet.co.uk | 1.88 | 2.97 | 1.09 | 57.59% | UK |
| digital-photography-school.com | 1.34 | 2.11 | 0.77 | 57.46% | US |
| cafeappliances.com | 1.29 | 2.03 | 0.74 | 57.36% | US |
| savers.co.uk | 6.87 | 10.80 | 3.93 | 57.27% | UK |
| performancebike.com | 1.19 | 1.87 | 0.68 | 57.14% | US |
| firstdirect.com | 2.07 | 3.26 | 1.18 | 57.14% | UK |
| finishline.com | 2.40 | 3.77 | 1.37 | 57.08% | US |
| womanandhome.com | 1.31 | 2.06 | 0.75 | 56.87% | UK |
| nathanjames.com | 1.18 | 1.85 | 0.67 | 56.78% | US |
| steemit.com | 1.13 | 1.77 | 0.64 | 56.64% | US |
| thenorthface.com | 2.79 | 4.37 | 1.58 | 56.63% | US |
| gsequestrian.co.uk | 2.05 | 3.21 | 1.16 | 56.54% | UK |
| primaryhomeworkhelp.co.uk | 1.11 | 1.74 | 0.63 | 56.54% | UK |
| thamesvalley.police.uk | 1.04 | 1.62 | 0.59 | 56.36% | UK |
| a-z-animals.com | 1.99 | 3.11 | 1.12 | 56.28% | US |
| accountingtools.com | 1.03 | 1.61 | 0.58 | 56.16% | UK |
| newsweek.com | 5.29 | 8.26 | 2.97 | 56.14% | US |
| royaldevon.nhs.uk | 1.15 | 1.79 | 0.64 | 56.10% | UK |
| pennmedicine.org | 9.19 | 14.34 | 5.15 | 56.04% | US |
| oasisinet.com | 1.72 | 2.69 | 0.97 | 56.01% | UK |
| wholesaleclearance.co.uk | 1.22 | 1.90 | 0.68 | 55.56% | UK |
| promgirl.com | 2.17 | 3.37 | 1.20 | 55.30% | US |
| foxbusiness.com | 1.80 | 2.79 | 0.99 | 55.00% | US |
| threads.com | 1.99 | 3.08 | 1.09 | 54.95% | UK |
| aldoshoes.com | 2.53 | 3.92 | 1.39 | 54.94% | US |
| virginmediao2.co.uk | 1.28 | 1.98 | 0.70 | 54.93% | UK |
| pcliquidations.com | 1.34 | 2.07 | 0.73 | 54.48% | US |
| thredup.com | 5.71 | 8.82 | 3.11 | 54.47% | US |
| huskers.com | 1.16 | 1.79 | 0.63 | 54.31% | US |
| finviz.com | 1.05 | 1.62 | 0.57 | 54.29% | US |
| disneyplus.com | 18.59 | 28.68 | 10.09 | 54.25% | UK |
| homebuilding.co.uk | 2.99 | 4.60 | 1.61 | 53.90% | UK |
| damart.co.uk | 1.44 | 2.22 | 0.78 | 53.81% | UK |
| myjobscotland.gov.uk | 1.10 | 1.69 | 0.59 | 53.55% | UK |
| themoviedb.org | 15.13 | 23.22 | 8.09 | 53.50% | UK |
| thelawdictionary.org | 1.01 | 1.55 | 0.54 | 53.42% | UK |
| nifc.gov | 1.03 | 1.58 | 0.55 | 53.40% | US |
| leetcode.com | 1.24 | 1.90 | 0.66 | 53.23% | US |
| hermes.com | 1.28 | 1.96 | 0.68 | 53.13% | US |
| familydoctor.org | 1.37 | 2.09 | 0.72 | 52.55% | US |
| verabradley.com | 2.35 | 3.58 | 1.23 | 52.34% | US |
| familydoctor.org | 1.66 | 2.53 | 0.87 | 52.25% | UK |
| clubllondon.us | 1.14 | 1.73 | 0.59 | 51.75% | US |
| xhaccess.com | 2.67 | 4.05 | 1.38 | 51.63% | UK |
| themoviedb.org | 15.60 | 23.64 | 8.04 | 51.54% | US |
| wanderlog.com | 1.01 | 1.53 | 0.52 | 51.49% | US |
| betus.com.pa | 1.36 | 2.06 | 0.70 | 51.47% | US |
| oyez.org | 2.24 | 3.39 | 1.15 | 51.34% | US |
| rawpixel.com | 1.21 | 1.83 | 0.62 | 51.24% | US |
| ludwig.guru | 4.52 | 6.82 | 2.30 | 50.88% | UK |
| evenue.net | 1.36 | 2.05 | 0.69 | 50.74% | US |
| chronicle.com | 1.38 | 2.08 | 0.70 | 50.72% | US |
| dxl.com | 1.46 | 2.20 | 0.74 | 50.68% | US |
| xnxx.com | 20.42 | 30.71 | 10.29 | 50.39% | US |
| jjill.com | 1.35 | 2.03 | 0.68 | 50.37% | US |
| mango.com | 1.04 | 1.56 | 0.52 | 50.00% | US |
| wordnik.com | 1.90 | 2.85 | 0.95 | 50.00% | US |
| rejuvenation.com | 2.71 | 4.06 | 1.35 | 49.82% | US |
| examine.com | 1.15 | 1.72 | 0.57 | 49.48% | UK |
| cargurus.com | 7.37 | 11.01 | 3.64 | 49.39% | US |
| uk-car-discount.co.uk | 1.47 | 2.19 | 0.72 | 49.25% | UK |
| carvana.com | 5.98 | 8.92 | 2.94 | 49.16% | US |
| omnihotels.com | 5.70 | 8.50 | 2.80 | 49.12% | US |
| powerthesaurus.org | 2.12 | 3.17 | 1.04 | 49.08% | UK |
| historyhit.com | 2.42 | 3.61 | 1.19 | 49.05% | UK |
| arxiv.org | 3.29 | 4.91 | 1.62 | 49.03% | UK |
| naturesbest.co.uk | 2.16 | 3.22 | 1.06 | 48.84% | UK |
| politico.com | 3.36 | 5.00 | 1.64 | 48.81% | US |
| katom.com | 1.15 | 1.71 | 0.56 | 48.70% | US |
| time4sleep.co.uk | 1.22 | 1.82 | 0.60 | 48.69% | UK |
| barrheadtravel.co.uk | 1.03 | 1.53 | 0.50 | 48.64% | UK |
| tescobank.com | 4.15 | 6.16 | 2.01 | 48.49% | UK |
| hibbett.com | 1.39 | 2.06 | 0.67 | 48.20% | US |
| americanmusical.com | 2.22 | 3.29 | 1.07 | 48.20% | US |
| ncsecu.org | 1.10 | 1.63 | 0.53 | 48.18% | US |
| redwingshoes.com | 1.27 | 1.88 | 0.61 | 48.03% | US |
| alison.com | 1.91 | 2.83 | 0.92 | 48.01% | UK |
| stardewvalleywiki.com | 2.01 | 2.97 | 0.96 | 48.01% | UK |
| bakingwithgranny.co.uk | 1.30 | 1.92 | 0.62 | 47.96% | UK |
| 24timezones.com | 5.67 | 8.38 | 2.72 | 47.95% | UK |
| locanto.com | 1.86 | 2.75 | 0.89 | 47.85% | US |
| familylives.org.uk | 1.13 | 1.67 | 0.54 | 47.74% | UK |
| yorkshiretrading.com | 1.31 | 1.93 | 0.62 | 47.67% | UK |
| ifixit.com | 5.25 | 7.75 | 2.50 | 47.62% | US |
| tipranks.com | 1.43 | 2.11 | 0.68 | 47.55% | US |
| theweatheroutlook.com | 1.26 | 1.86 | 0.60 | 47.54% | UK |
| historic-uk.com | 3.01 | 4.44 | 1.43 | 47.51% | US |
| cozycozy.com | 1.79 | 2.64 | 0.85 | 47.49% | US |
| littlewoods.com | 2.94 | 4.33 | 1.39 | 47.40% | UK |
| paydayuk.co.uk | 1.15 | 1.70 | 0.55 | 47.40% | UK |
| unitarium.com | 4.42 | 6.51 | 2.09 | 47.29% | US |
| pauladeen.com | 1.10 | 1.62 | 0.52 | 47.27% | US |
| simplyhired.co.uk | 1.97 | 2.89 | 0.93 | 47.23% | UK |
| everydayhealth.com | 3.14 | 4.62 | 1.48 | 47.13% | US |
| woodburnerwarehouse.co.uk | 1.02 | 1.51 | 0.48 | 47.12% | UK |
| sanmar.com | 1.34 | 1.97 | 0.63 | 47.01% | US |
| definitions.net | 2.87 | 4.22 | 1.35 | 47.00% | UK |
| onlineconverter.com | 1.09 | 1.60 | 0.51 | 46.79% | US |
| zippia.com | 1.25 | 1.83 | 0.58 | 46.40% | US |
| bleacherreport.com | 1.71 | 2.50 | 0.79 | 46.20% | US |
| stardewvalleywiki.com | 2.49 | 3.64 | 1.15 | 46.18% | US |
| wikiwand.com | 2.00 | 2.92 | 0.92 | 46.00% | US |
| wikiwand.com | 6.75 | 9.84 | 3.08 | 45.66% | UK |
| thingsremembered.com | 1.01 | 1.47 | 0.46 | 45.54% | US |
| dadeschools.net | 1.74 | 2.53 | 0.79 | 45.40% | US |
| on.com | 1.15 | 1.67 | 0.52 | 45.22% | US |
| sawmillcreek.org | 2.38 | 3.45 | 1.07 | 44.96% | US |
| companiesmarketcap.com | 1.06 | 1.53 | 0.47 | 44.84% | UK |
| nyse.com | 3.15 | 4.56 | 1.41 | 44.76% | US |
| lawinsider.com | 4.85 | 7.02 | 2.17 | 44.74% | US |
| voiply.com | 2.06 | 2.98 | 0.92 | 44.66% | US |
| lumberliquidators.com | 1.21 | 1.75 | 0.54 | 44.63% | US |
| tiso.com | 1.90 | 2.74 | 0.85 | 44.57% | UK |
| audioholics.com | 1.37 | 1.98 | 0.61 | 44.53% | US |
| deadline.com | 5.10 | 7.37 | 2.27 | 44.51% | US |
| wikisource.org | 1.10 | 1.59 | 0.49 | 44.48% | UK |
| lifeisgood.com | 1.60 | 2.31 | 0.71 | 44.38% | US |
| the-sun.com | 1.49 | 2.15 | 0.66 | 44.30% | US |
| officiallondontheatre.com | 2.10 | 3.03 | 0.93 | 44.24% | UK |
| getapp.co.uk | 1.53 | 2.21 | 0.68 | 44.20% | UK |
| tubitv.com | 1.95 | 2.81 | 0.86 | 44.10% | UK |
| thepsychictree.co.uk | 2.42 | 3.48 | 1.07 | 44.04% | UK |
| klook.com | 1.00 | 1.44 | 0.44 | 44.00% | US |
| ufc.com | 1.27 | 1.82 | 0.56 | 43.96% | UK |
| simplypsychology.org | 4.27 | 6.14 | 1.87 | 43.79% | US |
| suitshop.com | 1.03 | 1.48 | 0.45 | 43.69% | US |
| playfulpromises.com | 1.56 | 2.24 | 0.68 | 43.68% | UK |
| free-codecs.com | 1.24 | 1.78 | 0.54 | 43.66% | UK |
| baseball-reference.com | 17.59 | 25.24 | 7.65 | 43.49% | US |
| greavessports.com | 1.04 | 1.50 | 0.45 | 43.47% | UK |
| virginmoney.com | 3.89 | 5.58 | 1.69 | 43.35% | UK |
| lsd.law | 1.43 | 2.05 | 0.62 | 43.30% | UK |
| arhaus.com | 2.34 | 3.35 | 1.01 | 43.16% | US |
| greekmythology.com | 1.10 | 1.57 | 0.47 | 42.73% | US |
| skinnytaste.com | 2.67 | 3.81 | 1.14 | 42.70% | US |
| historic-uk.com | 6.26 | 8.94 | 2.67 | 42.66% | UK |
| frommers.com | 1.08 | 1.54 | 0.46 | 42.59% | US |
| findcourses.co.uk | 1.11 | 1.59 | 0.47 | 42.59% | UK |
| wordsmyth.net | 10.00 | 14.25 | 4.25 | 42.50% | US |
| man7.org | 3.25 | 4.63 | 1.38 | 42.46% | US |
| calmatters.org | 1.18 | 1.68 | 0.50 | 42.37% | US |
| bobistheoilguy.com | 2.03 | 2.89 | 0.86 | 42.36% | US |
| drugbank.com | 11.20 | 15.94 | 4.74 | 42.32% | US |
| axios.com | 2.67 | 3.80 | 1.13 | 42.32% | US |
| statefarm.com | 5.13 | 7.30 | 2.17 | 42.30% | US |
| fortune.com | 1.11 | 1.57 | 0.47 | 42.26% | UK |
| eden.co.uk | 3.62 | 5.15 | 1.53 | 42.17% | UK |
| centralbedfordshire.gov.uk | 1.01 | 1.44 | 0.43 | 42.08% | UK |
| mybobs.com | 3.45 | 4.90 | 1.45 | 42.03% | US |
| dazn.com | 1.96 | 2.78 | 0.82 | 41.99% | UK |
| humana.com | 2.24 | 3.18 | 0.94 | 41.96% | US |
| hottopic.com | 1.55 | 2.20 | 0.65 | 41.94% | US |
| lovetoknow.com | 1.12 | 1.58 | 0.47 | 41.85% | UK |
| ufurnish.com | 3.48 | 4.94 | 1.46 | 41.79% | UK |
| thechive.com | 1.01 | 1.43 | 0.42 | 41.58% | US |
| answers.com | 2.05 | 2.90 | 0.85 | 41.46% | US |
| dictzone.com | 1.28 | 1.81 | 0.53 | 41.36% | UK |
| nbcwashington.com | 1.04 | 1.47 | 0.43 | 41.35% | US |
| abc7chicago.com | 1.77 | 2.50 | 0.73 | 41.24% | US |
| thisoldhouse.com | 5.66 | 7.99 | 2.33 | 41.17% | US |
| everydayhealth.com | 3.73 | 5.27 | 1.53 | 41.10% | UK |
| ifixit.com | 3.70 | 5.21 | 1.51 | 40.94% | UK |
| pronovias.com | 1.01 | 1.42 | 0.41 | 40.90% | UK |
| health.gov | 4.19 | 5.90 | 1.71 | 40.81% | US |
| peoples-law.org | 1.45 | 2.04 | 0.59 | 40.69% | US |
| splashlearn.com | 3.48 | 4.89 | 1.41 | 40.60% | UK |
| rockler.com | 1.21 | 1.70 | 0.49 | 40.50% | US |
| emmasdiary.co.uk | 2.93 | 4.11 | 1.18 | 40.41% | UK |
| ruggable.co.uk | 2.31 | 3.24 | 0.93 | 40.41% | UK |
| scribbr.com | 6.20 | 8.71 | 2.51 | 40.41% | UK |
| bigmotoringworld.co.uk | 1.73 | 2.43 | 0.70 | 40.37% | UK |
| princesspolly.com | 2.88 | 4.04 | 1.16 | 40.28% | US |
| vinmec.com | 2.36 | 3.31 | 0.95 | 40.25% | US |
| mappinandwebb.com | 2.00 | 2.81 | 0.81 | 40.19% | UK |
| llbean.com | 2.29 | 3.21 | 0.92 | 40.17% | US |
| nme.com | 4.20 | 5.88 | 1.68 | 40.03% | UK |
| fivestaralliance.com | 1.10 | 1.54 | 0.44 | 40.00% | US |
| baseballsavings.com | 1.05 | 1.47 | 0.42 | 40.00% | US |
| avforums.com | 3.05 | 4.27 | 1.22 | 39.92% | UK |
| aptoide.com | 1.81 | 2.53 | 0.72 | 39.78% | US |
| cricketwireless.com | 1.41 | 1.97 | 0.56 | 39.72% | US |
| discover.com | 11.52 | 16.09 | 4.57 | 39.67% | US |
| nasm.org | 1.59 | 2.22 | 0.63 | 39.62% | US |
| smh.com.au | 1.27 | 1.77 | 0.50 | 39.51% | UK |
| discount-supplements.co.uk | 1.15 | 1.60 | 0.45 | 39.32% | UK |
| file.net | 1.35 | 1.88 | 0.53 | 39.26% | US |
| valuecityfurniture.com | 1.81 | 2.52 | 0.71 | 39.23% | US |
| nunababy.com | 1.02 | 1.42 | 0.40 | 39.22% | US |
| clideo.com | 2.27 | 3.16 | 0.89 | 39.21% | US |
| tunefind.com | 1.43 | 1.99 | 0.56 | 39.16% | US |
| travelex.co.uk | 4.07 | 5.67 | 1.59 | 39.09% | UK |
| mortgagecalculator.org | 2.00 | 2.78 | 0.78 | 39.00% | US |
| myjewishlearning.com | 2.57 | 3.57 | 1.00 | 38.91% | US |
| staples.com | 18.21 | 25.29 | 7.08 | 38.88% | US |
| superlawyers.com | 1.39 | 1.93 | 0.54 | 38.85% | US |
| freep.com | 1.60 | 2.22 | 0.62 | 38.75% | US |
| billyoh.com | 1.77 | 2.46 | 0.69 | 38.74% | UK |
| purple.com | 1.06 | 1.47 | 0.41 | 38.68% | US |
| alison.com | 2.25 | 3.12 | 0.87 | 38.67% | US |
| primevideo.com | 15.25 | 21.13 | 5.88 | 38.53% | UK |
| nowtv.com | 1.89 | 2.61 | 0.73 | 38.49% | UK |
| shopify.com | 17.00 | 23.54 | 6.53 | 38.43% | UK |
| wolfram.com | 7.35 | 10.17 | 2.82 | 38.37% | US |
| tunefind.com | 1.52 | 2.10 | 0.58 | 38.34% | UK |
| mango.com | 2.85 | 3.95 | 1.09 | 38.32% | UK |
| margaritavilleresorts.com | 2.82 | 3.90 | 1.08 | 38.30% | US |
| jerrysartarama.com | 1.15 | 1.59 | 0.44 | 38.26% | US |
| freestuff.co.uk | 1.05 | 1.45 | 0.40 | 38.25% | UK |
| imslp.org | 2.24 | 3.09 | 0.86 | 38.25% | UK |
| biologyonline.com | 1.98 | 2.74 | 0.76 | 38.19% | UK |
| languagetool.org | 1.10 | 1.52 | 0.42 | 38.18% | US |
| ii.co.uk | 2.85 | 3.94 | 1.09 | 38.12% | UK |
| ferguson.com | 1.92 | 2.65 | 0.73 | 38.02% | US |
| balsamhill.com | 2.50 | 3.45 | 0.95 | 38.00% | US |
| barchart.com | 1.45 | 2.00 | 0.55 | 37.93% | US |
| lsd.law | 2.69 | 3.71 | 1.02 | 37.92% | US |
| medievalcollectibles.com | 1.14 | 1.57 | 0.43 | 37.72% | US |
| 9news.com | 1.22 | 1.68 | 0.46 | 37.70% | US |
| uhcw.nhs.uk | 3.25 | 4.46 | 1.21 | 37.32% | UK |
| orvis.com | 2.68 | 3.68 | 1.00 | 37.31% | US |
| xhamster.desi | 1.69 | 2.32 | 0.63 | 37.28% | US |
| coffeeblog.co.uk | 2.52 | 3.46 | 0.94 | 37.20% | UK |
| ok.gov | 1.05 | 1.44 | 0.39 | 37.14% | US |
| netbet.co.uk | 1.50 | 2.06 | 0.56 | 37.11% | UK |
| trustford.co.uk | 1.79 | 2.45 | 0.66 | 37.07% | UK |
| wordnik.com | 1.88 | 2.58 | 0.70 | 36.97% | UK |
| lotteryusa.com | 1.30 | 1.78 | 0.48 | 36.92% | US |
| spoticar.co.uk | 1.05 | 1.44 | 0.39 | 36.91% | UK |
| baeldung.com | 3.04 | 4.16 | 1.12 | 36.84% | US |
| mobilefun.co.uk | 2.80 | 3.82 | 1.03 | 36.66% | UK |
| bestlawyers.com | 1.42 | 1.94 | 0.52 | 36.62% | US |
| primevideo.com | 17.59 | 24.03 | 6.44 | 36.61% | US |
| pennmedicine.org | 2.86 | 3.90 | 1.05 | 36.58% | UK |
| bleacherreport.com | 2.37 | 3.24 | 0.87 | 36.57% | UK |
| perfumeprice.co.uk | 1.35 | 1.85 | 0.49 | 36.57% | UK |
| eurochange.co.uk | 4.22 | 5.76 | 1.54 | 36.52% | UK |
| unitypoint.org | 2.44 | 3.33 | 0.89 | 36.48% | US |
| wincalendar.com | 1.07 | 1.46 | 0.39 | 36.45% | US |
| birdsandblooms.com | 1.29 | 1.76 | 0.47 | 36.43% | US |
| bookscouter.com | 1.02 | 1.39 | 0.37 | 36.27% | US |
| careers.homeoffice.gov.uk | 1.14 | 1.55 | 0.41 | 36.27% | UK |
| 1800flowers.com | 1.14 | 1.56 | 0.41 | 36.13% | UK |
| emiratesholidays.com | 1.65 | 2.24 | 0.59 | 36.09% | UK |
| rieker.co.uk | 1.18 | 1.61 | 0.43 | 36.04% | UK |
| gucci.com | 3.53 | 4.80 | 1.27 | 35.95% | UK |
| dayoutwiththekids.co.uk | 3.58 | 4.86 | 1.29 | 35.93% | UK |
| fragrantica.com | 9.66 | 13.13 | 3.47 | 35.86% | UK |
| skullcandy.co.uk | 1.36 | 1.85 | 0.49 | 35.78% | UK |
| lululemon.co.uk | 1.11 | 1.51 | 0.40 | 35.77% | UK |
| lulus.com | 9.83 | 13.34 | 3.51 | 35.74% | US |
| vinmec.com | 2.82 | 3.83 | 1.01 | 35.74% | UK |
| tvtropes.org | 6.38 | 8.66 | 2.28 | 35.70% | US |
| geolsoc.org.uk | 1.92 | 2.61 | 0.69 | 35.68% | UK |
| baseball-reference.com | 2.99 | 4.05 | 1.06 | 35.55% | UK |
| rexlondon.com | 2.42 | 3.27 | 0.86 | 35.43% | UK |
| greekmythology.com | 3.35 | 4.53 | 1.18 | 35.24% | UK |
| clumsygoat.co.uk | 1.07 | 1.44 | 0.38 | 35.11% | UK |
| ovhcloud.com | 1.42 | 1.92 | 0.50 | 35.07% | UK |
| thefork.co.uk | 1.22 | 1.65 | 0.43 | 35.00% | UK |
| eonline.com | 5.55 | 7.49 | 1.94 | 34.91% | UK |
| birdspot.co.uk | 1.46 | 1.97 | 0.51 | 34.87% | UK |
| media.info | 1.09 | 1.47 | 0.38 | 34.77% | UK |
| poetryarchive.org | 1.02 | 1.37 | 0.35 | 34.65% | UK |
| biblio.co.uk | 2.11 | 2.85 | 0.73 | 34.58% | UK |
| swoopfunding.com | 1.13 | 1.52 | 0.39 | 34.54% | UK |
| pricecharting.com | 1.18 | 1.59 | 0.41 | 34.46% | UK |
| fishmag.co.uk | 1.22 | 1.64 | 0.42 | 34.42% | UK |
| aptoide.com | 1.91 | 2.56 | 0.65 | 34.24% | UK |
| ecatering.co.uk | 1.44 | 1.93 | 0.49 | 34.12% | UK |
| gompels.co.uk | 1.21 | 1.62 | 0.41 | 34.11% | UK |
| consumerfinance.gov | 17.63 | 23.62 | 5.99 | 34.00% | US |
| politico.com | 1.81 | 2.43 | 0.62 | 33.98% | UK |
| computinghistory.org.uk | 1.06 | 1.42 | 0.36 | 33.87% | UK |
| splashlearn.com | 5.98 | 8.00 | 2.02 | 33.82% | US |
| cookfood.net | 1.68 | 2.24 | 0.56 | 33.57% | UK |
| newworldencyclopedia.org | 1.46 | 1.95 | 0.49 | 33.45% | UK |
| songmeanings.com | 11.97 | 15.97 | 4.00 | 33.41% | US |
| plymouthhospitals.nhs.uk | 1.18 | 1.58 | 0.39 | 33.36% | UK |
| citystgeorges.ac.uk | 2.93 | 3.91 | 0.98 | 33.29% | UK |
| scandiborn.co.uk | 2.79 | 3.72 | 0.93 | 33.27% | UK |
| ramsdensjewellery.co.uk | 3.39 | 4.51 | 1.12 | 33.18% | UK |
| roca.com | 1.45 | 1.94 | 0.48 | 33.17% | UK |
| yesss.co.uk | 3.07 | 4.08 | 1.02 | 33.12% | UK |
| uhsussex.nhs.uk | 5.11 | 6.80 | 1.69 | 33.05% | UK |
| newcastle.gov.uk | 1.45 | 1.93 | 0.48 | 33.04% | UK |
| greetingsisland.com | 5.57 | 7.41 | 1.84 | 33.00% | US |
| burberry.com | 3.33 | 4.43 | 1.10 | 32.99% | UK |
| wolfram.com | 8.94 | 11.89 | 2.95 | 32.98% | UK |
| fragrantica.com | 5.13 | 6.82 | 1.69 | 32.97% | US |
| made.com | 4.24 | 5.63 | 1.40 | 32.94% | UK |
| incredibleindia.gov.in | 1.38 | 1.83 | 0.45 | 32.70% | UK |
| tes.com | 6.01 | 7.98 | 1.96 | 32.67% | UK |
| daringgourmet.com | 1.39 | 1.84 | 0.45 | 32.66% | UK |
| bunches.co.uk | 3.89 | 5.15 | 1.26 | 32.51% | UK |
| eonline.com | 8.29 | 10.98 | 2.69 | 32.47% | US |
| marshall.co.uk | 3.91 | 5.18 | 1.27 | 32.46% | UK |
| what0-18.nhs.uk | 1.12 | 1.49 | 0.36 | 32.41% | UK |
| careerexplorer.com | 1.75 | 2.32 | 0.57 | 32.38% | UK |
| mdpi.com | 7.06 | 9.33 | 2.28 | 32.26% | US |
| hostinger.com | 7.06 | 9.33 | 2.27 | 32.17% | US |
| omlet.co.uk | 3.77 | 4.97 | 1.21 | 32.03% | UK |
| a-z-animals.com | 4.32 | 5.70 | 1.38 | 31.88% | UK |
| bloomingdales.com | 8.47 | 11.16 | 2.68 | 31.68% | US |
| hollisterco.com | 4.84 | 6.36 | 1.53 | 31.53% | US |
| geology.com | 6.30 | 8.28 | 1.98 | 31.49% | US |
| kaiserpermanente.org | 12.28 | 16.14 | 3.86 | 31.44% | US |
| posturite.co.uk | 4.23 | 5.54 | 1.31 | 30.84% | UK |
| 1800flowers.com | 6.50 | 8.50 | 2.00 | 30.82% | US |
| iowa.gov | 5.08 | 6.64 | 1.56 | 30.75% | US |
| trustatrader.com | 3.88 | 5.08 | 1.19 | 30.74% | UK |
| haystravel.co.uk | 6.84 | 8.88 | 2.04 | 29.85% | UK |
| investing.com | 7.15 | 9.28 | 2.13 | 29.77% | US |
| experian.com | 10.54 | 13.67 | 3.13 | 29.74% | US |
| posterlounge.co.uk | 5.84 | 7.57 | 1.73 | 29.71% | UK |
| tastesbetterfromscratch.com | 5.99 | 7.75 | 1.77 | 29.54% | UK |
| nidirect.gov.uk | 27.61 | 35.73 | 8.12 | 29.39% | UK |
| mdpi.com | 4.97 | 6.42 | 1.45 | 29.20% | UK |
| thefreedictionary.com | 20.34 | 26.27 | 5.93 | 29.15% | UK |
| spirithalloween.com | 8.51 | 10.93 | 2.42 | 28.49% | US |
| dorothyperkins.com | 6.27 | 8.05 | 1.78 | 28.41% | UK |
| worldpopulationreview.com | 6.95 | 8.92 | 1.97 | 28.37% | US |
| carphonewarehouse.com | 7.23 | 9.25 | 2.03 | 28.07% | UK |
| hollywoodreporter.com | 5.48 | 7.02 | 1.54 | 28.03% | US |
| cbc.ca | 4.96 | 6.35 | 1.39 | 27.97% | UK |
| denbypottery.com | 4.49 | 5.75 | 1.26 | 27.94% | UK |
| kayak.co.uk | 25.46 | 32.56 | 7.09 | 27.85% | UK |
| thefreedictionary.com | 8.32 | 10.64 | 2.31 | 27.79% | US |
| ga.gov | 5.30 | 6.77 | 1.47 | 27.75% | US |
| lionshome.co.uk | 6.76 | 8.63 | 1.87 | 27.65% | UK |
| simplypsychology.org | 10.79 | 13.73 | 2.94 | 27.28% | UK |
| santander.co.uk | 6.63 | 8.44 | 1.81 | 27.22% | UK |
| australian.museum | 5.21 | 6.62 | 1.41 | 27.08% | UK |
| clarks.com | 7.45 | 9.46 | 2.01 | 27.01% | UK |
| cef.co.uk | 5.69 | 7.22 | 1.53 | 26.96% | UK |
| nypost.com | 10.40 | 13.17 | 2.77 | 26.66% | US |
| onceuponachef.com | 6.43 | 8.12 | 1.70 | 26.38% | UK |
| disneyplus.com | 22.76 | 28.73 | 5.97 | 26.24% | US |
| worldmarket.com | 5.58 | 7.04 | 1.46 | 26.24% | US |
| cbc.ca | 6.32 | 7.96 | 1.64 | 25.97% | US |
| onceuponachef.com | 10.64 | 13.38 | 2.74 | 25.74% | US |
| thepioneerwoman.com | 18.22 | 22.89 | 4.67 | 25.65% | US |
| lv.com | 5.65 | 7.10 | 1.45 | 25.63% | UK |
| menkind.co.uk | 8.48 | 10.65 | 2.17 | 25.57% | UK |
| academy.com | 8.35 | 10.48 | 2.13 | 25.45% | US |
| greetingsisland.com | 7.38 | 9.24 | 1.87 | 25.29% | UK |
| kayoutlet.com | 5.81 | 7.28 | 1.47 | 25.28% | US |
| delish.com | 17.70 | 22.15 | 4.45 | 25.17% | US |
| visittheusa.com | 14.36 | 17.97 | 3.61 | 25.11% | US |
| uline.com | 7.19 | 8.96 | 1.77 | 24.60% | US |
| songsterr.com | 7.46 | 9.30 | 1.83 | 24.55% | UK |
| playhop.com | 9.42 | 11.72 | 2.30 | 24.36% | US |
| designingbuildings.co.uk | 8.91 | 11.06 | 2.15 | 24.11% | UK |
| newadvent.org | 7.94 | 9.85 | 1.91 | 24.03% | US |
| wordsmyth.net | 7.56 | 9.38 | 1.82 | 24.03% | UK |
| chase.com | 13.00 | 16.10 | 3.10 | 23.88% | US |
| nisbets.co.uk | 11.25 | 13.92 | 2.67 | 23.77% | UK |
| recipetineats.com | 26.24 | 32.47 | 6.23 | 23.73% | US |
| wikimedia.org | 8.01 | 9.90 | 1.89 | 23.61% | UK |
| publishing.service.gov.uk | 29.83 | 36.84 | 7.01 | 23.49% | UK |
| oecd.org | 5.42 | 6.69 | 1.27 | 23.47% | UK |
| seatgeek.com | 7.44 | 9.16 | 1.72 | 23.09% | US |
| worldatlas.com | 7.37 | 9.05 | 1.68 | 22.80% | UK |
| gcfglobal.org | 6.82 | 8.38 | 1.55 | 22.78% | US |
| vertumotors.com | 6.29 | 7.72 | 1.43 | 22.75% | UK |
| debenhams.com | 21.53 | 26.41 | 4.89 | 22.69% | UK |
| movoto.com | 7.43 | 9.11 | 1.69 | 22.68% | US |
| saga.co.uk | 5.94 | 7.28 | 1.34 | 22.54% | UK |
| verywellhealth.com | 20.12 | 24.64 | 4.52 | 22.46% | US |
| temu.com | 6.59 | 8.07 | 1.48 | 22.45% | UK |
| cheapflights.co.uk | 7.45 | 9.12 | 1.67 | 22.40% | UK |
| tandfonline.com | 6.45 | 7.89 | 1.44 | 22.37% | US |
| mydramalist.com | 5.54 | 6.76 | 1.22 | 22.10% | UK |
| parade.com | 18.65 | 22.73 | 4.08 | 21.87% | US |
| tutor2u.net | 16.52 | 20.11 | 3.59 | 21.74% | UK |
| abercrombie.com | 18.15 | 22.05 | 3.90 | 21.52% | US |
| cqc.org.uk | 8.96 | 10.89 | 1.93 | 21.52% | UK |
| legislation.gov.uk | 26.10 | 31.69 | 5.59 | 21.43% | UK |
| atlassian.com | 6.66 | 8.06 | 1.41 | 21.16% | US |
| waitrose.com | 10.92 | 13.21 | 2.29 | 21.00% | UK |
| wordpress.com | 25.37 | 30.68 | 5.31 | 20.91% | US |
| scot.nhs.uk | 11.93 | 14.43 | 2.49 | 20.89% | UK |
| aljazeera.com | 6.88 | 8.31 | 1.44 | 20.87% | US |
| aol.com | 8.62 | 10.40 | 1.79 | 20.73% | US |
| gettyimages.com | 19.38 | 23.39 | 4.02 | 20.72% | UK |
| drugbank.com | 5.89 | 7.10 | 1.22 | 20.63% | UK |
| worldatlas.com | 10.84 | 13.08 | 2.24 | 20.62% | US |
| mapquest.com | 5.87 | 7.07 | 1.20 | 20.53% | UK |
| gotquestions.org | 9.39 | 11.32 | 1.92 | 20.47% | US |
| hulu.com | 28.09 | 33.76 | 5.68 | 20.21% | US |
| live.com | 10.03 | 12.05 | 2.02 | 20.15% | US |
| live.com | 8.36 | 10.04 | 1.68 | 20.15% | UK |
| tiffany.co.uk | 12.45 | 14.92 | 2.48 | 19.91% | UK |
| crateandbarrel.com | 14.05 | 16.84 | 2.79 | 19.85% | US |
| thoughtco.com | 14.00 | 16.77 | 2.77 | 19.75% | US |
| medicare.gov | 15.83 | 18.95 | 3.12 | 19.73% | US |
| asos.com | 13.95 | 16.69 | 2.74 | 19.67% | US |
| twitch.tv | 11.33 | 13.56 | 2.22 | 19.60% | US |
| ftc.gov | 19.78 | 23.65 | 3.87 | 19.58% | US |
| manomano.co.uk | 11.27 | 13.46 | 2.19 | 19.47% | UK |
| topuniversities.com | 11.49 | 13.73 | 2.23 | 19.44% | US |
| matalan.co.uk | 23.28 | 27.80 | 4.52 | 19.43% | UK |
| moneyhelper.org.uk | 27.56 | 32.87 | 5.31 | 19.28% | UK |
| trivago.com | 14.49 | 17.26 | 2.77 | 19.13% | US |
| spirehealthcare.com | 10.07 | 11.97 | 1.91 | 18.94% | UK |
| paddypower.com | 9.44 | 11.23 | 1.79 | 18.93% | UK |
| umich.edu | 6.91 | 8.21 | 1.30 | 18.78% | UK |
| treasury.gov | 13.15 | 15.60 | 2.45 | 18.62% | US |
| cornell.edu | 19.49 | 23.10 | 3.61 | 18.53% | UK |
| elle.com | 10.77 | 12.75 | 1.98 | 18.39% | UK |
| fca.org.uk | 11.51 | 13.61 | 2.10 | 18.23% | UK |
| radiotimes.com | 11.46 | 13.54 | 2.08 | 18.19% | UK |
| get-information-schools.service.gov.uk | 9.64 | 11.39 | 1.75 | 18.13% | UK |
| tastesbetterfromscratch.com | 14.78 | 17.44 | 2.66 | 18.01% | US |
| songmeanings.com | 17.03 | 20.09 | 3.06 | 17.96% | UK |
| mo.gov | 14.11 | 16.63 | 2.52 | 17.85% | US |
| tsb.co.uk | 6.71 | 7.90 | 1.19 | 17.79% | UK |
| tumblr.com | 8.96 | 10.55 | 1.59 | 17.69% | US |
| ca.gov | 9.84 | 11.58 | 1.74 | 17.65% | UK |
| motorpoint.co.uk | 7.17 | 8.44 | 1.26 | 17.61% | UK |
| autotrader.com | 23.93 | 28.14 | 4.21 | 17.57% | US |
| cnbc.com | 9.98 | 11.72 | 1.74 | 17.45% | UK |
| company-information.service.gov.uk | 15.90 | 18.65 | 2.75 | 17.29% | US |
| oanda.com | 9.44 | 11.06 | 1.62 | 17.17% | UK |
| waze.com | 10.70 | 12.54 | 1.84 | 17.16% | US |
| harborfreight.com | 10.24 | 11.99 | 1.75 | 17.12% | US |
| virginexperiencedays.co.uk | 13.18 | 15.43 | 2.25 | 17.06% | UK |
| quillbot.com | 14.46 | 16.92 | 2.46 | 17.03% | UK |
| potterybarn.com | 14.12 | 16.51 | 2.40 | 16.96% | US |
| quillbot.com | 18.91 | 22.11 | 3.20 | 16.94% | US |
| wilko.com | 8.33 | 9.74 | 1.41 | 16.92% | UK |
| nextdoor.com | 10.25 | 11.96 | 1.71 | 16.73% | US |
| cloudflare.com | 8.75 | 10.22 | 1.46 | 16.72% | UK |
| thoughtco.com | 14.72 | 17.17 | 2.45 | 16.64% | UK |
| oxfordreference.com | 9.89 | 11.52 | 1.64 | 16.58% | UK |
| cloudflare.com | 10.20 | 11.90 | 1.69 | 16.57% | US |
| thomann.co.uk | 12.26 | 14.28 | 2.03 | 16.52% | UK |
| corporatefinanceinstitute.com | 15.86 | 18.47 | 2.61 | 16.43% | US |
| wordhippo.com | 23.51 | 27.37 | 3.86 | 16.42% | UK |
| virginatlantic.com | 13.23 | 15.40 | 2.17 | 16.39% | UK |
| evanshalshaw.com | 14.47 | 16.82 | 2.35 | 16.23% | UK |
| mubi.com | 7.58 | 8.81 | 1.22 | 16.13% | UK |
| verywellhealth.com | 26.96 | 31.28 | 4.32 | 16.02% | UK |
| shoezone.com | 12.36 | 14.32 | 1.96 | 15.84% | UK |
| investor.gov | 9.92 | 11.48 | 1.56 | 15.73% | US |
| yelp.com | 19.37 | 22.41 | 3.04 | 15.69% | UK |
| cms.gov | 12.05 | 13.93 | 1.88 | 15.64% | US |
| england.nhs.uk | 22.07 | 25.52 | 3.45 | 15.62% | UK |
| investing.com | 8.50 | 9.82 | 1.32 | 15.58% | UK |
| europa.eu | 25.45 | 29.40 | 3.95 | 15.53% | US |
| ashleyfurniture.com | 20.62 | 23.79 | 3.18 | 15.41% | US |
| xhamster.desi | 8.51 | 9.82 | 1.31 | 15.40% | UK |
| webuy.com | 25.01 | 28.86 | 3.85 | 15.38% | UK |
| lexisnexis.co.uk | 13.85 | 15.96 | 2.11 | 15.21% | UK |
| hotwire.com | 10.17 | 11.70 | 1.53 | 15.05% | US |
| carters.com | 9.31 | 10.70 | 1.40 | 15.01% | US |
| utah.edu | 10.58 | 12.17 | 1.59 | 15.00% | US |
| sealey.co.uk | 11.55 | 13.27 | 1.72 | 14.89% | UK |
| hsbc.co.uk | 20.51 | 23.55 | 3.04 | 14.83% | UK |
| medscape.com | 25.39 | 29.10 | 3.72 | 14.64% | US |
| va.gov | 24.46 | 28.03 | 3.57 | 14.59% | US |
| uswitch.com | 23.44 | 26.84 | 3.40 | 14.53% | UK |
| thespruce.com | 23.78 | 27.21 | 3.42 | 14.40% | US |
| nist.gov | 13.18 | 15.08 | 1.89 | 14.37% | US |
| scribd.com | 11.10 | 12.69 | 1.59 | 14.34% | US |
| deezer.com | 11.15 | 12.75 | 1.60 | 14.33% | UK |
| cinch.co.uk | 10.12 | 11.56 | 1.44 | 14.19% | UK |
| justia.com | 13.63 | 15.56 | 1.93 | 14.18% | US |
| onthemarket.com | 15.75 | 17.98 | 2.23 | 14.17% | UK |
| crutchfield.com | 19.85 | 22.66 | 2.81 | 14.16% | US |
| mountsinai.org | 20.84 | 23.73 | 2.90 | 13.91% | UK |
| thenorthface.co.uk | 12.69 | 14.40 | 1.71 | 13.48% | UK |
| wales.nhs.uk | 12.89 | 14.63 | 1.74 | 13.48% | UK |
| adidas.com | 17.92 | 20.32 | 2.40 | 13.37% | US |
| worldbank.org | 14.18 | 16.07 | 1.90 | 13.37% | US |
| hollandandbarrett.com | 25.26 | 28.62 | 3.36 | 13.30% | UK |
| un.org | 21.01 | 23.79 | 2.78 | 13.24% | US |
| gamestop.com | 25.76 | 29.17 | 3.41 | 13.22% | US |
| unesco.org | 13.61 | 15.38 | 1.77 | 12.99% | US |
| coursera.org | 17.10 | 19.31 | 2.21 | 12.92% | UK |
| sba.gov | 22.10 | 24.90 | 2.80 | 12.67% | US |
| travisperkins.co.uk | 10.70 | 12.04 | 1.34 | 12.52% | UK |
| wiley.com | 11.42 | 12.85 | 1.43 | 12.48% | US |
| ebsco.com | 29.60 | 33.26 | 3.67 | 12.38% | UK |
| wordreference.com | 26.29 | 29.53 | 3.25 | 12.36% | US |
| barnesandnoble.com | 28.66 | 32.19 | 3.53 | 12.32% | US |
| guitarcenter.com | 23.61 | 26.46 | 2.85 | 12.09% | US |
| edmunds.com | 26.19 | 29.30 | 3.11 | 11.86% | US |
| si.edu | 23.49 | 26.21 | 2.71 | 11.55% | UK |
| basketball-reference.com | 14.18 | 15.82 | 1.64 | 11.54% | US |
| aljazeera.com | 13.13 | 14.64 | 1.50 | 11.44% | UK |
| ionos.co.uk | 15.14 | 16.87 | 1.73 | 11.41% | UK |
| gotquestions.org | 11.14 | 12.41 | 1.27 | 11.40% | UK |
| espn.com | 13.34 | 14.83 | 1.49 | 11.20% | UK |
| translate.com | 17.67 | 19.63 | 1.96 | 11.11% | US |
| gooutdoors.co.uk | 28.31 | 31.45 | 3.14 | 11.08% | UK |
| mountainwarehouse.com | 18.83 | 20.91 | 2.08 | 11.03% | UK |
| overclockers.co.uk | 10.88 | 12.08 | 1.20 | 10.99% | UK |
| michaels.com | 13.01 | 14.43 | 1.42 | 10.92% | US |
| spanishdict.com | 25.45 | 28.22 | 2.77 | 10.89% | US |
| walgreens.com | 19.03 | 21.08 | 2.05 | 10.76% | US |
| glassdoor.com | 13.79 | 15.26 | 1.47 | 10.63% | US |
| colorado.gov | 16.39 | 18.13 | 1.74 | 10.61% | US |
| o2.co.uk | 15.36 | 16.97 | 1.62 | 10.54% | UK |
| mountsinai.org | 20.17 | 22.28 | 2.11 | 10.46% | US |
| ulta.com | 17.84 | 19.70 | 1.86 | 10.42% | US |
| illinois.gov | 18.40 | 20.31 | 1.91 | 10.37% | US |
| healthdirect.gov.au | 19.25 | 21.23 | 1.98 | 10.27% | US |
| steamcommunity.com | 25.73 | 28.36 | 2.63 | 10.23% | US |
| ons.gov.uk | 16.22 | 17.88 | 1.66 | 10.21% | UK |
| heart.org | 13.12 | 14.46 | 1.34 | 10.20% | UK |
| techradar.com | 23.61 | 26.00 | 2.39 | 10.13% | US |
| loveholidays.com | 17.35 | 19.10 | 1.75 | 10.09% | UK |
| ed.ac.uk | 17.60 | 19.37 | 1.77 | 10.06% | UK |
| georgia.gov | 17.56 | 19.31 | 1.75 | 9.99% | US |
| hotels.com | 21.82 | 23.99 | 2.18 | 9.97% | UK |
| usgs.gov | 22.68 | 24.93 | 2.25 | 9.91% | US |
| osha.gov | 16.11 | 17.69 | 1.58 | 9.80% | US |
| congress.gov | 29.73 | 32.61 | 2.88 | 9.68% | US |
| britishairways.com | 25.29 | 27.73 | 2.44 | 9.66% | UK |
| skyscanner.com | 26.16 | 28.65 | 2.49 | 9.50% | US |
| michigan.gov | 17.13 | 18.75 | 1.62 | 9.48% | US |
| fandango.com | 17.07 | 18.67 | 1.60 | 9.38% | US |
| house.gov | 21.72 | 23.74 | 2.02 | 9.29% | US |
| eurocarparts.com | 14.19 | 15.50 | 1.32 | 9.28% | UK |
| go.com | 14.97 | 16.34 | 1.38 | 9.21% | UK |
| verywellmind.com | 20.47 | 22.35 | 1.88 | 9.20% | US |
| hilton.com | 14.97 | 16.33 | 1.36 | 9.09% | UK |
| heart.org | 23.09 | 25.11 | 2.02 | 8.74% | US |
| studentaid.gov | 24.37 | 26.45 | 2.08 | 8.53% | US |
| chevrolet.com | 16.84 | 18.27 | 1.43 | 8.49% | US |
| mattel.com | 18.60 | 20.17 | 1.57 | 8.44% | US |
| archives.gov | 25.23 | 27.36 | 2.13 | 8.43% | US |
| ufl.edu | 17.94 | 19.42 | 1.48 | 8.24% | US |
| parade.com | 22.67 | 24.53 | 1.86 | 8.21% | UK |
| macmillan.org.uk | 15.76 | 17.05 | 1.29 | 8.17% | UK |
| uscourts.gov | 22.29 | 24.11 | 1.82 | 8.16% | US |
| cbsnews.com | 26.73 | 28.91 | 2.18 | 8.15% | US |
| ricksteves.com | 17.80 | 19.24 | 1.45 | 8.13% | US |
| corporatefinanceinstitute.com | 19.30 | 20.85 | 1.55 | 8.04% | UK |
| umich.edu | 19.84 | 21.43 | 1.59 | 8.01% | US |
| farnell.com | 22.39 | 24.15 | 1.76 | 7.87% | UK |
| savemyexams.com | 20.98 | 22.61 | 1.62 | 7.74% | UK |
| wiley.com | 18.44 | 19.86 | 1.43 | 7.73% | UK |
| thespruce.com | 19.75 | 21.26 | 1.51 | 7.64% | UK |
| nationaltrust.org.uk | 19.14 | 20.60 | 1.46 | 7.60% | UK |
| jet2holidays.com | 24.19 | 26.01 | 1.82 | 7.52% | UK |
| justice.gov | 20.24 | 21.75 | 1.51 | 7.47% | US |
| un.org | 19.38 | 20.81 | 1.43 | 7.37% | UK |
| itv.com | 25.44 | 27.31 | 1.87 | 7.34% | UK |
| oup.com | 20.42 | 21.78 | 1.36 | 6.65% | UK |
| ultimate-guitar.com | 27.49 | 29.21 | 1.73 | 6.28% | UK |
| superuser.com | 26.37 | 28.00 | 1.63 | 6.18% | US |
| people.com | 24.97 | 26.24 | 1.27 | 5.09% | UK |
| bmstores.co.uk | 26.19 | 27.43 | 1.25 | 4.76% | UK |
| carwow.co.uk | 26.80 | 28.05 | 1.26 | 4.70% | UK |
| max.com | 3.82 | 0.52 | -3.31 | -86.45% | UK |
| globenewswire.com | 5.04 | 0.71 | -4.33 | -85.87% | US |
| coupons.com | 3.56 | 0.52 | -3.04 | -85.35% | US |
| max.com | 20.85 | 3.08 | -17.77 | -85.22% | US |
| gostudyin.com | 2.71 | 0.43 | -2.28 | -84.26% | UK |
| clarksoutlet.co.uk | 5.06 | 0.81 | -4.25 | -83.95% | UK |
| unep.org | 1.78 | 0.29 | -1.49 | -83.92% | UK |
| flightstats.com | 3.37 | 0.72 | -2.65 | -78.66% | UK |
| whsmith.co.uk | 7.62 | 1.73 | -5.90 | -77.35% | UK |
| bradford.co.uk | 2.61 | 0.60 | -2.00 | -76.86% | UK |
| cagematch.net | 3.26 | 0.87 | -2.39 | -73.36% | UK |
| flightstats.com | 5.87 | 1.64 | -4.23 | -72.09% | US |
| mastercard.us | 3.35 | 0.99 | -2.36 | -70.39% | US |
| heartandcoeur.com | 1.99 | 0.59 | -1.40 | -70.19% | US |
| utswmed.org | 2.48 | 0.78 | -1.69 | -68.42% | UK |
| flyertalk.com | 2.10 | 0.68 | -1.41 | -67.38% | US |
| windsorpeak.com | 2.51 | 0.82 | -1.69 | -67.24% | US |
| hbo.com | 3.01 | 1.02 | -1.99 | -66.18% | UK |
| halfbakedharvest.com | 4.21 | 1.43 | -2.78 | -65.99% | US |
| rivals.com | 3.19 | 1.10 | -2.10 | -65.69% | US |
| morningstar.co.uk | 4.37 | 1.52 | -2.85 | -65.26% | UK |
| thestreet.com | 5.52 | 1.93 | -3.60 | -65.12% | US |
| fashiola.co.uk | 2.59 | 0.92 | -1.66 | -64.31% | UK |
| momjunction.com | 2.21 | 0.81 | -1.40 | -63.41% | UK |
| patient.info | 7.18 | 2.64 | -4.54 | -63.25% | US |
| stake.com | 2.60 | 0.96 | -1.64 | -63.12% | US |
| militaryonesource.mil | 7.25 | 2.69 | -4.57 | -62.97% | US |
| stylight.co.uk | 4.58 | 1.72 | -2.86 | -62.39% | UK |
| businesswire.com | 2.78 | 1.05 | -1.73 | -62.19% | US |
| gbnews.com | 6.24 | 2.37 | -3.88 | -62.08% | UK |
| flashmuseum.org | 2.79 | 1.06 | -1.73 | -62.04% | UK |
| therighthairstyles.com | 3.14 | 1.27 | -1.87 | -59.46% | US |
| educations.com | 2.72 | 1.13 | -1.59 | -58.54% | US |
| beginningboutique.com | 2.43 | 1.02 | -1.41 | -58.12% | US |
| bigcommerce.com | 2.93 | 1.27 | -1.66 | -56.78% | US |
| talksport.com | 3.69 | 1.62 | -2.07 | -56.14% | UK |
| wikiquote.org | 2.89 | 1.28 | -1.61 | -55.74% | US |
| lyrics.com | 5.30 | 2.39 | -2.92 | -54.99% | US |
| clerk.chat | 2.95 | 1.33 | -1.62 | -54.98% | US |
| shadesoflight.com | 3.13 | 1.42 | -1.71 | -54.63% | US |
| girlgames.com | 2.70 | 1.23 | -1.46 | -54.21% | US |
| gap.com | 24.66 | 11.35 | -13.31 | -53.98% | US |
| lendingtree.com | 13.23 | 6.24 | -6.99 | -52.86% | US |
| mtishows.com | 3.10 | 1.46 | -1.63 | -52.76% | US |
| patient.info | 43.40 | 20.57 | -22.83 | -52.60% | UK |
| ducksters.com | 4.96 | 2.36 | -2.61 | -52.50% | US |
| hbo.com | 5.76 | 2.76 | -3.01 | -52.18% | US |
| thehulltruth.com | 2.34 | 1.13 | -1.21 | -51.79% | US |
| capterra.com | 5.00 | 2.42 | -2.58 | -51.64% | US |
| betterup.com | 7.50 | 3.63 | -3.87 | -51.58% | US |
| videvo.net | 3.40 | 1.65 | -1.75 | -51.53% | US |
| cookinginthemidwest.com | 2.73 | 1.33 | -1.40 | -51.26% | US |
| arcadespot.com | 2.35 | 1.15 | -1.20 | -50.96% | UK |
| uel.ac.uk | 4.13 | 2.04 | -2.08 | -50.52% | UK |
| manua.ls | 2.19 | 1.09 | -1.10 | -50.27% | US |
| arcadespot.com | 3.19 | 1.59 | -1.60 | -50.17% | US |
| phase-eight.com | 5.70 | 2.84 | -2.86 | -50.16% | UK |
| utswmed.org | 3.53 | 1.76 | -1.77 | -50.11% | US |
| narkive.com | 6.72 | 3.37 | -3.35 | -49.90% | US |
| nyandcompany.com | 2.36 | 1.18 | -1.18 | -49.85% | US |
| whosampled.com | 5.56 | 2.80 | -2.76 | -49.66% | US |
| whosampled.com | 17.66 | 8.92 | -8.74 | -49.50% | UK |
| lyrics.com | 2.95 | 1.49 | -1.46 | -49.49% | UK |
| therighthairstyles.com | 6.67 | 3.37 | -3.30 | -49.42% | UK |
| brightchamps.com | 4.69 | 2.38 | -2.32 | -49.33% | US |
| pluto.tv | 4.67 | 2.39 | -2.28 | -48.84% | US |
| fragrancex.com | 2.41 | 1.24 | -1.17 | -48.55% | US |
| wikitravel.org | 7.13 | 3.68 | -3.45 | -48.36% | US |
| borrowmydoggy.com | 4.08 | 2.11 | -1.97 | -48.35% | UK |
| wildoakboutique.com | 2.01 | 1.04 | -0.97 | -48.26% | US |
| ducksters.com | 5.40 | 2.81 | -2.59 | -47.98% | UK |
| mrcentralheating.co.uk | 2.32 | 1.21 | -1.11 | -47.89% | UK |
| threadheads.com | 2.07 | 1.09 | -0.98 | -47.42% | US |
| pourmoi.co.uk | 8.58 | 4.55 | -4.03 | -47.01% | UK |
| wikiquote.org | 11.49 | 6.10 | -5.40 | -46.94% | UK |
| ldoceonline.com | 12.22 | 6.64 | -5.58 | -45.65% | US |
| nrdc.org | 4.63 | 2.52 | -2.11 | -45.65% | US |
| damndelicious.net | 3.02 | 1.64 | -1.38 | -45.64% | US |
| southparkstudios.com | 1.87 | 1.02 | -0.85 | -45.58% | US |
| zoho.com | 5.51 | 3.00 | -2.51 | -45.55% | UK |
| business.com | 2.92 | 1.59 | -1.33 | -45.53% | US |
| bbfc.co.uk | 4.39 | 2.40 | -2.00 | -45.46% | UK |
| quotezone.co.uk | 2.12 | 1.16 | -0.96 | -45.12% | UK |
| trueclassictees.com | 2.25 | 1.24 | -1.01 | -45.09% | US |
| rationalwiki.org | 2.52 | 1.39 | -1.13 | -44.96% | UK |
| bmgardenbuildings.co.uk | 4.89 | 2.70 | -2.20 | -44.90% | UK |
| zoho.com | 5.16 | 2.85 | -2.31 | -44.79% | US |
| easyhindityping.com | 1.94 | 1.08 | -0.87 | -44.55% | UK |
| vouchercloud.com | 1.89 | 1.05 | -0.84 | -44.45% | UK |
| mensjournal.com | 2.69 | 1.50 | -1.20 | -44.44% | US |
| onlinegames.io | 2.49 | 1.39 | -1.10 | -44.09% | US |
| simplemaps.com | 4.04 | 2.27 | -1.77 | -43.75% | US |
| betterup.com | 10.34 | 5.82 | -4.53 | -43.75% | UK |
| wikitravel.org | 11.95 | 6.80 | -5.15 | -43.11% | UK |
| theregister.com | 1.95 | 1.11 | -0.84 | -42.86% | UK |
| ahd.com | 2.11 | 1.21 | -0.90 | -42.69% | US |
| nrdc.org | 2.90 | 1.67 | -1.23 | -42.55% | UK |
| salter.com | 2.36 | 1.35 | -1.00 | -42.53% | UK |
| ladyblacktie.com | 2.21 | 1.27 | -0.93 | -42.34% | US |
| englishclub.com | 3.76 | 2.18 | -1.59 | -42.20% | US |
| dignityfunerals.co.uk | 2.47 | 1.43 | -1.04 | -42.20% | UK |
| gamehacking.org | 1.96 | 1.14 | -0.82 | -41.97% | US |
| hubpages.com | 4.31 | 2.51 | -1.80 | -41.76% | US |
| hobbytown.com | 1.97 | 1.15 | -0.82 | -41.74% | US |
| ew.com | 6.56 | 3.83 | -2.74 | -41.70% | US |
| rxlist.com | 5.93 | 3.46 | -2.47 | -41.70% | US |
| engadget.com | 3.12 | 1.82 | -1.30 | -41.67% | US |
| learn.org | 2.02 | 1.18 | -0.84 | -41.67% | US |
| hellomolly.com | 2.05 | 1.20 | -0.85 | -41.65% | US |
| ashworthcollege.edu | 1.87 | 1.09 | -0.78 | -41.61% | US |
| city-data.com | 3.00 | 1.75 | -1.25 | -41.60% | US |
| transfermarkt.com | 2.23 | 1.30 | -0.93 | -41.54% | US |
| invaluable.com | 3.26 | 1.91 | -1.35 | -41.43% | US |
| purplebricks.co.uk | 3.77 | 2.21 | -1.56 | -41.32% | UK |
| multitracks.com | 1.95 | 1.14 | -0.81 | -41.30% | US |
| babbel.com | 2.34 | 1.38 | -0.97 | -41.25% | US |
| levenger.com | 2.00 | 1.18 | -0.82 | -41.07% | US |
| scientificamerican.com | 4.79 | 2.82 | -1.97 | -41.05% | US |
| avant.com | 2.14 | 1.26 | -0.88 | -40.96% | US |
| machinerytrader.com | 1.79 | 1.06 | -0.73 | -40.92% | US |
| stacyadams.com | 1.95 | 1.16 | -0.80 | -40.81% | US |
| sofology.co.uk | 9.24 | 5.47 | -3.76 | -40.75% | UK |
| juno.co.uk | 3.38 | 2.00 | -1.37 | -40.66% | UK |
| houseofnames.com | 3.56 | 2.11 | -1.45 | -40.65% | UK |
| linkedphone.com | 2.23 | 1.32 | -0.91 | -40.64% | US |
| nibusinessinfo.co.uk | 3.43 | 2.04 | -1.39 | -40.57% | UK |
| muckrack.com | 4.43 | 2.63 | -1.80 | -40.56% | US |
| goodschoolsguide.co.uk | 2.91 | 1.73 | -1.18 | -40.54% | UK |
| bristolpost.co.uk | 1.74 | 1.03 | -0.70 | -40.47% | UK |
| wordstream.com | 5.21 | 3.11 | -2.10 | -40.37% | US |
| scientificamerican.com | 4.85 | 2.92 | -1.92 | -39.69% | UK |
| winworldpc.com | 3.86 | 2.33 | -1.53 | -39.64% | US |
| amnesty.org | 5.96 | 3.60 | -2.36 | -39.61% | US |
| winworldpc.com | 2.14 | 1.29 | -0.85 | -39.55% | UK |
| opensecrets.org | 2.27 | 1.37 | -0.90 | -39.44% | US |
| toytheater.com | 3.45 | 2.09 | -1.35 | -39.22% | US |
| mastersportal.com | 2.54 | 1.55 | -1.00 | -39.18% | US |
| golfpass.com | 1.75 | 1.07 | -0.68 | -38.96% | US |
| bigcommerce.co.uk | 2.50 | 1.53 | -0.97 | -38.95% | UK |
| skiddle.com | 7.95 | 4.86 | -3.09 | -38.86% | UK |
| mastersportal.com | 2.10 | 1.28 | -0.82 | -38.85% | UK |
| pluggedin.com | 2.94 | 1.80 | -1.14 | -38.80% | US |
| worldtimebuddy.com | 6.20 | 3.80 | -2.40 | -38.73% | UK |
| dvdfab.cn | 2.85 | 1.75 | -1.10 | -38.57% | US |
| autocar.co.uk | 9.05 | 5.57 | -3.48 | -38.43% | UK |
| kerrang.com | 2.35 | 1.45 | -0.90 | -38.34% | UK |
| benendenhospital.org.uk | 1.71 | 1.05 | -0.66 | -38.33% | UK |
| lawdepot.com | 6.57 | 4.06 | -2.52 | -38.30% | US |
| spiceworks.com | 14.23 | 8.79 | -5.44 | -38.23% | UK |
| head-fi.org | 2.11 | 1.31 | -0.81 | -38.22% | US |
| perfect-english-grammar.com | 2.25 | 1.39 | -0.86 | -38.19% | UK |
| inthestyle.com | 2.63 | 1.63 | -1.00 | -38.17% | UK |
| ballotpedia.org | 1.89 | 1.17 | -0.72 | -38.16% | UK |
| spankbang.com | 6.69 | 4.14 | -2.55 | -38.15% | UK |
| dermnetnz.org | 8.12 | 5.03 | -3.09 | -38.08% | US |
| transfermarkt.com | 8.10 | 5.02 | -3.08 | -38.06% | UK |
| machinerypete.com | 1.68 | 1.04 | -0.64 | -37.98% | US |
| genecards.org | 1.95 | 1.21 | -0.74 | -37.91% | US |
| spellzone.com | 9.61 | 5.97 | -3.64 | -37.91% | UK |
| primarygames.com | 1.89 | 1.17 | -0.72 | -37.89% | US |
| samplefocus.com | 2.12 | 1.32 | -0.80 | -37.89% | UK |
| taylorandhart.com | 1.71 | 1.07 | -0.64 | -37.57% | UK |
| gamepix.com | 3.15 | 1.97 | -1.18 | -37.52% | US |
| pond5.com | 1.75 | 1.09 | -0.66 | -37.49% | UK |
| mejuri.com | 3.28 | 2.05 | -1.23 | -37.47% | US |
| chichiclothing.com | 1.62 | 1.01 | -0.61 | -37.43% | UK |
| englishclub.com | 3.65 | 2.28 | -1.36 | -37.42% | UK |
| cartridgeworld.co.uk | 2.76 | 1.73 | -1.03 | -37.33% | UK |
| prettylittlething.us | 5.17 | 3.24 | -1.93 | -37.32% | US |
| befunky.com | 2.58 | 1.62 | -0.96 | -37.31% | UK |
| whatfix.com | 1.73 | 1.09 | -0.64 | -37.19% | UK |
| deliaonline.com | 3.56 | 2.24 | -1.32 | -37.03% | UK |
| roman.co.uk | 9.11 | 5.74 | -3.37 | -37.03% | UK |
| whatfix.com | 2.53 | 1.59 | -0.94 | -37.00% | US |
| movavi.com | 10.77 | 6.81 | -3.97 | -36.83% | US |
| dimensions.com | 1.90 | 1.20 | -0.70 | -36.83% | UK |
| catholic.org | 6.37 | 4.02 | -2.34 | -36.81% | US |
| companycheck.co.uk | 1.69 | 1.07 | -0.62 | -36.80% | UK |
| designrush.com | 1.99 | 1.26 | -0.73 | -36.57% | US |
| ballotpedia.org | 6.75 | 4.29 | -2.46 | -36.46% | US |
| zdnet.com | 2.86 | 1.82 | -1.04 | -36.44% | UK |
| royalsocietypublishing.org | 1.85 | 1.18 | -0.68 | -36.41% | UK |
| zdnet.com | 4.23 | 2.69 | -1.54 | -36.39% | US |
| woot.com | 2.89 | 1.84 | -1.05 | -36.37% | US |
| viz.com | 2.52 | 1.61 | -0.92 | -36.35% | US |
| astrology.com | 2.82 | 1.80 | -1.03 | -36.31% | US |
| emulatorgames.net | 5.65 | 3.60 | -2.05 | -36.31% | UK |
| feastingathome.com | 1.95 | 1.24 | -0.70 | -36.18% | US |
| progarchives.com | 3.17 | 2.02 | -1.14 | -36.11% | UK |
| calm.com | 2.93 | 1.88 | -1.06 | -36.04% | US |
| okc.gov | 1.67 | 1.07 | -0.60 | -35.97% | US |
| proboards.com | 3.53 | 2.27 | -1.27 | -35.85% | US |
| pewresearch.org | 5.80 | 3.73 | -2.07 | -35.73% | UK |
| movavi.com | 3.67 | 2.36 | -1.31 | -35.70% | UK |
| diabetes.co.uk | 2.56 | 1.65 | -0.91 | -35.65% | UK |
| dollar.com | 2.87 | 1.85 | -1.02 | -35.62% | US |
| adanola.com | 1.63 | 1.05 | -0.58 | -35.62% | UK |
| petapixel.com | 1.71 | 1.10 | -0.61 | -35.61% | US |
| amateurphotographer.com | 1.96 | 1.27 | -0.69 | -35.36% | US |
| macduggal.com | 1.60 | 1.03 | -0.56 | -35.32% | US |
| theworlds50best.com | 2.16 | 1.40 | -0.76 | -35.22% | UK |
| backlinko.com | 2.45 | 1.58 | -0.86 | -35.21% | UK |
| smartdraw.com | 3.05 | 1.98 | -1.07 | -35.18% | US |
| rxlist.com | 1.80 | 1.17 | -0.63 | -35.13% | UK |
| dezeen.com | 3.61 | 2.35 | -1.27 | -35.03% | UK |
| oneclearwinner.co.uk | 3.59 | 2.33 | -1.26 | -35.03% | UK |
| darebee.com | 2.22 | 1.45 | -0.78 | -34.91% | US |
| adventhealth.com | 2.97 | 1.94 | -1.04 | -34.84% | US |
| ew.com | 5.70 | 3.72 | -1.99 | -34.84% | UK |
| wordstream.com | 7.46 | 4.87 | -2.59 | -34.72% | UK |
| internetradiouk.com | 4.00 | 2.61 | -1.39 | -34.70% | UK |
| loudwire.com | 1.87 | 1.22 | -0.65 | -34.69% | US |
| boomplay.com | 9.65 | 6.30 | -3.34 | -34.66% | UK |
| thefinejewellerycompany.com | 1.76 | 1.15 | -0.61 | -34.66% | UK |
| empireonline.com | 10.67 | 7.00 | -3.67 | -34.43% | UK |
| weichert.com | 1.82 | 1.19 | -0.62 | -34.32% | US |
| postermywall.com | 3.08 | 2.02 | -1.06 | -34.31% | UK |
| petalandpup.com | 5.16 | 3.41 | -1.76 | -34.02% | US |
| fitchratings.com | 2.09 | 1.38 | -0.71 | -34.00% | US |
| lussostone.com | 1.83 | 1.21 | -0.62 | -33.93% | UK |
| invaluable.com | 2.56 | 1.70 | -0.87 | -33.89% | UK |
| globfone.com | 3.54 | 2.35 | -1.20 | -33.83% | US |
| business.com | 1.65 | 1.09 | -0.56 | -33.74% | UK |
| hiphopdx.com | 1.62 | 1.08 | -0.55 | -33.68% | UK |
| moviefone.com | 1.71 | 1.13 | -0.58 | -33.68% | UK |
| toryburch.com | 2.18 | 1.45 | -0.73 | -33.62% | US |
| logo.com | 1.91 | 1.27 | -0.64 | -33.61% | UK |
| bibleref.com | 8.35 | 5.55 | -2.80 | -33.56% | US |
| lancasterpuppies.com | 10.50 | 6.98 | -3.52 | -33.55% | US |
| fitchratings.com | 1.97 | 1.31 | -0.66 | -33.52% | UK |
| amnesty.org | 6.48 | 4.32 | -2.17 | -33.42% | UK |
| builtin.com | 3.50 | 2.33 | -1.17 | -33.39% | UK |
| vista.com | 3.05 | 2.04 | -1.02 | -33.32% | US |
| toptal.com | 1.54 | 1.03 | -0.51 | -33.31% | UK |
| lookers.co.uk | 13.58 | 9.07 | -4.51 | -33.22% | UK |
| loudwire.com | 2.01 | 1.35 | -0.67 | -33.08% | UK |
| ldoceonline.com | 36.42 | 24.37 | -12.04 | -33.07% | UK |
| feastingathome.com | 2.88 | 1.93 | -0.95 | -32.99% | UK |
| bodycandy.com | 1.90 | 1.28 | -0.63 | -32.91% | US |
| pewresearch.org | 15.34 | 10.30 | -5.04 | -32.86% | US |
| mathgames.com | 1.66 | 1.12 | -0.55 | -32.85% | US |
| co-operativebank.co.uk | 5.89 | 3.96 | -1.93 | -32.81% | UK |
| flexjobs.com | 4.42 | 2.97 | -1.45 | -32.80% | US |
| beatport.com | 1.78 | 1.20 | -0.58 | -32.68% | US |
| holidaypirates.com | 3.17 | 2.14 | -1.04 | -32.67% | UK |
| befunky.com | 1.92 | 1.30 | -0.63 | -32.66% | US |
| traxsource.com | 1.50 | 1.01 | -0.49 | -32.60% | UK |
| cargurus.co.uk | 5.80 | 3.92 | -1.89 | -32.51% | UK |
| justwatch.com | 17.19 | 11.61 | -5.58 | -32.47% | US |
| chemistdirect.co.uk | 2.29 | 1.55 | -0.74 | -32.46% | UK |
| mdcalc.com | 2.47 | 1.67 | -0.80 | -32.43% | US |
| xdaforums.com | 2.34 | 1.58 | -0.76 | -32.43% | US |
| eporner.com | 4.18 | 2.83 | -1.36 | -32.42% | UK |
| food.com | 13.88 | 9.39 | -4.49 | -32.36% | US |
| bookoutlet.com | 2.80 | 1.89 | -0.90 | -32.28% | US |
| houstonmethodist.org | 3.07 | 2.08 | -0.99 | -32.26% | US |
| wella.com | 2.23 | 1.51 | -0.72 | -32.24% | UK |
| france24.com | 2.68 | 1.82 | -0.86 | -32.17% | UK |
| boomplay.com | 8.21 | 5.57 | -2.64 | -32.13% | US |
| notaboringbox.co.uk | 2.15 | 1.46 | -0.69 | -32.08% | UK |
| ipqualityscore.com | 5.57 | 3.79 | -1.78 | -32.03% | US |
| grahamandgreen.co.uk | 4.29 | 2.92 | -1.37 | -31.96% | UK |
| ip2location.com | 1.54 | 1.05 | -0.49 | -31.95% | US |
| colemanfurniture.com | 1.48 | 1.01 | -0.47 | -31.87% | US |
| pipedrive.com | 2.06 | 1.40 | -0.66 | -31.81% | UK |
| primarygames.com | 2.24 | 1.53 | -0.71 | -31.74% | UK |
| fastloanuk.co.uk | 1.94 | 1.32 | -0.61 | -31.68% | UK |
| indespension.co.uk | 2.93 | 2.00 | -0.93 | -31.68% | UK |
| beatport.com | 9.12 | 6.23 | -2.88 | -31.61% | UK |
| sputnikmusic.com | 1.89 | 1.29 | -0.60 | -31.61% | UK |
| ok.co.uk | 3.18 | 2.18 | -1.00 | -31.56% | UK |
| watches.com | 1.98 | 1.35 | -0.62 | -31.55% | US |
| moviefone.com | 3.08 | 2.11 | -0.97 | -31.52% | US |
| dailymail.co.uk | 53.08 | 36.37 | -16.71 | -31.48% | UK |
| notonthehighstreet.com | 32.41 | 22.21 | -10.20 | -31.47% | UK |
| uw.edu | 2.10 | 1.44 | -0.66 | -31.46% | UK |
| multitracks.com | 1.46 | 1.00 | -0.46 | -31.37% | UK |
| jwpepper.com | 3.23 | 2.22 | -1.01 | -31.36% | US |
| cheapestfancydress.co.uk | 5.58 | 3.83 | -1.75 | -31.35% | UK |
| hellomagazine.com | 3.34 | 2.30 | -1.04 | -31.22% | US |
| whathifi.com | 6.41 | 4.41 | -2.00 | -31.15% | US |
| carbuzz.com | 3.14 | 2.16 | -0.98 | -31.14% | US |
| gamaverse.com | 1.91 | 1.32 | -0.59 | -31.10% | US |
| truity.com | 2.43 | 1.67 | -0.75 | -31.09% | US |
| bsky.app | 1.50 | 1.03 | -0.47 | -31.08% | UK |
| horze.co.uk | 2.99 | 2.06 | -0.93 | -31.04% | UK |
| spankbang.com | 1.55 | 1.07 | -0.48 | -31.01% | US |
| thisismoney.co.uk | 3.07 | 2.12 | -0.95 | -30.86% | UK |
| postermywall.com | 4.92 | 3.41 | -1.52 | -30.83% | US |
| hbr.org | 15.12 | 10.47 | -4.64 | -30.72% | US |
| meijer.com | 2.05 | 1.42 | -0.63 | -30.68% | US |
| laithwaites.co.uk | 3.27 | 2.27 | -1.00 | -30.64% | UK |
| builtin.com | 6.49 | 4.50 | -1.99 | -30.63% | US |
| bonmarche.co.uk | 5.34 | 3.71 | -1.63 | -30.58% | UK |
| theeverygirl.com | 1.92 | 1.34 | -0.59 | -30.54% | UK |
| theconstructionindex.co.uk | 1.49 | 1.04 | -0.46 | -30.52% | UK |
| wellsfargo.com | 30.31 | 21.08 | -9.24 | -30.47% | US |
| religionmediacentre.org.uk | 1.64 | 1.14 | -0.50 | -30.46% | UK |
| tuasaude.com | 3.39 | 2.36 | -1.03 | -30.45% | UK |
| trendybeatz.com | 1.70 | 1.18 | -0.52 | -30.38% | US |
| engadget.com | 1.97 | 1.37 | -0.60 | -30.37% | UK |
| hardmantrust.org.uk | 1.61 | 1.12 | -0.49 | -30.35% | UK |
| gamesgames.com | 3.03 | 2.11 | -0.92 | -30.34% | US |
| babbel.com | 2.93 | 2.05 | -0.89 | -30.23% | UK |
| emulatorgames.net | 10.54 | 7.36 | -3.18 | -30.15% | US |
| easyhindityping.com | 4.13 | 2.88 | -1.25 | -30.15% | US |
| foliosociety.com | 2.04 | 1.42 | -0.61 | -30.13% | UK |
| yousician.com | 2.19 | 1.53 | -0.66 | -30.12% | US |
| prodigygame.com | 2.42 | 1.69 | -0.73 | -30.11% | UK |
| debeers.co.uk | 2.44 | 1.70 | -0.73 | -30.10% | UK |
| autoexpress.co.uk | 11.74 | 8.21 | -3.53 | -30.08% | UK |
| mo.gov | 2.92 | 2.04 | -0.88 | -30.05% | UK |
| mathsisfun.com | 20.13 | 14.10 | -6.04 | -29.98% | US |
| rebtel.com | 1.48 | 1.04 | -0.44 | -29.98% | US |
| bakingmad.com | 2.26 | 1.58 | -0.68 | -29.98% | UK |
| serenaandlily.com | 1.86 | 1.30 | -0.56 | -29.94% | US |
| monicavinader.com | 5.94 | 4.16 | -1.78 | -29.94% | UK |
| lottery.ie | 1.61 | 1.13 | -0.48 | -29.88% | UK |
| trendybeatz.com | 1.47 | 1.03 | -0.44 | -29.86% | UK |
| ottolenghi.co.uk | 1.95 | 1.37 | -0.58 | -29.82% | UK |
| busuu.com | 1.87 | 1.31 | -0.56 | -29.79% | US |
| catholic.org | 3.49 | 2.45 | -1.04 | -29.77% | UK |
| astrology.com | 2.74 | 1.92 | -0.81 | -29.75% | UK |
| tescophoto.com | 5.03 | 3.54 | -1.49 | -29.67% | UK |
| live365.com | 1.92 | 1.35 | -0.57 | -29.65% | US |
| njmls.com | 1.75 | 1.23 | -0.52 | -29.58% | US |
| heraldscotland.com | 2.24 | 1.58 | -0.66 | -29.55% | UK |
| food.com | 6.72 | 4.74 | -1.98 | -29.47% | UK |
| whatcar.com | 25.30 | 17.85 | -7.45 | -29.44% | UK |
| rugs.com | 2.39 | 1.69 | -0.70 | -29.43% | US |
| thesinkboutique.com | 2.12 | 1.50 | -0.62 | -29.35% | US |
| justwatch.com | 20.97 | 14.82 | -6.15 | -29.33% | UK |
| nursingtimes.net | 1.58 | 1.11 | -0.46 | -29.33% | UK |
| entrepreneur.com | 3.29 | 2.33 | -0.97 | -29.30% | UK |
| holidayhypermarket.co.uk | 4.33 | 3.07 | -1.27 | -29.26% | UK |
| starnow.com | 1.57 | 1.11 | -0.46 | -29.25% | UK |
| nationwide.com | 9.93 | 7.03 | -2.90 | -29.19% | US |
| axparis.com | 4.16 | 2.95 | -1.21 | -29.14% | UK |
| topdoctors.co.uk | 11.51 | 8.15 | -3.35 | -29.13% | UK |
| bollandbranch.com | 2.82 | 2.00 | -0.82 | -29.12% | US |
| pof.com | 3.62 | 2.56 | -1.05 | -29.10% | US |
| smartdraw.com | 4.37 | 3.10 | -1.27 | -29.07% | UK |
| kvm-switches-online.com | 1.58 | 1.12 | -0.46 | -29.04% | US |
| unacademy.com | 4.34 | 3.08 | -1.26 | -28.99% | UK |
| famousbirthdays.com | 6.34 | 4.51 | -1.84 | -28.96% | UK |
| motors.co.uk | 31.05 | 22.07 | -8.98 | -28.92% | UK |
| entrepreneur.com | 5.64 | 4.01 | -1.63 | -28.88% | US |
| gartner.com | 5.46 | 3.88 | -1.58 | -28.88% | US |
| feverup.com | 2.10 | 1.49 | -0.61 | -28.86% | US |
| recyclingbins.co.uk | 1.62 | 1.15 | -0.47 | -28.82% | UK |
| nintendo.co.uk | 3.08 | 2.19 | -0.89 | -28.81% | UK |
| wikivoyage.org | 19.18 | 13.65 | -5.53 | -28.81% | UK |
| aspendental.com | 1.76 | 1.25 | -0.51 | -28.77% | US |
| hellopoetry.com | 1.71 | 1.22 | -0.49 | -28.76% | UK |
| prograd.uk | 2.02 | 1.44 | -0.58 | -28.72% | UK |
| cognism.com | 1.95 | 1.39 | -0.56 | -28.71% | UK |
| tvlicensing.co.uk | 1.72 | 1.23 | -0.49 | -28.69% | UK |
| gartner.com | 7.65 | 5.47 | -2.19 | -28.56% | UK |
| karenmillen.com | 4.71 | 3.36 | -1.35 | -28.56% | UK |
| radiox.co.uk | 3.33 | 2.38 | -0.95 | -28.56% | UK |
| cpdonline.co.uk | 3.18 | 2.27 | -0.91 | -28.54% | UK |
| wikivoyage.org | 16.21 | 11.59 | -4.62 | -28.51% | US |
| theeverygirl.com | 2.02 | 1.45 | -0.58 | -28.51% | US |
| bcpcouncil.gov.uk | 1.46 | 1.05 | -0.42 | -28.48% | UK |
| agriaffaires.co.uk | 1.78 | 1.27 | -0.51 | -28.47% | UK |
| prowritingaid.com | 4.36 | 3.12 | -1.24 | -28.44% | US |
| davidyurman.com | 4.02 | 2.88 | -1.14 | -28.42% | US |
| keh.com | 5.72 | 4.09 | -1.62 | -28.39% | US |
| feelgoodfoodie.net | 2.75 | 1.97 | -0.78 | -28.30% | UK |
| mastersofgames.com | 3.76 | 2.70 | -1.06 | -28.28% | UK |
| swimsuitsforall.com | 2.32 | 1.66 | -0.66 | -28.27% | US |
| dazeddigital.com | 1.44 | 1.04 | -0.41 | -28.22% | UK |
| thursdayboots.com | 3.68 | 2.65 | -1.03 | -28.07% | US |
| discogs.com | 133.91 | 96.33 | -37.58 | -28.06% | UK |
| nordstrom.com | 103.82 | 74.75 | -29.07 | -28.00% | US |
| mdcalc.com | 2.62 | 1.88 | -0.73 | -27.98% | UK |
| cnet.com | 25.22 | 18.17 | -7.06 | -27.97% | UK |
| appily.com | 3.50 | 2.53 | -0.98 | -27.92% | US |
| broadband.co.uk | 1.66 | 1.19 | -0.46 | -27.92% | UK |
| animaker.com | 1.39 | 1.01 | -0.39 | -27.91% | US |
| eastpak.com | 1.46 | 1.05 | -0.41 | -27.91% | UK |
| vulture.com | 3.93 | 2.83 | -1.10 | -27.90% | US |
| buyacar.co.uk | 1.51 | 1.09 | -0.42 | -27.90% | UK |
| uci.edu | 1.62 | 1.17 | -0.45 | -27.89% | UK |
| heirloomroses.com | 1.40 | 1.01 | -0.39 | -27.87% | US |
| nature.com | 31.10 | 22.43 | -8.67 | -27.87% | US |
| piercingmania.co.uk | 7.03 | 5.07 | -1.96 | -27.86% | UK |
| hbr.org | 12.38 | 8.93 | -3.45 | -27.85% | UK |
| vectorstock.com | 6.19 | 4.47 | -1.72 | -27.85% | UK |
| ibisworld.com | 1.45 | 1.05 | -0.40 | -27.84% | US |
| oxfordlearnersdictionaries.com | 32.76 | 23.67 | -9.09 | -27.75% | US |
| squaremeal.co.uk | 3.64 | 2.63 | -1.01 | -27.73% | UK |
| famousbirthdays.com | 7.86 | 5.68 | -2.18 | -27.72% | US |
| piliapp.com | 1.41 | 1.02 | -0.39 | -27.70% | US |
| indiewire.com | 1.58 | 1.14 | -0.44 | -27.69% | UK |
| freegames.org | 2.23 | 1.62 | -0.62 | -27.64% | US |
| awwwards.com | 2.03 | 1.47 | -0.56 | -27.63% | UK |
| reiss.com | 2.27 | 1.64 | -0.63 | -27.61% | UK |
| uppbeat.io | 2.74 | 1.99 | -0.76 | -27.59% | UK |
| properstar.co.uk | 2.59 | 1.87 | -0.71 | -27.58% | UK |
| retrogames.cz | 1.64 | 1.19 | -0.45 | -27.57% | US |
| cookology.com | 2.60 | 1.88 | -0.72 | -27.57% | UK |
| csis.org | 2.11 | 1.53 | -0.58 | -27.56% | US |
| pcgs.com | 1.66 | 1.20 | -0.46 | -27.52% | US |
| booksy.com | 1.42 | 1.03 | -0.39 | -27.52% | UK |
| schoolofrock.com | 2.01 | 1.46 | -0.55 | -27.51% | UK |
| mandco.com | 2.86 | 2.07 | -0.79 | -27.49% | UK |
| kkbox.com | 2.33 | 1.69 | -0.64 | -27.48% | UK |
| hiphopdx.com | 1.94 | 1.41 | -0.53 | -27.47% | US |
| pocketmags.com | 2.68 | 1.95 | -0.73 | -27.37% | UK |
| gardenersworld.com | 2.21 | 1.61 | -0.60 | -27.34% | US |
| minimalistbaker.com | 1.92 | 1.39 | -0.52 | -27.33% | US |
| smartraveller.gov.au | 2.05 | 1.49 | -0.56 | -27.33% | US |
| savefrom.net | 1.49 | 1.08 | -0.41 | -27.32% | US |
| pcgamingwiki.com | 1.69 | 1.23 | -0.46 | -27.26% | US |
| budgetbytes.com | 9.55 | 6.95 | -2.60 | -27.21% | US |
| siteground.com | 2.31 | 1.68 | -0.63 | -27.21% | US |
| goal.com | 6.49 | 4.73 | -1.76 | -27.18% | UK |
| cbr.com | 6.17 | 4.50 | -1.67 | -27.13% | UK |
| gsmarena.com | 10.67 | 7.80 | -2.87 | -26.90% | US |
| newyorker.com | 12.47 | 9.13 | -3.34 | -26.77% | UK |
| habitat.co.uk | 24.92 | 18.27 | -6.65 | -26.68% | UK |
| peacocktv.com | 7.41 | 5.44 | -1.97 | -26.60% | US |
| dermnetnz.org | 19.14 | 14.05 | -5.08 | -26.57% | UK |
| daysoftheyear.com | 8.06 | 5.92 | -2.14 | -26.56% | US |
| astridandmiyu.com | 8.28 | 6.08 | -2.20 | -26.55% | UK |
| officialcharts.com | 12.78 | 9.42 | -3.36 | -26.29% | UK |
| eatingwell.com | 7.64 | 5.64 | -2.00 | -26.18% | UK |
| myanimelist.net | 6.51 | 4.81 | -1.70 | -26.15% | UK |
| spiceworks.com | 25.78 | 19.10 | -6.68 | -25.91% | US |
| homebase.co.uk | 6.36 | 4.72 | -1.64 | -25.74% | UK |
| pons.com | 10.46 | 7.77 | -2.69 | -25.72% | UK |
| zendesk.com | 8.52 | 6.33 | -2.19 | -25.69% | US |
| biomedcentral.com | 10.58 | 7.88 | -2.70 | -25.55% | UK |
| tradingeconomics.com | 13.78 | 10.29 | -3.48 | -25.28% | UK |
| hellomagazine.com | 11.07 | 8.30 | -2.77 | -25.01% | UK |
| mathsisfun.com | 26.49 | 19.87 | -6.63 | -25.01% | UK |
| nationwide.co.uk | 27.81 | 20.87 | -6.95 | -24.97% | UK |
| gsmarena.com | 10.29 | 7.75 | -2.54 | -24.69% | UK |
| eatingwell.com | 6.67 | 5.03 | -1.64 | -24.53% | US |
| giphy.com | 6.42 | 4.84 | -1.57 | -24.53% | UK |
| majorgeeks.com | 8.61 | 6.52 | -2.08 | -24.19% | UK |
| momondo.com | 5.16 | 3.91 | -1.25 | -24.18% | US |
| cbr.com | 6.89 | 5.23 | -1.66 | -24.10% | US |
| newsstand.co.uk | 5.93 | 4.50 | -1.43 | -24.07% | UK |
| glamourmagazine.co.uk | 14.38 | 10.95 | -3.44 | -23.89% | UK |
| zapier.com | 8.98 | 6.84 | -2.14 | -23.85% | US |
| nordvpn.com | 5.46 | 4.16 | -1.30 | -23.83% | US |
| litrg.org.uk | 6.02 | 4.59 | -1.43 | -23.74% | UK |
| dailymail.co.uk | 9.01 | 6.88 | -2.13 | -23.63% | US |
| danword.com | 6.72 | 5.15 | -1.56 | -23.27% | UK |
| nordvpn.com | 5.89 | 4.52 | -1.37 | -23.22% | UK |
| eater.com | 9.52 | 7.31 | -2.20 | -23.16% | US |
| mailchimp.com | 8.06 | 6.20 | -1.86 | -23.12% | UK |
| fidelity.co.uk | 6.27 | 4.82 | -1.44 | -23.00% | UK |
| majorgeeks.com | 7.09 | 5.47 | -1.62 | -22.79% | US |
| biomedcentral.com | 5.95 | 4.60 | -1.35 | -22.72% | US |
| oakfurnitureland.co.uk | 14.73 | 11.41 | -3.33 | -22.58% | UK |
| prevention.com | 5.57 | 4.32 | -1.25 | -22.46% | US |
| tradingeconomics.com | 14.07 | 10.92 | -3.15 | -22.40% | US |
| jamieoliver.com | 21.05 | 16.36 | -4.70 | -22.31% | UK |
| lyst.co.uk | 10.58 | 8.23 | -2.35 | -22.23% | UK |
| neoseeker.com | 5.82 | 4.53 | -1.29 | -22.10% | US |
| tvinsider.com | 13.12 | 10.23 | -2.89 | -22.04% | US |
| pons.com | 12.99 | 10.14 | -2.85 | -21.96% | US |
| cntraveller.com | 9.01 | 7.03 | -1.98 | -21.93% | UK |
| menswearhouse.com | 6.86 | 5.36 | -1.50 | -21.82% | US |
| myanimelist.net | 6.55 | 5.13 | -1.42 | -21.67% | US |
| halloweencostumes.co.uk | 10.16 | 7.96 | -2.20 | -21.65% | UK |
| theknot.com | 10.91 | 8.55 | -2.36 | -21.63% | UK |
| streetdirectory.com | 26.14 | 20.51 | -5.63 | -21.53% | UK |
| vouchercodes.co.uk | 11.21 | 8.80 | -2.41 | -21.51% | UK |
| jcpenney.com | 15.29 | 12.02 | -3.27 | -21.41% | US |
| worldofbooks.com | 13.73 | 10.79 | -2.94 | -21.38% | UK |
| dpreview.com | 15.08 | 11.86 | -3.22 | -21.36% | US |
| commonsensemedia.org | 16.31 | 12.83 | -3.47 | -21.30% | UK |
| newyorker.com | 10.97 | 8.65 | -2.32 | -21.17% | US |
| horoscope.com | 5.81 | 4.58 | -1.23 | -21.12% | US |
| transfermarkt.us | 8.02 | 6.33 | -1.69 | -21.11% | US |
| asana.com | 5.79 | 4.57 | -1.22 | -21.07% | US |
| gameforge.com | 6.78 | 5.36 | -1.42 | -20.97% | US |
| zapier.com | 10.17 | 8.04 | -2.13 | -20.92% | UK |
| statista.com | 7.44 | 5.90 | -1.54 | -20.64% | UK |
| horoscope.com | 8.57 | 6.80 | -1.77 | -20.61% | UK |
| mailchimp.com | 5.90 | 4.69 | -1.21 | -20.53% | US |
| crosswordsolver.com | 15.30 | 12.16 | -3.14 | -20.53% | UK |
| theknot.com | 23.73 | 18.87 | -4.86 | -20.47% | US |
| frontiersin.org | 7.85 | 6.25 | -1.60 | -20.38% | UK |
| gymshark.com | 9.89 | 7.88 | -2.02 | -20.38% | UK |
| hbs.edu | 7.44 | 5.94 | -1.50 | -20.21% | UK |
| gamerant.com | 9.48 | 7.56 | -1.91 | -20.20% | US |
| tunein.com | 6.36 | 5.07 | -1.28 | -20.17% | US |
| studysmarter.co.uk | 9.11 | 7.28 | -1.84 | -20.15% | UK |
| mandmdirect.com | 12.33 | 9.85 | -2.48 | -20.11% | UK |
| thekitchn.com | 25.10 | 20.10 | -5.00 | -19.93% | UK |
| rateyourmusic.com | 13.01 | 10.42 | -2.59 | -19.88% | UK |
| maxpreps.com | 6.90 | 5.53 | -1.37 | -19.82% | US |
| screenrant.com | 20.46 | 16.44 | -4.03 | -19.69% | UK |
| wsj.com | 10.86 | 8.72 | -2.14 | -19.68% | US |
| express.co.uk | 15.44 | 12.45 | -2.99 | -19.34% | UK |
| biblestudytools.com | 15.31 | 12.38 | -2.93 | -19.13% | US |
| asana.com | 8.79 | 7.13 | -1.66 | -18.86% | UK |
| howdens.com | 8.27 | 6.71 | -1.56 | -18.83% | UK |
| bbcgoodfood.com | 16.32 | 13.26 | -3.06 | -18.72% | US |
| taylorandfrancis.com | 13.45 | 10.96 | -2.49 | -18.51% | UK |
| avsforum.com | 8.41 | 6.85 | -1.55 | -18.48% | US |
| caranddriver.com | 12.28 | 10.01 | -2.27 | -18.48% | UK |
| hoseasons.co.uk | 9.00 | 7.34 | -1.66 | -18.44% | UK |
| metacritic.com | 16.55 | 13.52 | -3.03 | -18.31% | UK |
| pandora.net | 6.91 | 5.65 | -1.25 | -18.16% | US |
| hbs.edu | 9.63 | 7.89 | -1.75 | -18.13% | US |
| charitycommission.gov.uk | 7.60 | 6.23 | -1.37 | -18.07% | UK |
| tasteofhome.com | 11.64 | 9.55 | -2.09 | -17.97% | US |
| xe.com | 27.93 | 22.91 | -5.02 | -17.96% | UK |
| uw.edu | 9.24 | 7.59 | -1.65 | -17.89% | US |
| tenforums.com | 7.51 | 6.16 | -1.34 | -17.89% | US |
| poshmark.com | 8.32 | 6.84 | -1.48 | -17.81% | US |
| columbia.edu | 8.74 | 7.19 | -1.55 | -17.77% | UK |
| capitalone.com | 13.08 | 10.76 | -2.32 | -17.73% | US |
| youporn.com | 20.92 | 17.22 | -3.70 | -17.66% | UK |
| sothebysrealty.com | 11.20 | 9.24 | -1.95 | -17.44% | US |
| governmentjobs.com | 10.04 | 8.31 | -1.73 | -17.26% | US |
| express.com | 9.62 | 8.00 | -1.62 | -16.88% | US |
| kew.org | 9.00 | 7.49 | -1.52 | -16.83% | UK |
| xe.com | 18.45 | 15.38 | -3.07 | -16.63% | US |
| whathifi.com | 14.49 | 12.09 | -2.40 | -16.58% | UK |
| screenrant.com | 15.75 | 13.16 | -2.59 | -16.46% | US |
| southernliving.com | 11.61 | 9.71 | -1.90 | -16.40% | UK |
| theperfumeshop.com | 9.85 | 8.24 | -1.62 | -16.39% | UK |
| tripadvisor.com | 17.94 | 15.03 | -2.91 | -16.21% | UK |
| statista.com | 8.49 | 7.12 | -1.37 | -16.13% | US |
| dsw.com | 8.76 | 7.35 | -1.41 | -16.08% | US |
| premierleague.com | 22.72 | 19.07 | -3.65 | -16.07% | UK |
| bhg.com | 9.68 | 8.12 | -1.55 | -16.06% | US |
| hl.co.uk | 24.35 | 20.44 | -3.91 | -16.05% | UK |
| tshaonline.org | 8.60 | 7.22 | -1.38 | -16.04% | US |
| informer.com | 9.63 | 8.09 | -1.54 | -15.99% | US |
| southwestvacations.com | 9.49 | 7.99 | -1.51 | -15.89% | US |
| ancestry.com | 21.21 | 17.89 | -3.32 | -15.66% | US |
| cycletrader.com | 8.15 | 6.89 | -1.26 | -15.50% | US |
| money.co.uk | 11.16 | 9.43 | -1.73 | -15.46% | UK |
| redtube.com | 9.83 | 8.31 | -1.51 | -15.39% | UK |
| biblestudytools.com | 10.21 | 8.66 | -1.55 | -15.21% | UK |
| inspiredtaste.net | 10.73 | 9.10 | -1.63 | -15.20% | US |
| variety.com | 9.88 | 8.39 | -1.49 | -15.09% | UK |
| alamy.com | 10.16 | 8.63 | -1.53 | -15.07% | UK |
| findlaw.com | 13.69 | 11.64 | -2.05 | -14.95% | US |
| housebeautiful.com | 11.00 | 9.36 | -1.65 | -14.95% | UK |
| zappos.com | 9.44 | 8.05 | -1.39 | -14.73% | US |
| woodlandtrust.org.uk | 28.09 | 24.00 | -4.09 | -14.56% | UK |
| commonsensemedia.org | 17.26 | 14.76 | -2.50 | -14.48% | US |
| hays.co.uk | 10.19 | 8.74 | -1.45 | -14.23% | UK |
| warrenjames.co.uk | 11.78 | 10.12 | -1.67 | -14.15% | UK |
| hubspot.com | 17.89 | 15.36 | -2.53 | -14.12% | UK |
| just-eat.co.uk | 11.20 | 9.63 | -1.57 | -14.05% | UK |
| hubspot.com | 12.28 | 10.55 | -1.72 | -14.04% | US |
| playstation.com | 19.77 | 17.00 | -2.77 | -14.01% | UK |
| libertymutual.com | 12.54 | 10.79 | -1.75 | -13.93% | US |
| vistaprint.com | 13.05 | 11.25 | -1.80 | -13.80% | US |
| arkadium.com | 11.49 | 9.91 | -1.58 | -13.71% | US |
| uptodown.com | 22.43 | 19.42 | -3.01 | -13.41% | US |
| basspro.com | 9.73 | 8.44 | -1.30 | -13.31% | US |
| informer.com | 12.23 | 10.61 | -1.62 | -13.26% | UK |
| buzzfeed.com | 26.26 | 22.78 | -3.48 | -13.25% | US |
| petco.com | 11.31 | 9.81 | -1.50 | -13.25% | US |
| history.com | 21.00 | 18.23 | -2.78 | -13.22% | UK |
| apnews.com | 19.57 | 17.00 | -2.58 | -13.16% | US |
| kenhub.com | 11.58 | 10.06 | -1.52 | -13.14% | UK |
| lifewire.com | 12.78 | 11.13 | -1.66 | -12.97% | US |
| fender.com | 12.42 | 10.81 | -1.60 | -12.92% | UK |
| usc.edu | 9.38 | 8.18 | -1.21 | -12.84% | US |
| teacherspayteachers.com | 10.16 | 8.86 | -1.30 | -12.82% | US |
| babycenter.com | 14.46 | 12.63 | -1.82 | -12.62% | US |
| airbnb.com | 12.22 | 10.69 | -1.53 | -12.55% | US |
| digitalspy.com | 10.79 | 9.44 | -1.35 | -12.52% | UK |
| idealo.co.uk | 12.48 | 10.92 | -1.56 | -12.52% | UK |
| uptodown.com | 19.48 | 17.05 | -2.44 | -12.50% | UK |
| standard.co.uk | 14.48 | 12.67 | -1.81 | -12.47% | UK |
| ryman.co.uk | 19.91 | 17.45 | -2.47 | -12.39% | UK |
| rapidtables.com | 15.90 | 13.93 | -1.97 | -12.36% | UK |
| classicfm.com | 11.44 | 10.04 | -1.40 | -12.24% | UK |
| flickr.com | 21.99 | 19.32 | -2.68 | -12.16% | UK |
| ford.com | 13.73 | 12.07 | -1.67 | -12.14% | US |
| cia.gov | 13.43 | 11.83 | -1.60 | -11.94% | US |
| timeout.com | 12.38 | 10.90 | -1.48 | -11.93% | US |
| metacritic.com | 21.33 | 18.79 | -2.54 | -11.91% | US |
| brainyquote.com | 15.19 | 13.38 | -1.81 | -11.91% | UK |
| billboard.com | 15.55 | 13.75 | -1.81 | -11.62% | UK |
| halloweencostumes.com | 12.12 | 10.71 | -1.41 | -11.60% | US |
| britishcouncil.org | 23.55 | 20.83 | -2.72 | -11.57% | UK |
| londonstockexchange.com | 13.45 | 11.91 | -1.54 | -11.42% | UK |
| brainyquote.com | 13.53 | 12.02 | -1.51 | -11.17% | US |
| agoda.com | 11.67 | 10.37 | -1.30 | -11.17% | US |
| osu.edu | 11.66 | 10.36 | -1.30 | -11.14% | US |
| ucl.ac.uk | 19.09 | 16.97 | -2.12 | -11.12% | UK |
| inspiredtaste.net | 13.54 | 12.03 | -1.50 | -11.09% | UK |
| rapidtables.com | 19.16 | 17.08 | -2.08 | -10.85% | US |
| hgtv.com | 12.39 | 11.07 | -1.33 | -10.71% | US |
| robertdyas.co.uk | 15.41 | 13.79 | -1.62 | -10.53% | UK |
| southernliving.com | 18.11 | 16.21 | -1.90 | -10.49% | US |
| bedbathandbeyond.com | 19.56 | 17.53 | -2.03 | -10.38% | US |
| flickr.com | 15.06 | 13.52 | -1.54 | -10.22% | US |
| samsclub.com | 14.08 | 12.65 | -1.43 | -10.17% | US |
| purina.co.uk | 14.79 | 13.30 | -1.49 | -10.06% | UK |
| radiopaedia.org | 14.02 | 12.61 | -1.41 | -10.03% | UK |
| timeout.com | 14.89 | 13.43 | -1.47 | -9.84% | UK |
| nfl.com | 26.92 | 24.29 | -2.62 | -9.75% | US |
| lastminute.com | 28.60 | 25.82 | -2.79 | -9.74% | UK |
| npr.org | 15.23 | 13.77 | -1.46 | -9.56% | UK |
| goodhousekeeping.com | 27.01 | 24.49 | -2.52 | -9.32% | US |
| intel.com | 16.48 | 14.94 | -1.53 | -9.31% | US |
| sephora.com | 14.79 | 13.42 | -1.38 | -9.31% | US |
| agoda.com | 14.67 | 13.31 | -1.35 | -9.23% | UK |
| fbi.gov | 16.75 | 15.22 | -1.52 | -9.10% | US |
| today.com | 15.06 | 13.71 | -1.36 | -9.01% | US |
| menshealth.com | 20.61 | 18.77 | -1.84 | -8.94% | UK |
| billboard.com | 27.53 | 25.14 | -2.40 | -8.70% | US |
| disney.com | 20.09 | 18.35 | -1.74 | -8.67% | US |
| playstation.com | 27.38 | 25.07 | -2.30 | -8.41% | US |
| freeads.co.uk | 20.45 | 18.77 | -1.68 | -8.21% | UK |
| quizclothing.co.uk | 17.07 | 15.68 | -1.38 | -8.10% | UK |
| buzzfeed.com | 27.37 | 25.19 | -2.18 | -7.97% | UK |
| boardgamegeek.com | 18.45 | 17.00 | -1.45 | -7.88% | UK |
| seriouseats.com | 29.14 | 26.84 | -2.29 | -7.87% | US |
| nationalrail.co.uk | 20.44 | 18.85 | -1.59 | -7.78% | UK |
| zedge.net | 16.65 | 15.35 | -1.29 | -7.76% | US |
| onthebeach.co.uk | 25.16 | 23.23 | -1.93 | -7.68% | UK |
| allmusic.com | 29.27 | 27.08 | -2.20 | -7.50% | UK |
| ee.co.uk | 21.26 | 19.76 | -1.50 | -7.04% | UK |
| poki.com | 24.20 | 22.51 | -1.68 | -6.96% | UK |
| ncaa.com | 22.93 | 21.35 | -1.58 | -6.89% | US |
| deepl.com | 22.70 | 21.16 | -1.53 | -6.75% | UK |
| ticketmaster.co.uk | 28.04 | 26.21 | -1.84 | -6.55% | UK |
| tkmaxx.com | 22.73 | 21.32 | -1.41 | -6.20% | UK |
| mit.edu | 26.98 | 25.34 | -1.65 | -6.11% | US |
| nba.com | 23.81 | 22.41 | -1.40 | -5.88% | US |
| mind.org.uk | 26.08 | 24.57 | -1.52 | -5.82% | UK |
| accuweather.com | 29.45 | 27.73 | -1.71 | -5.81% | US |
| totaljobs.com | 29.60 | 27.90 | -1.70 | -5.74% | UK |
| purdue.edu | 26.09 | 24.67 | -1.42 | -5.45% | US |
| oracle.com | 25.42 | 24.04 | -1.39 | -5.45% | UK |
| usbank.com | 25.07 | 23.77 | -1.30 | -5.17% | US |
| costcotravel.com | 27.98 | 26.57 | -1.41 | -5.05% | US |
How to check for domain changes during a Google Core Update
Firstly, understanding the Visibility Index is going to help you. The VI is a transparent and well-defined KPI that can be used at any level of a domain. For example, you can monitor your informational content directory, or the eCommerce directory in your website. The domain overview tutorial will help you to access this information in the toolbox.
Core updates take a few days before they take effect and you’ll see that in the daily Visibility Index chart when changes are detected near the date of the Core Update.
The change detection pin, seen in the images above, will show automatically if there have been significant changes near to the date of the pin. You can also set your own pins.
Test SISTRIX for Free
- Free 14-day test account
- Non-binding. No termination necessary
- Personalised on-boarding with experts