
The domain overview page gives you a quick summary of the most important metrics of a domain. Use this data for a quick analysis or to reveal possible weak points of your competitors.
- How do I reach the Domain Overview page?
- Data Boxes on the Overview Page
- The SISTRIX Visibility Index
- Number of Keywords
- Traffic Estimation
- Links
- Domain Overview
- Top Paths, Hosts and URLs
- Visibility Index - Graph
- Interesting Rankings
- Useful Features
- The Search Bar
- Export and Shortlinks
- Specific Data Box Options
- Help in the Toolbox
- Summary
The available data basis is formed by desktop, mobile, daily and weekly data, all of which can be exported or shared at any time.
How do I reach the Domain Overview page?
After logging into SISTRIX, you will find yourself on the Toolbox start page. There you will find a search bar where you can enter domains, keywords or URLs.
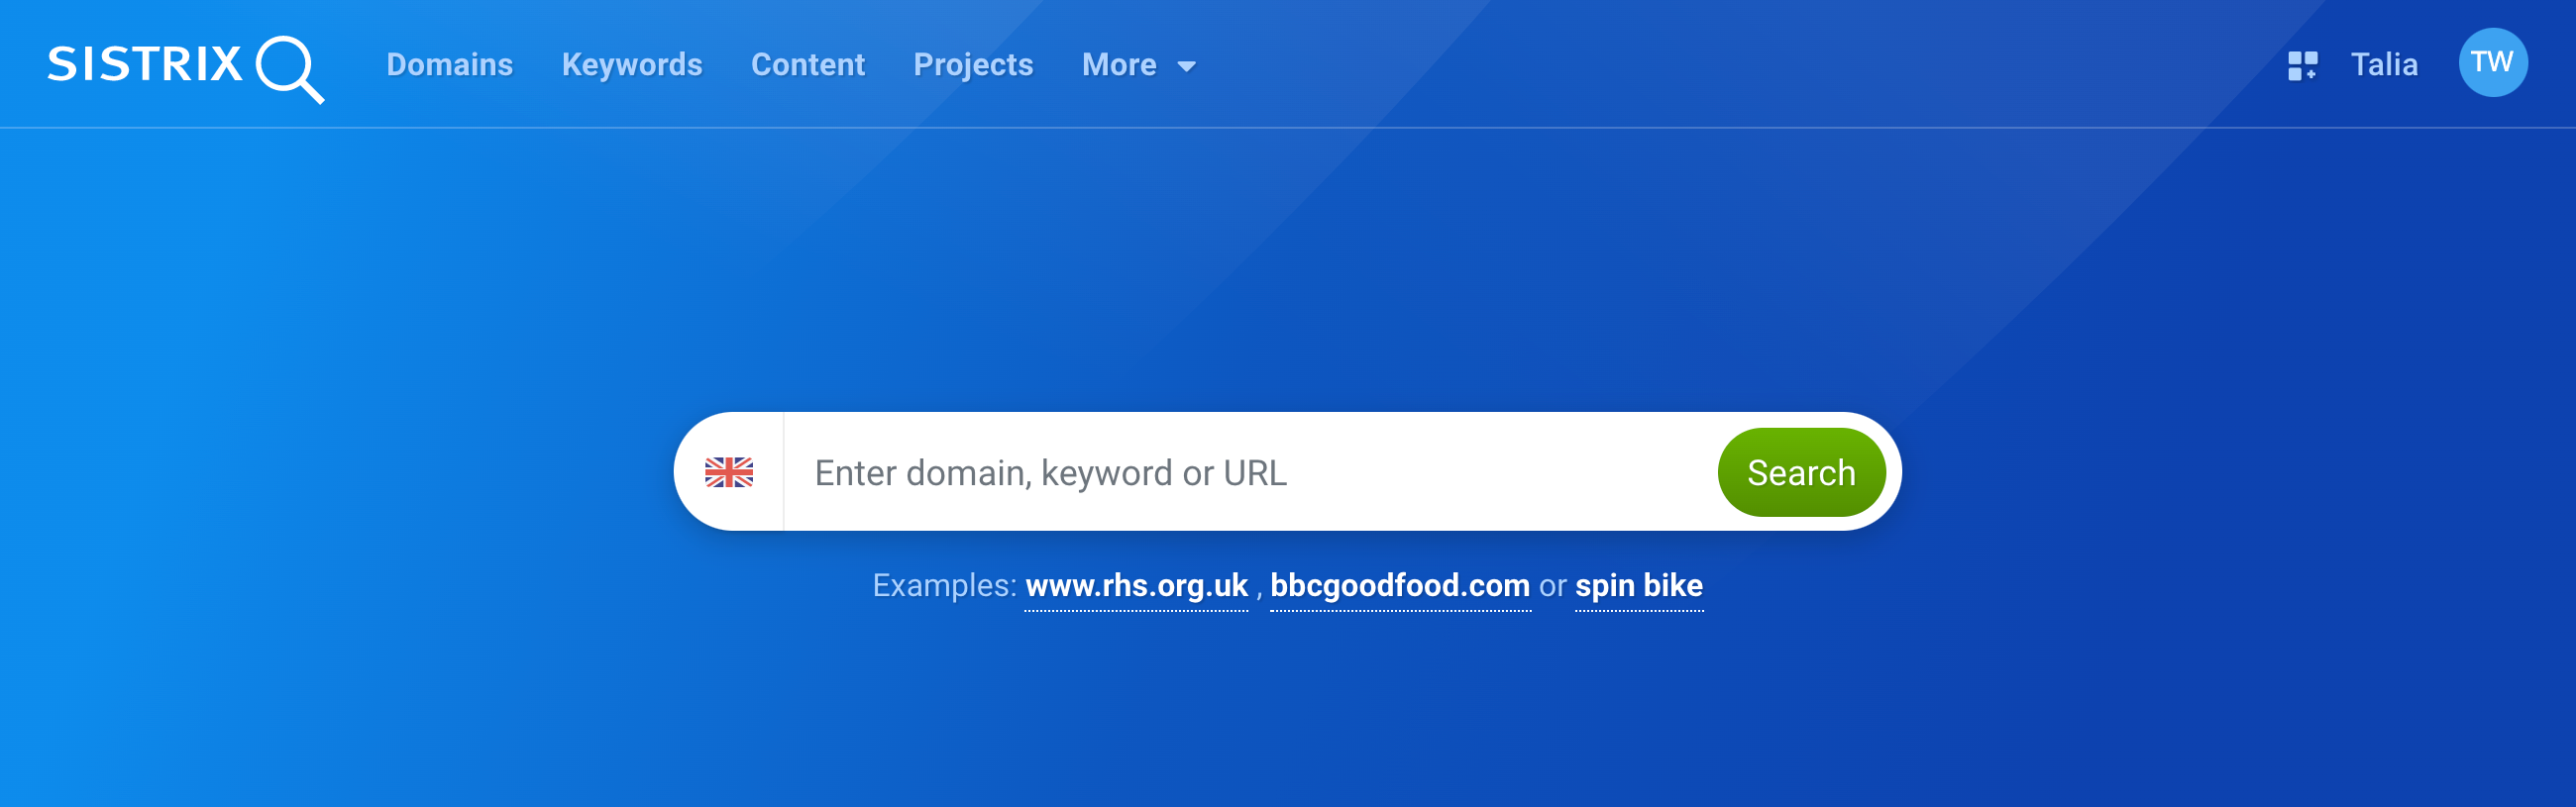
Enter the domain you want to analyse there. By clicking on “Search” or pressing Enter, you will reach the overview page for this domain.
As the name suggests, this page gives you an overview of important key figures of a domain. Each individual element on this page focuses on a particular section of the domain. With just one click, you can go deeper into the analysis from there.
Data Boxes on the Overview Page
Now that we’ve talked through the general features, let’s dive into the specific elements of the domain overview page.
All boxes except the “Domain Overview” box are also available when you are evaluating a subdomain, directory or URL.
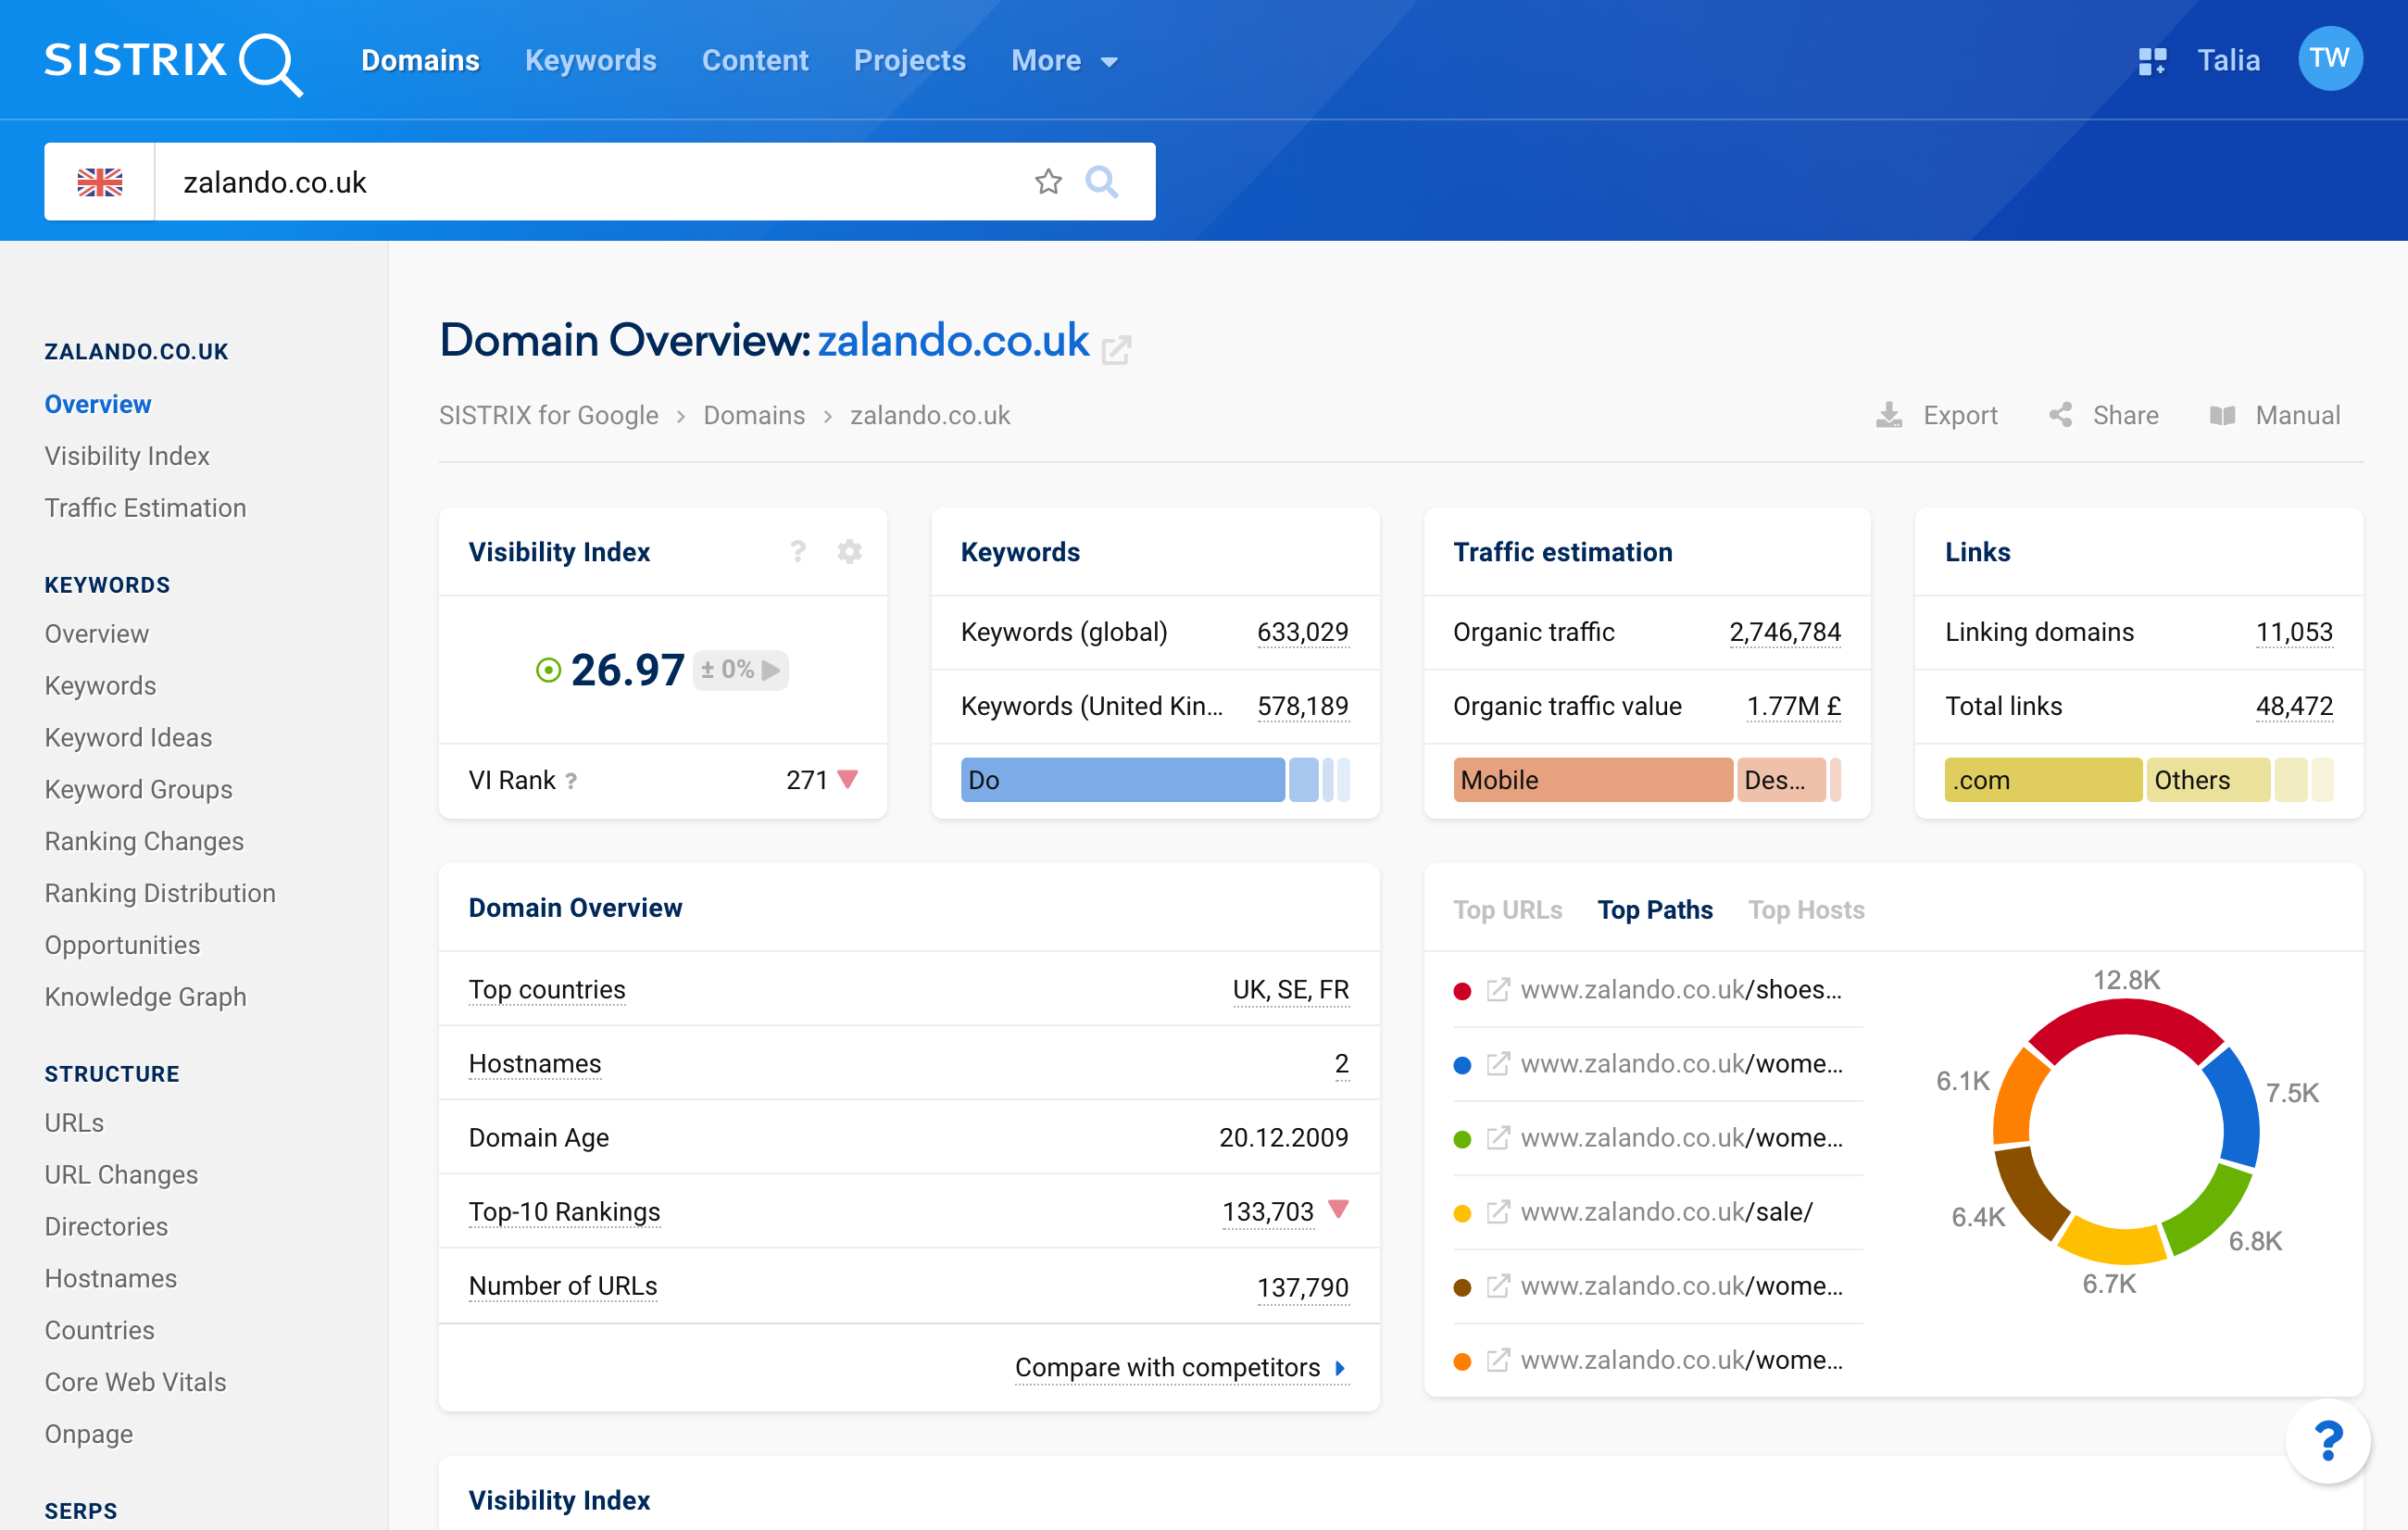
The SISTRIX Visibility Index
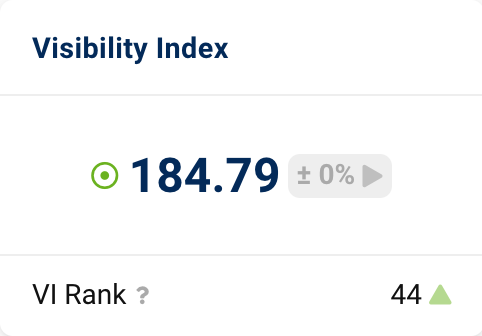
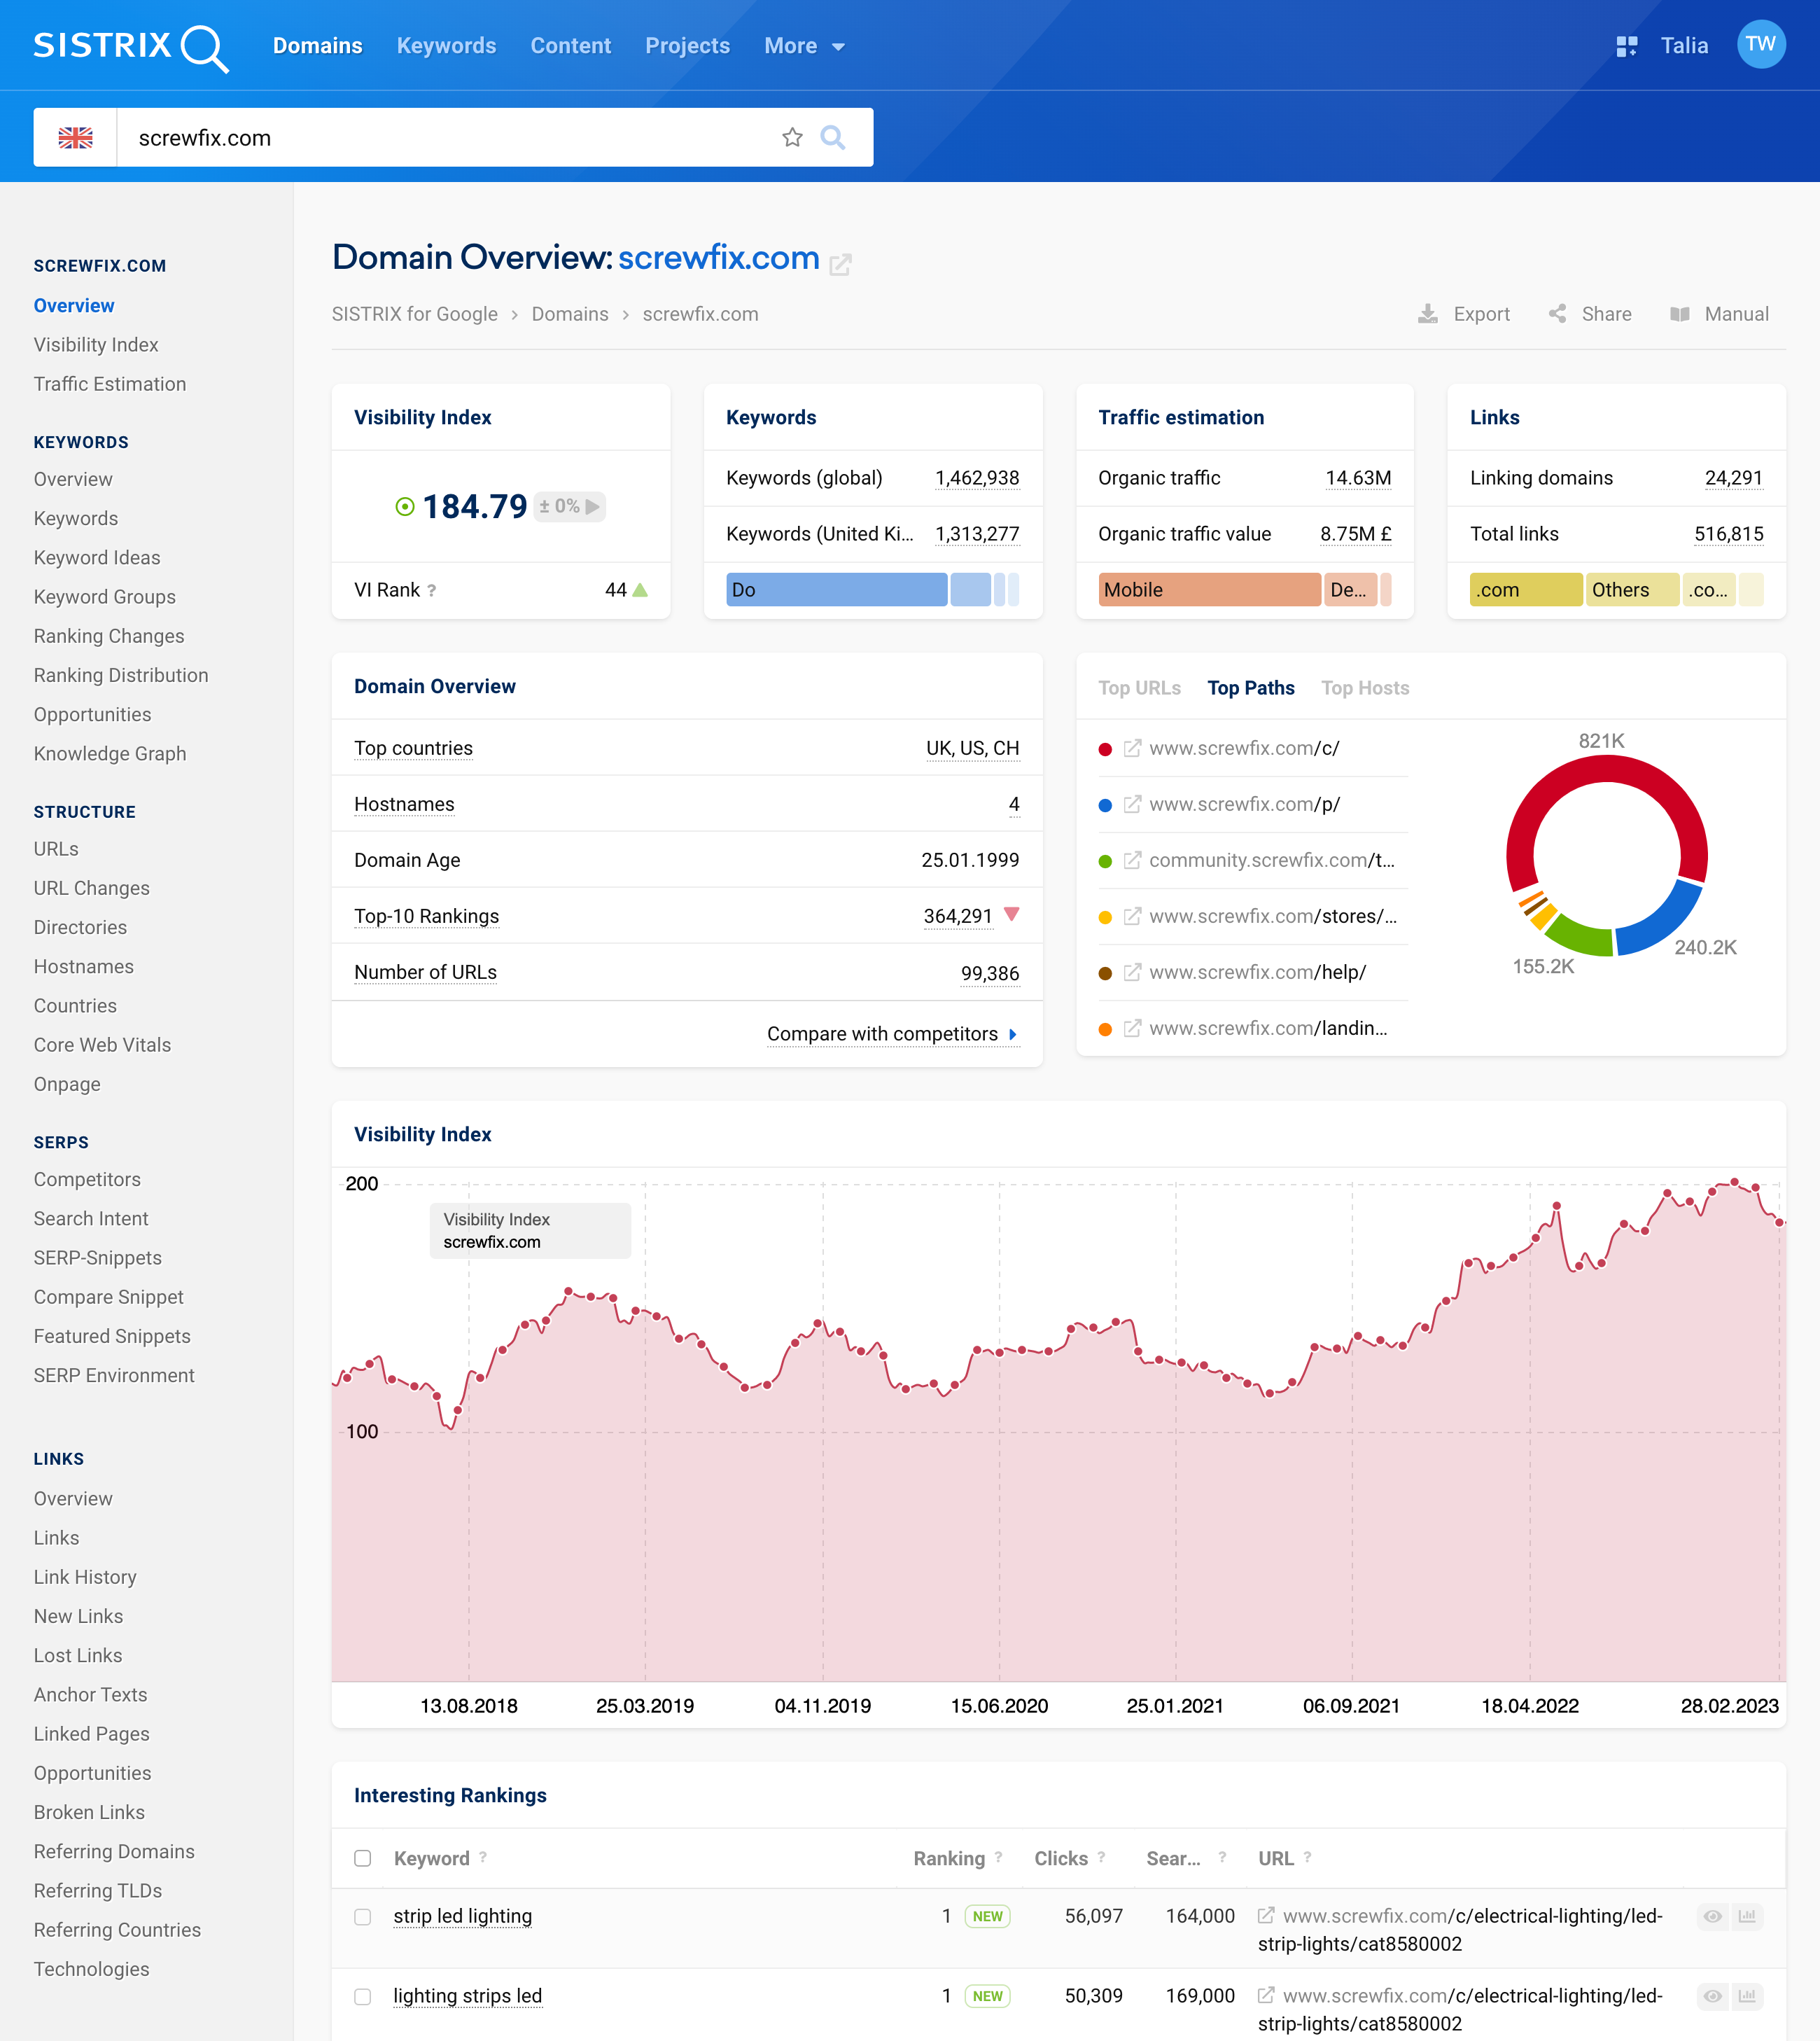
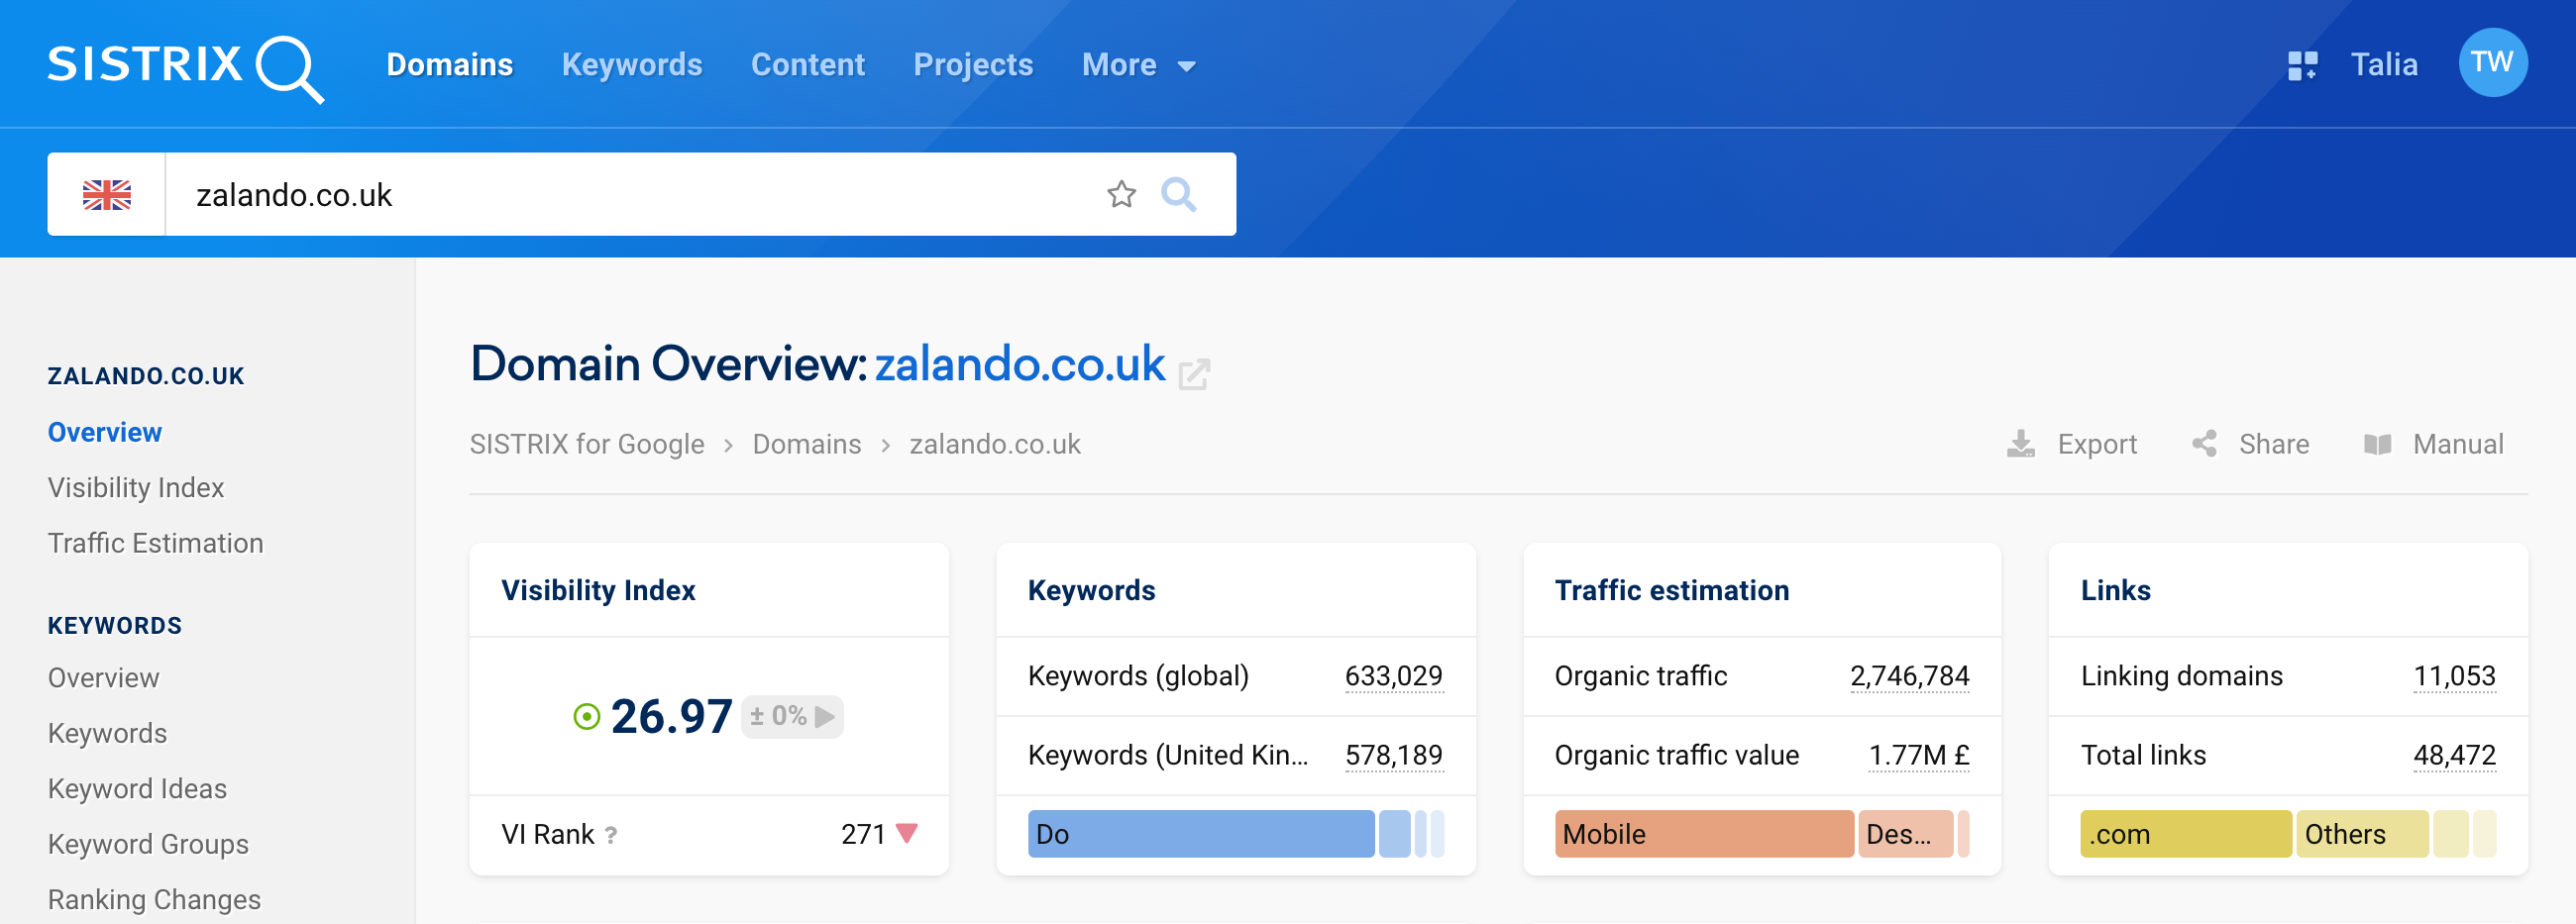
The first box at the top left shows you the daily Visibility Index value of the domain based on mobile data. The change from the previous day’s value is shown in percent. Below that, you can see the VI rank of the domain compared to other domains.
If you move the mouse over the data box, you will see more information on the data basis of the values. For example, when exactly the value was recorded or for which country.
The Visibility Index can help you quickly gauge the overall health and performance of a domain’s visibility. Here you can also often detect when something is going wrong.
Number of Keywords
The next data box gives you a keyword overview of the examined domain.
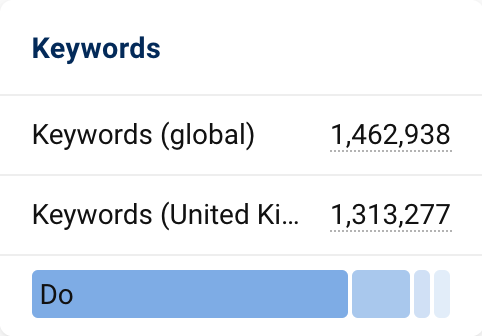
There are three key figures in this box:
- Keywords (global): Number of keywords for which the domain achieves global rankings.
- Keywords (United Kingdom): Number of keywords for which the domain ranks in the selected country. In our case, this is the United Kingdom.
- Search intents: Distribution of the search intent behind the keywords for which the domain achieves rankings.
Click on the underlined keyword numbers to go directly to the detailed keyword evaluation of the domain. If you move the mouse over the bar chart of the search intent, you will also see details there. You can see the exact distribution of search intents behind the keywords for which the domain ranks.
Traffic Estimation
The third data box on the domain overview page contains traffic estimates.
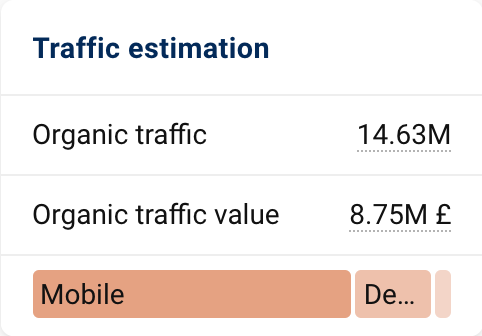
In the first line, you can see our estimate for the average monthly traffic that can be achieved with the found keywords. In our case, the domain screwfix.com could generate 14.63 million clicks via Google with the found keywords. By the way, “estimate” does not mean “speculate” here. You can find all the details in a separate article on traffic estimation.
In the next line, you can find out how much money you would have to spend to achieve this traffic via Google Ads. In other words, what the value of the organically generated traffic is. Again, you can click on the two underlined numbers to go directly to the detailed traffic analysis of the domain.
In the last line, you can see again in the form of a bar chart which device users use to access the examined domain most frequently. If you move the mouse over the bar again, you can see the exact distribution of devices.
Links
The last data box in this row is the one for the domain’s backlinks.
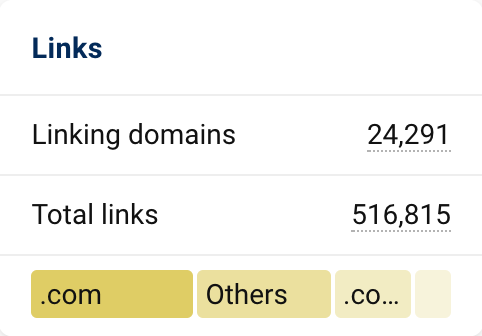
In this box you’ll find:
- Linking domains: The number of domains that link to the examined domain (backlinks).
- Total links: The total number of links that link to the examined domain.
- Top-level domain: The distribution of the top-level domains (TLDs) of the backlinks.
To collect link data, we have our own SISTRIX crawlers, which search through the Internet and continuously process several billion links. By clicking on the underlined numbers, you can directly access the detailed link analysis of the examined domain.
If you move the mouse of the distribution of the TLDs, you will see the exact numbers.
A quick glance at this box will let you quickly see if a domain has an unnatural link profile.
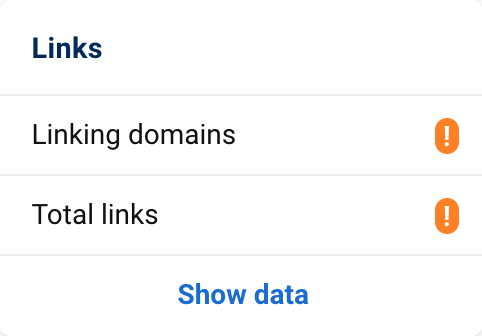
If the link data is not displayed, you can put the domain on your Watchlist via the “Show data” button. From then on, we will regularly request the data for you.
Domain Overview
Now we will go one line down on the domain overview page. There, you will find the data box for the domain overview.
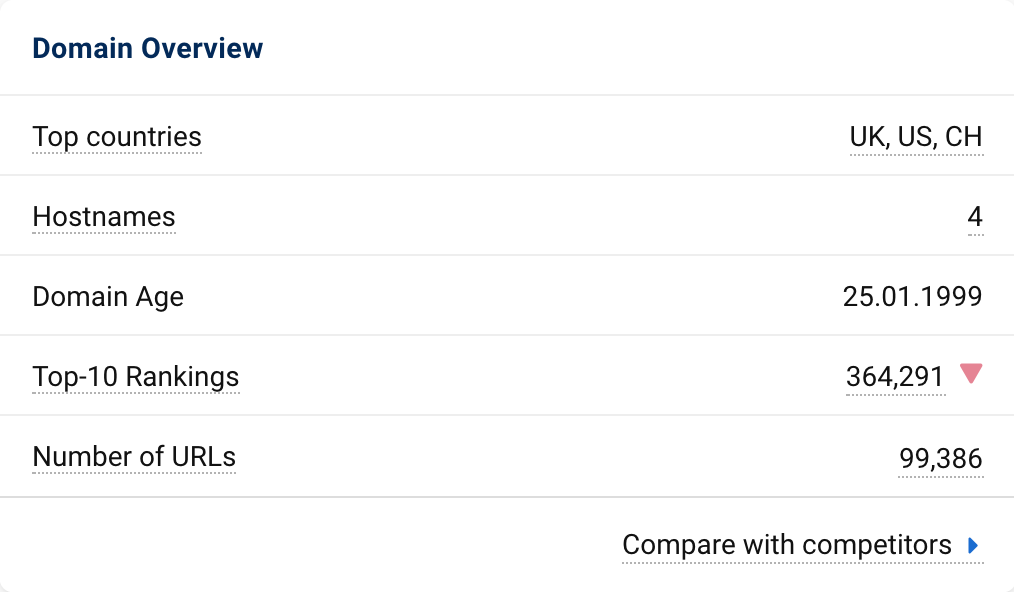
Here you will see a number of key figures that give you a good overview of the domain.
- Top countries: The three countries for which the examined domain has the highest Visibility values.
- Hostnames: The number of different hostnames for which we have found at least one ranking.
- Domain Age: Registration date of the domain
- Top-10 Rankings: The number of keywords for which the evaluated domain ranks in the top 10 positions (i.e., the first page) of Google results.
- Number of URLs: The total number of URLs found in the rankings.
The feature “Compare with competitors” allows you to compare the KPIs of up to 4 domains with each other. This is a first, helpful step for a successful competitor analysis, which we describe in more detail in the tutorial “Analysing the Opposition: Who are my competitors?“.
If you want to compare more than 4 domains, we explain how to do this in the tutorial “Quick-Check: Compare up to 7 Domains“.
Top Paths, Hosts and URLs
To the right of the data box for the domain overview is the data box for the top paths, URLs and hosts.
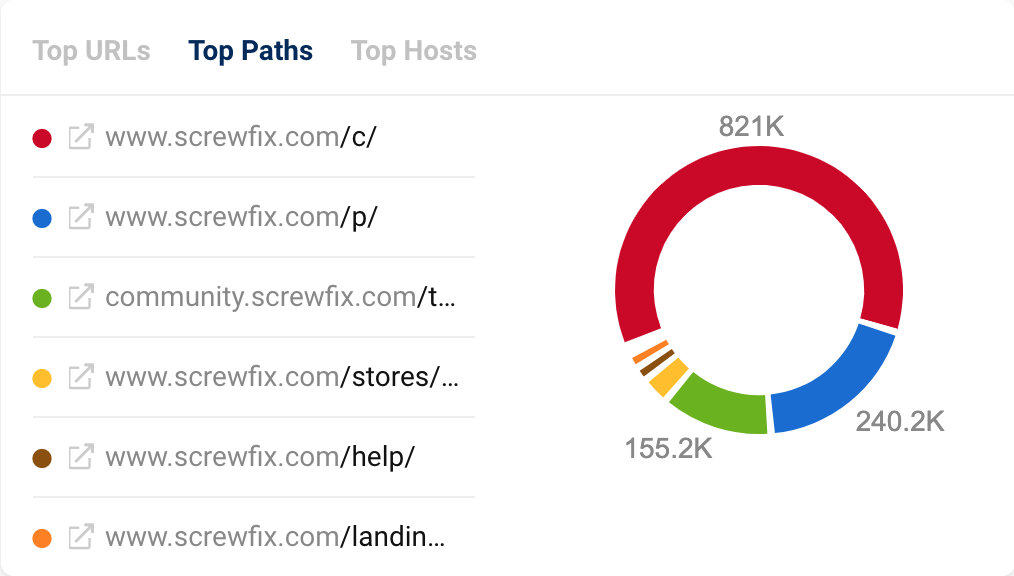
This pie chart shows you the directories, hosts and URLs of the domain that are responsible for the most organic keyword rankings. Clicking on the host, directory or URL will take you directly to the overview page for that specific level.
If you want to see what content can be found on the URL, you can also click on the icon with the small box and the arrow in front of the URL. The URL will then open in a new tab.
With this feature, you can quickly see which parts of the website are performing well on Google. Analyse these in more detail with SISTRIX to find out why they perform so well. You can then use this knowledge as a best practice example to improve your own website.
Visibility Index – Graph
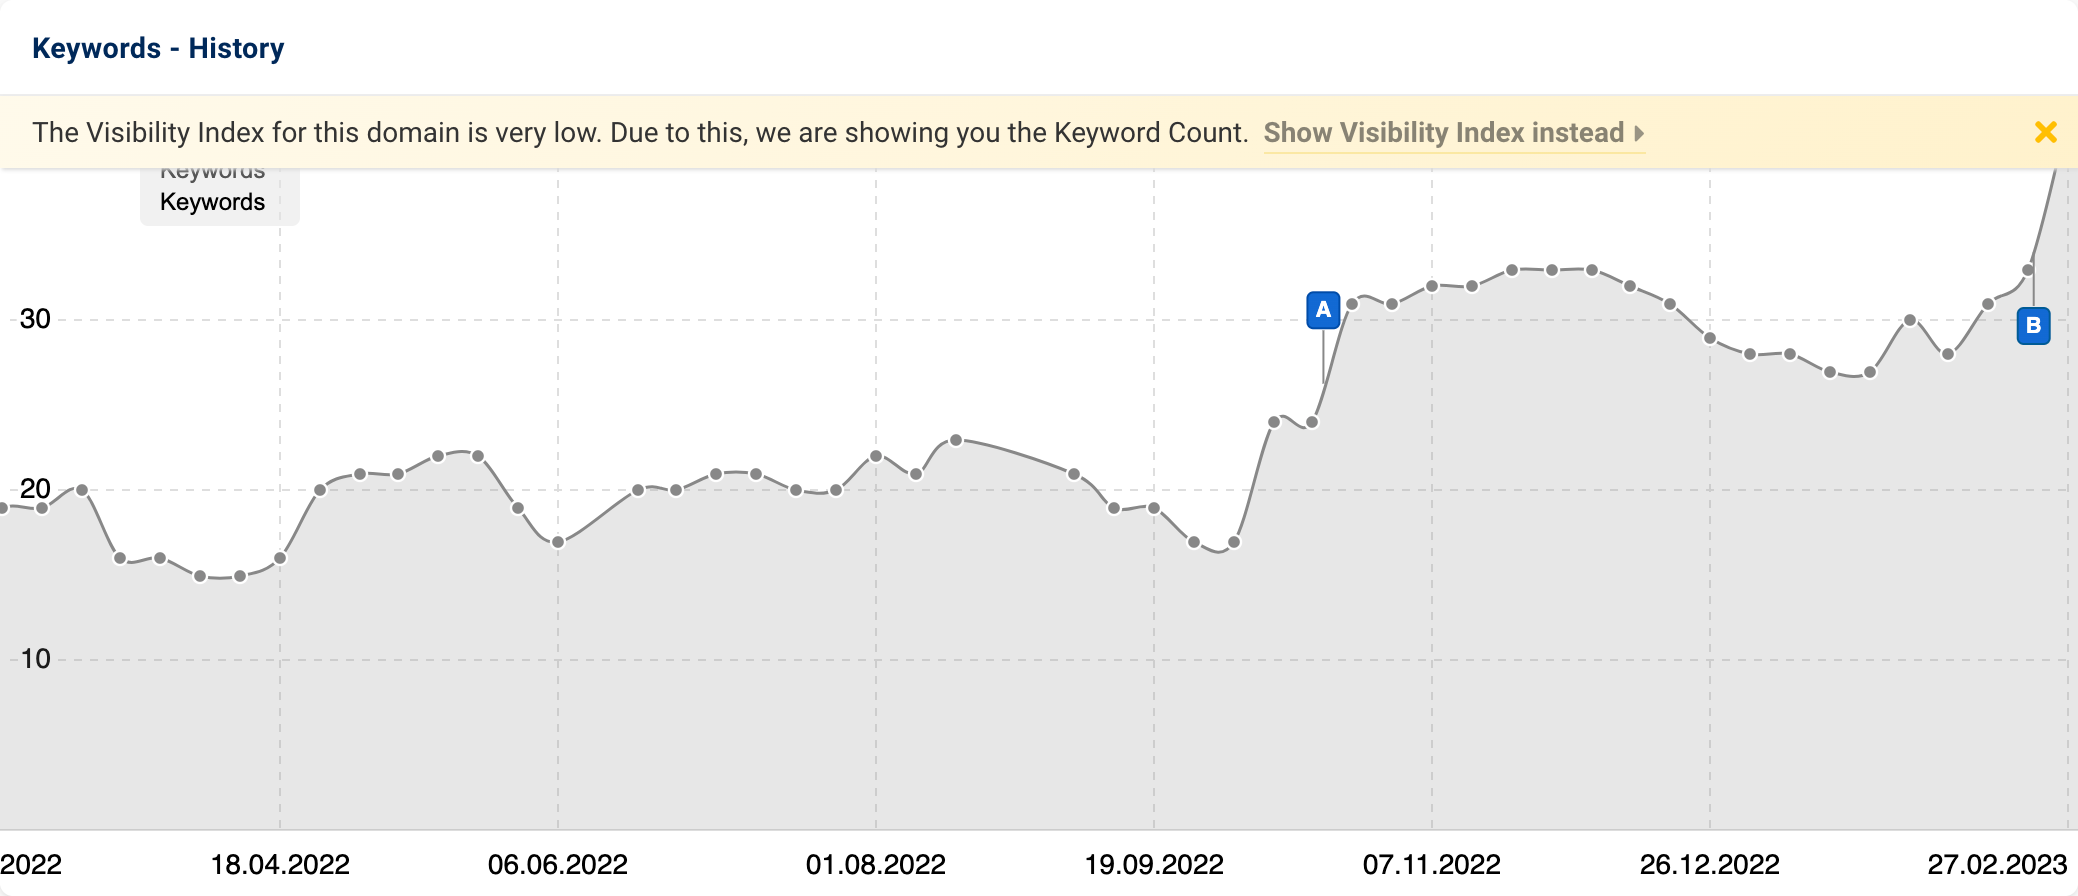
One line down, the domain overview page shows the Visibility history of the examined domain.
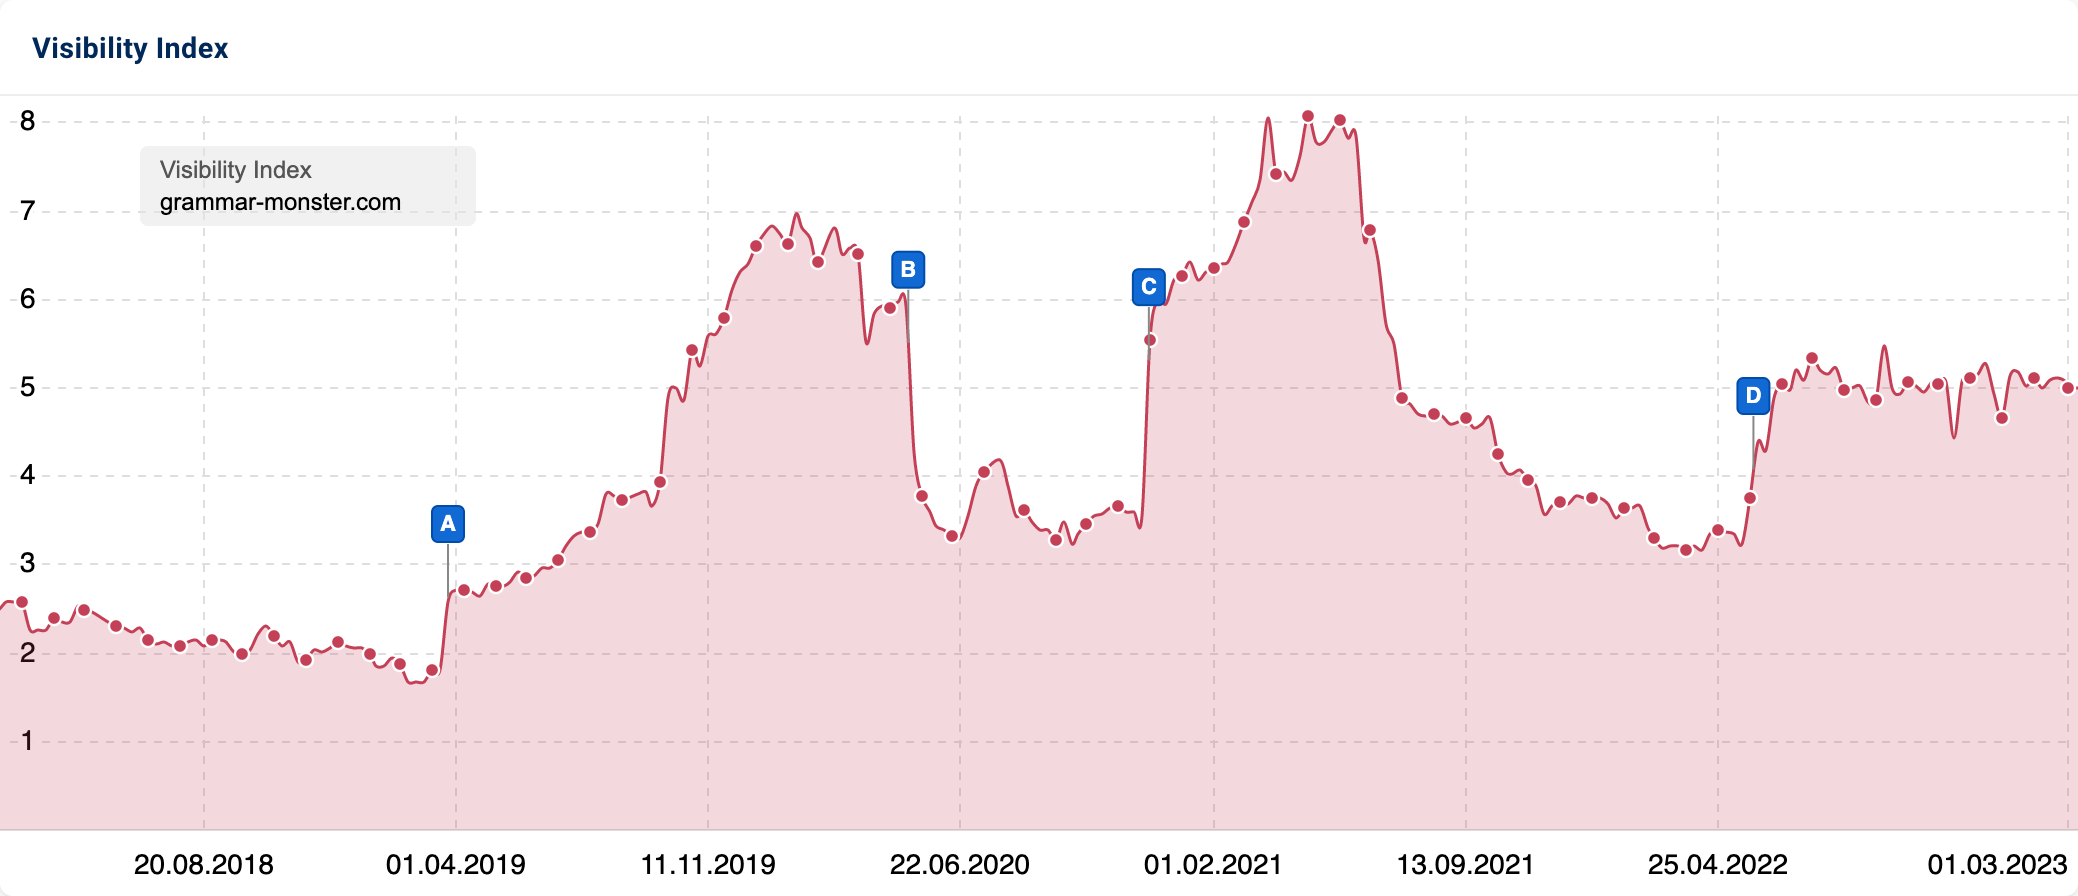
This is a central part of the domain overview page. The graph shows you the SISTRIX Visibility values of the domain over a certain period of time. By default, the mobile Visibility history is displayed here, which we have been collecting since 2015.
If you move the mouse over the graph, a button appears at the top with which you can set the period in time you wish to view. You can also set a specific date range by zooming into an area. To do this, mark the desired area in the Visibility history while holding down the mouse button.
You can also see the keyword table for a specific date by right-clicking on the date and selecting “Show keywords for (domain)”.
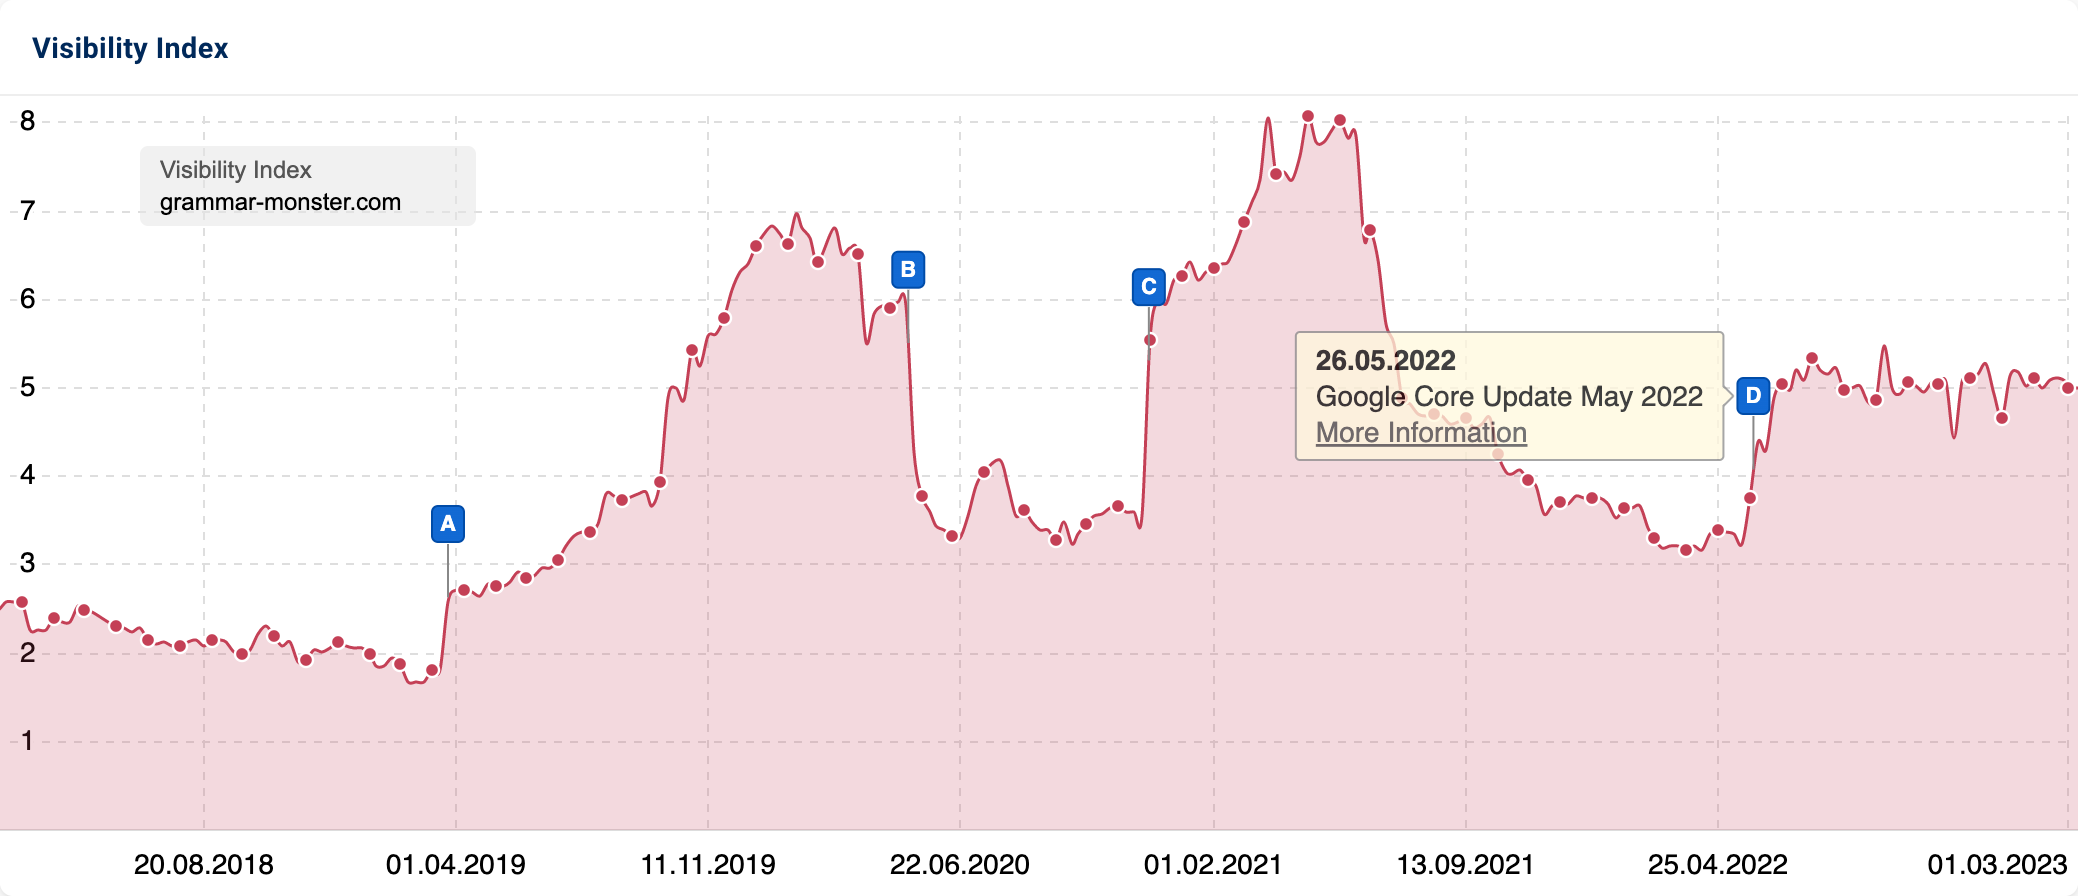
The blue pin in the graph indicates that there was a Google update at that time. If necessary, you should investigate whether this update has something to do with the change in Visibility at this time.
We automatically set the blue pins when there has been a Google update and the Visibility of a domain changes by more than 15%. You can find all the details about global and individual event pins in our tutorial “Document Developments with Event Pins“.
The options for the Visibility history, which can be accessed via the cogwheel icon at the top right of the box, allow you to carry out many different evaluations. We explain the exact options below under “Specific Data Box Options“.
If the Visibility Index of the examined domain is too low, we show you the history of the ranking keywords over time instead. If you still want to see the Visibility history, you can simply click on “Show Visibility Index instead” in the yellow bar.
Interesting Rankings
At the bottom of the domain overview page, you will find a table with “Interesting Rankings”. There you will get an overview of the keywords for which the domain ranks particularly well and which have a high search volume, and are therefore probably especially interesting for you.
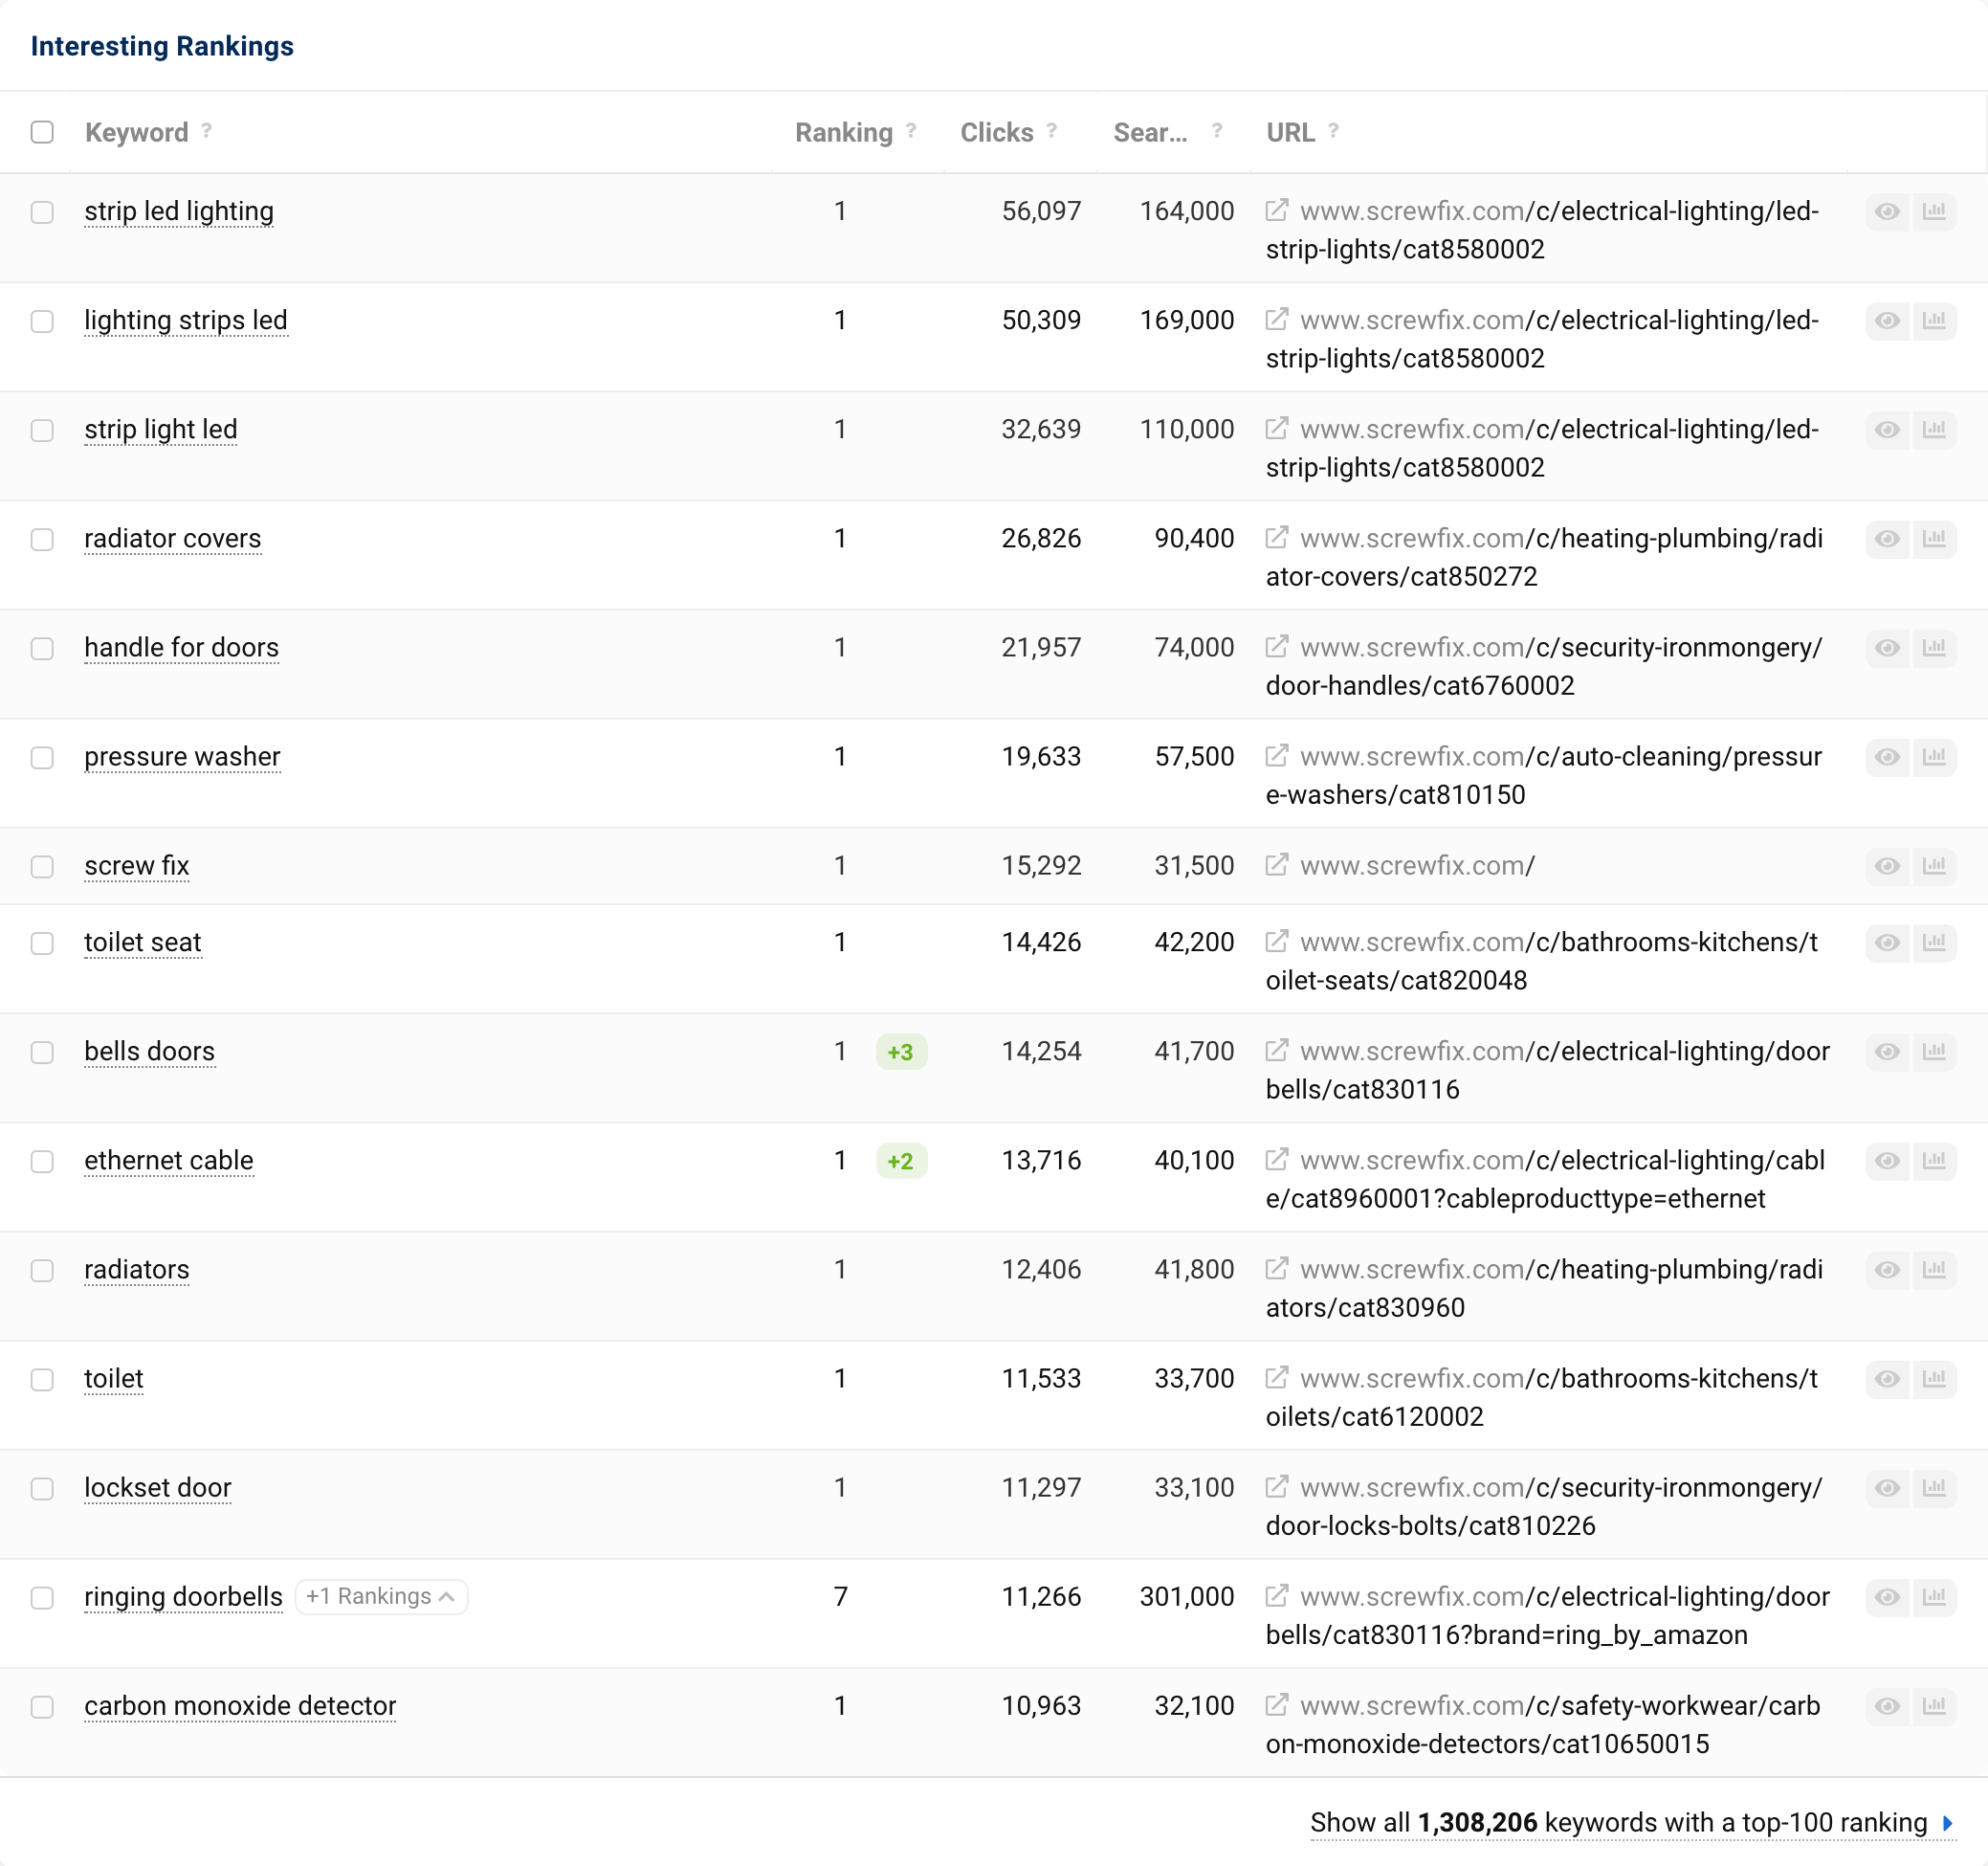
- Keyword: The keyword for which the domain ranks.
- Ranking: The highest position at which a URL of the examined domain ranks for this keyword. If there has been a change in ranking compared to the previously calculated value, it is displayed here (in green or red).
- Clicks: The estimated number of monthly clicks for this ranking.
- Search Volume: The number of monthly searches for this keyword in the selected country on Google.
- URL: The URL of the best ranking result.
- Keyword Preview: Click on this button to open more details about this keyword, for example a current SERP.
- Keyword History: Click on this button to go directly to the ranking history of the examined domain for this keyword.
By clicking on the respective column headers, you can sort the results in ascending or descending order. If you want to see all keywords for which this domain ranks, for example to begin your keyword research, you can simply click on the button “Show all keywords with a top-100 ranking” at the bottom of the table. In a separate article, we offer a general overview of what keyword research involves and ways to approach it.
Useful Features
Before getting into the individual elements in the overview, let’s focus on some general but very useful features that will make workflows with SISTRIX both easier and more efficient.
The Search Bar
The search bar is often the starting point to an analysis: Aside from a domain, you can also enter a subdomain, directory, URL or keywords. That way, domains can be segmented exactly as you need them. You can find a full breakdown in our FAQ article “Which requests can I start via the search bar?“.
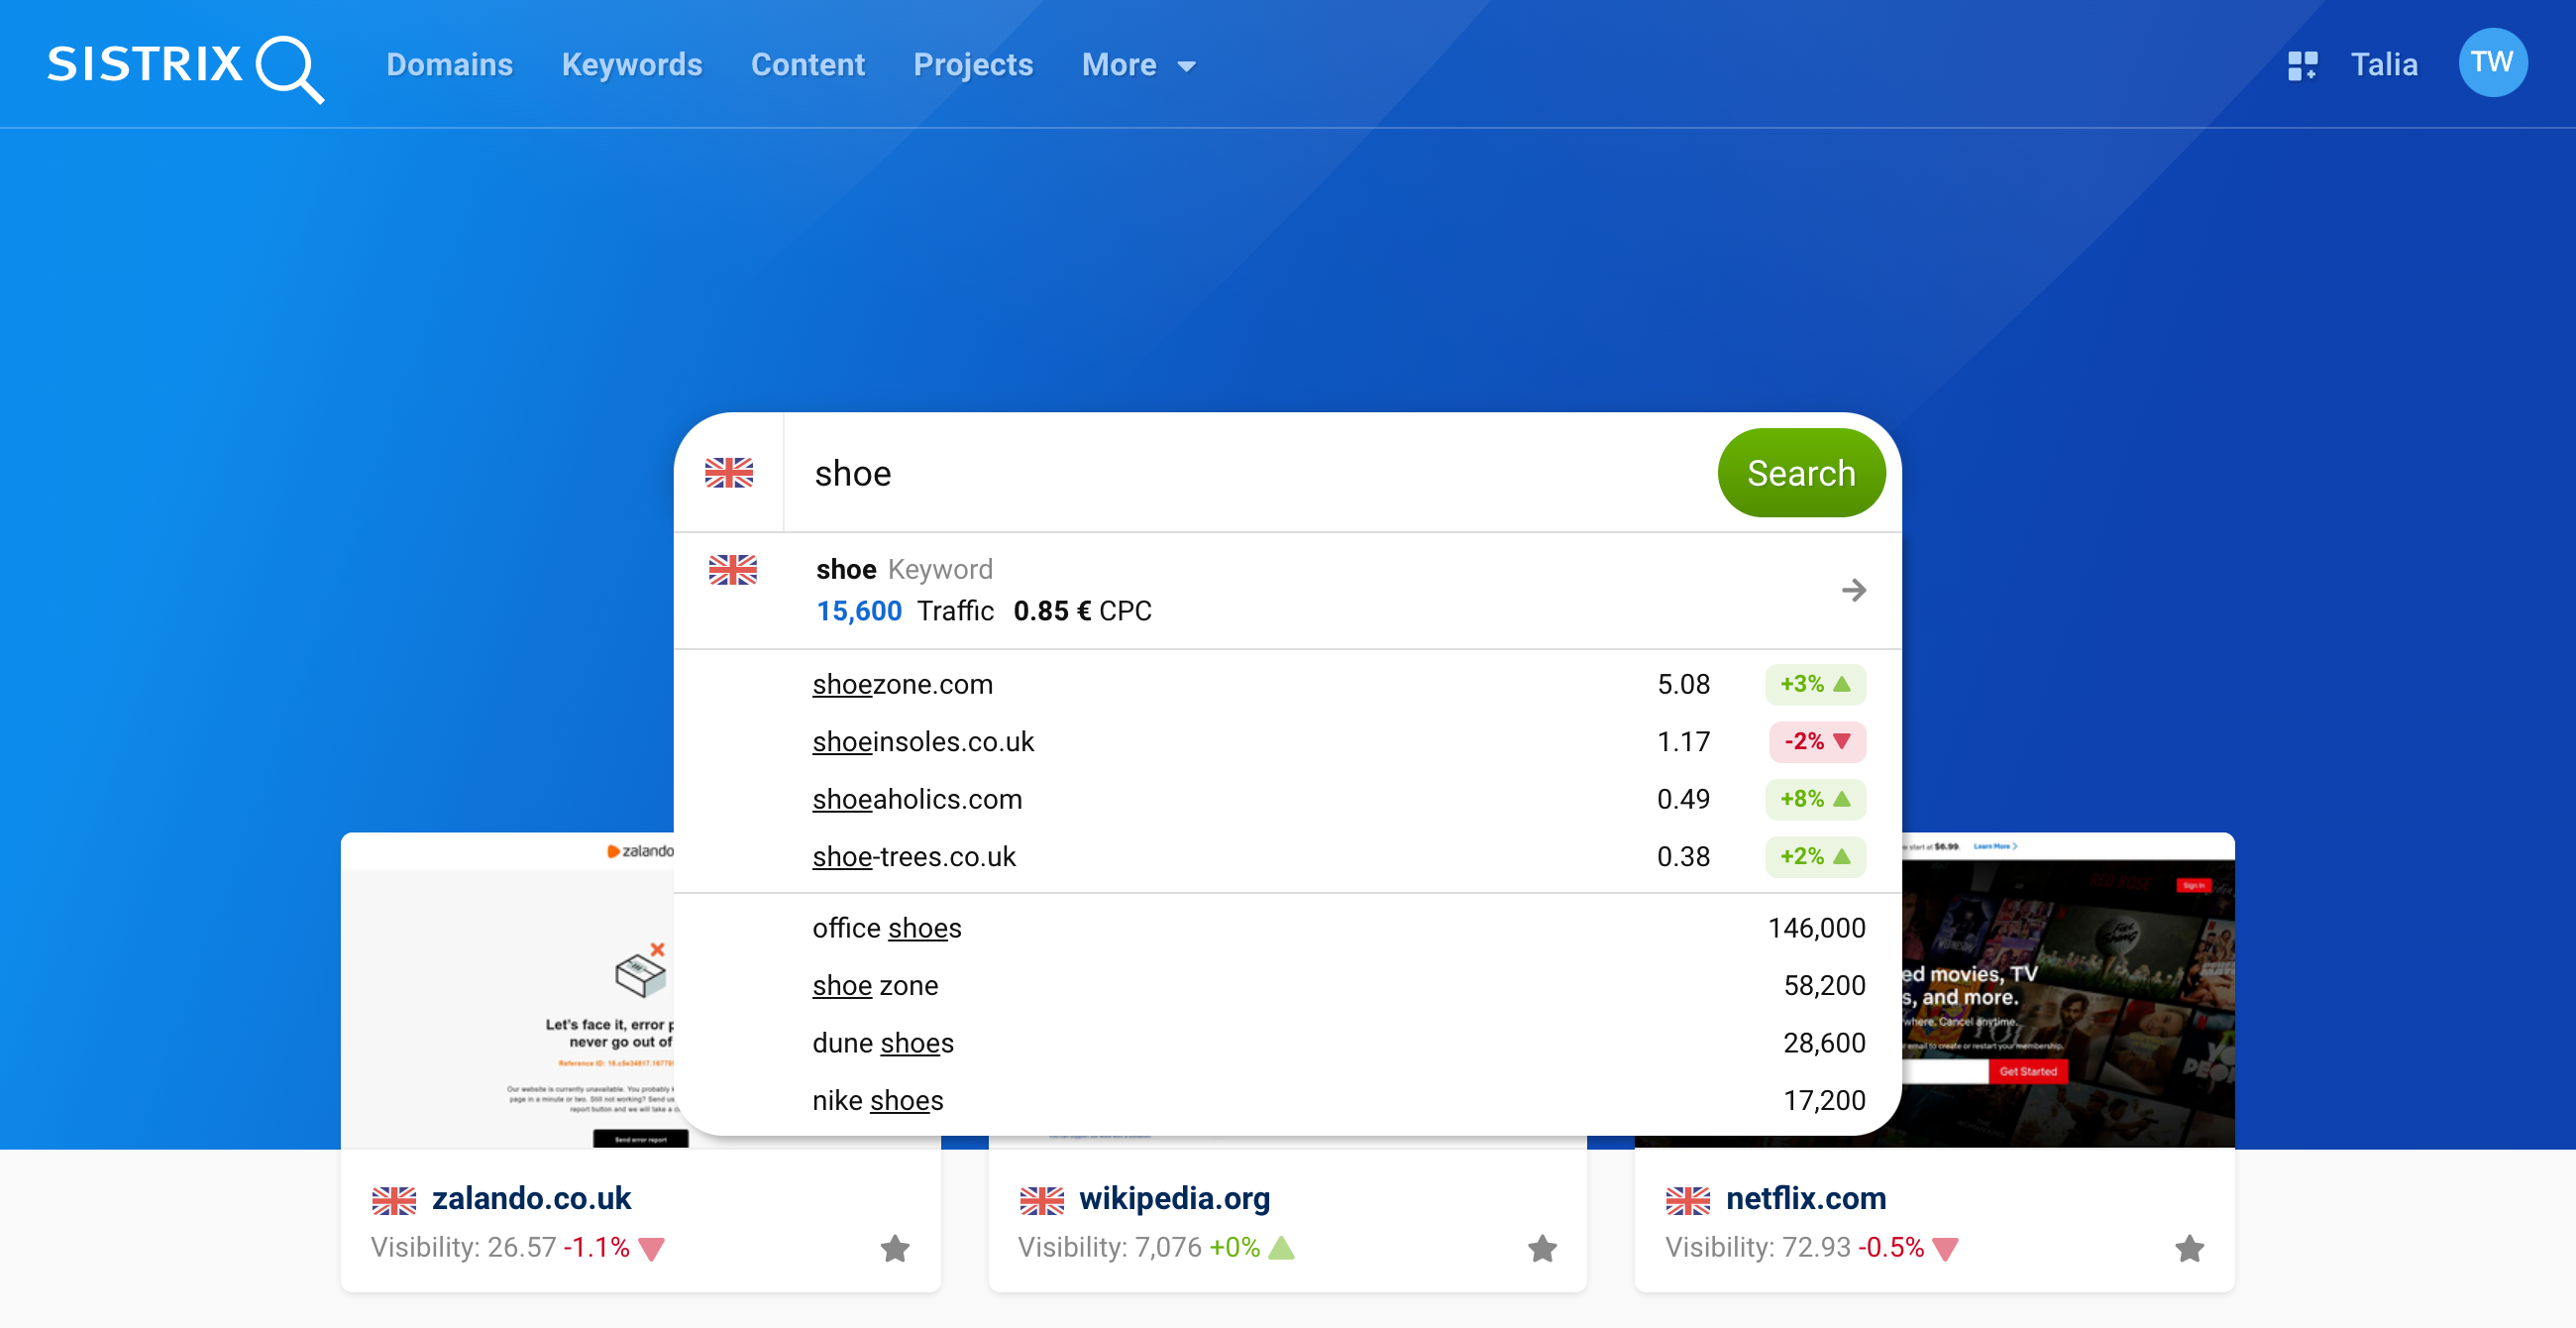
You can define the respective country index by clicking on the country flag icon at 1. If you enter a domain or a keyword into the search bar, some important key figures already appear as an overview 2. Below this, further keywords or domains matching your search are displayed 3.
Export and Shortlinks
The PDF export and shortlinks are further practical features. You can use them to present certain data to people who do not have their own SISTRIX account, for example.
For most analyses in SISTRIX, you will find the two buttons “Export” and “Share” at the top right of the page 1.
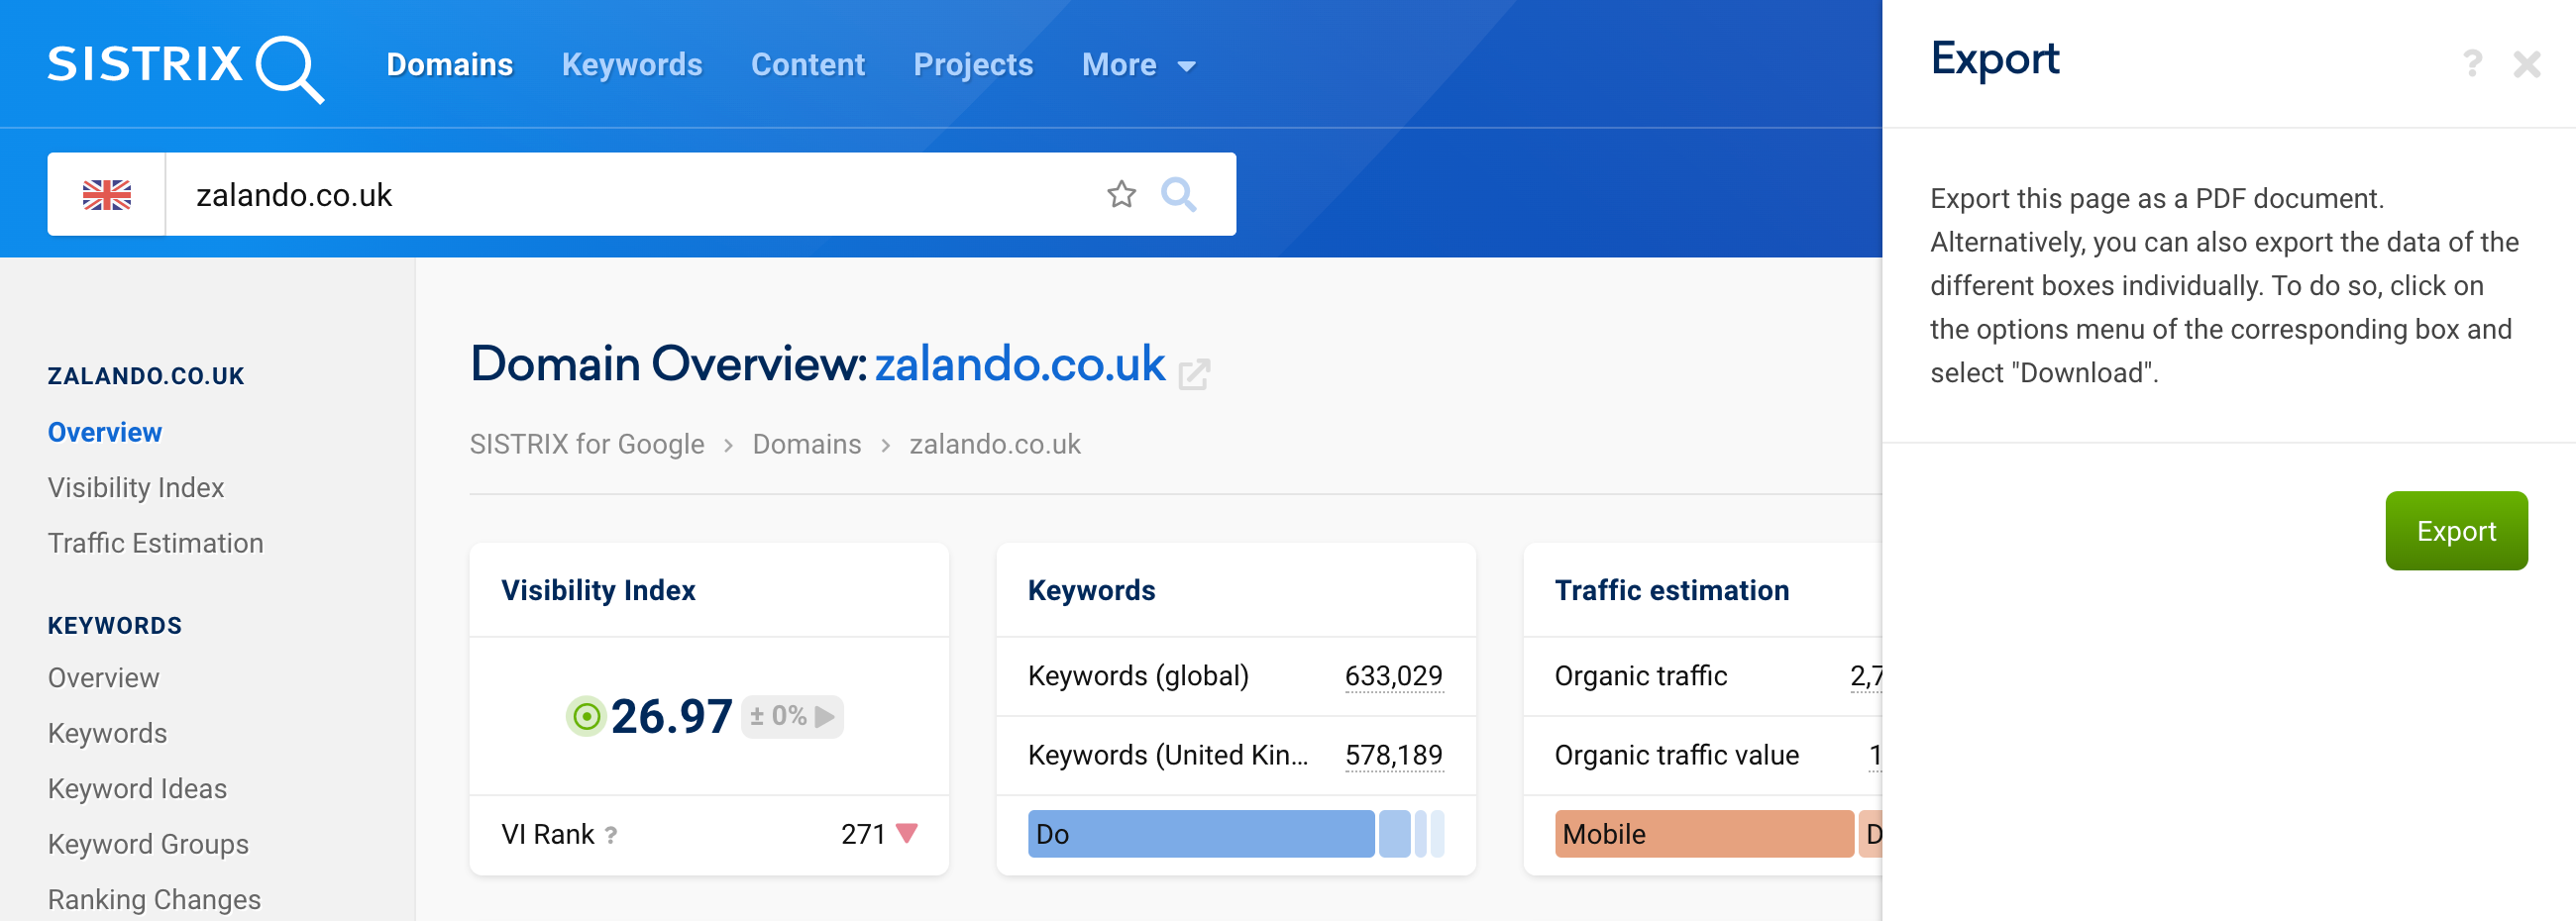
The “Export” button will allow you to export the page as a PDF document.
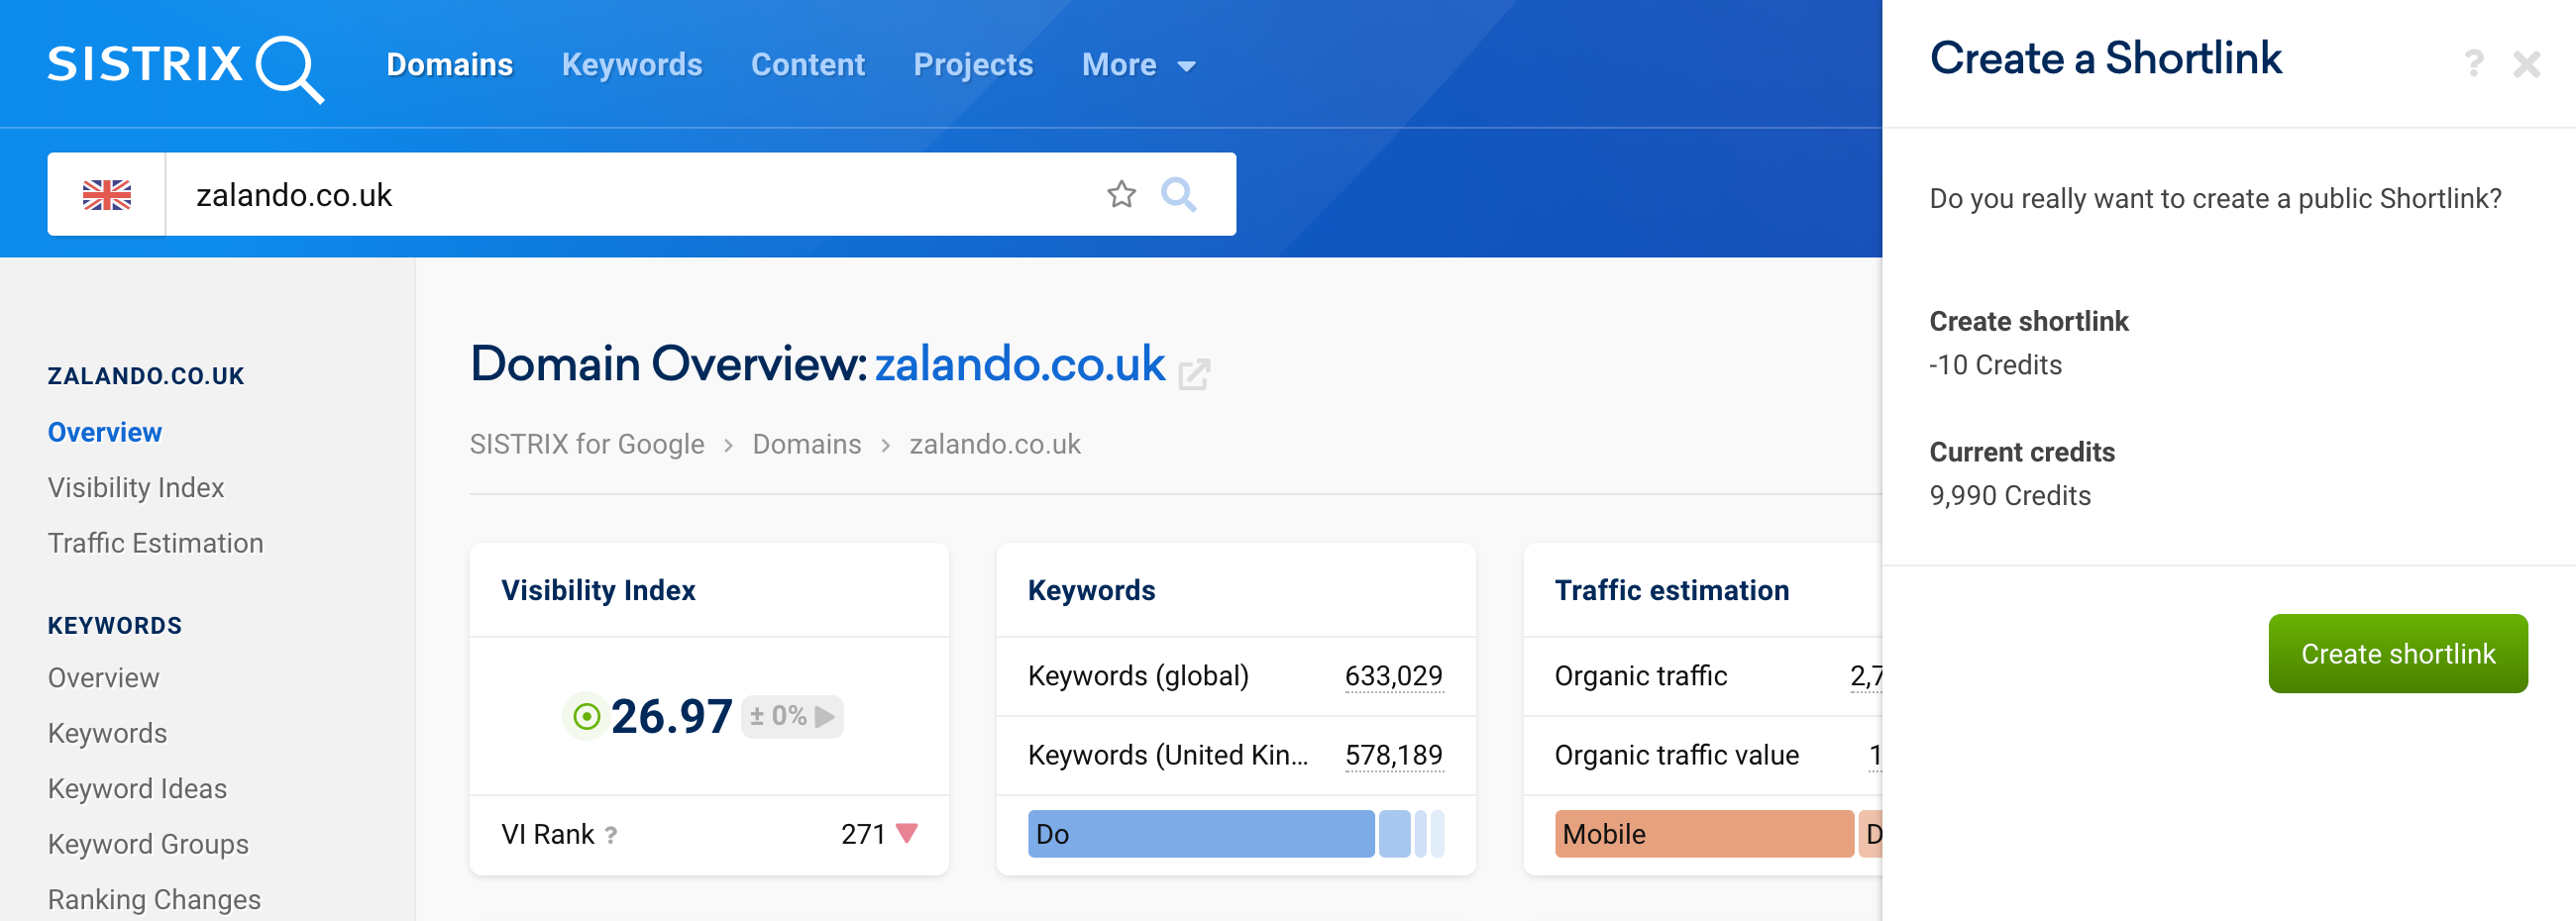
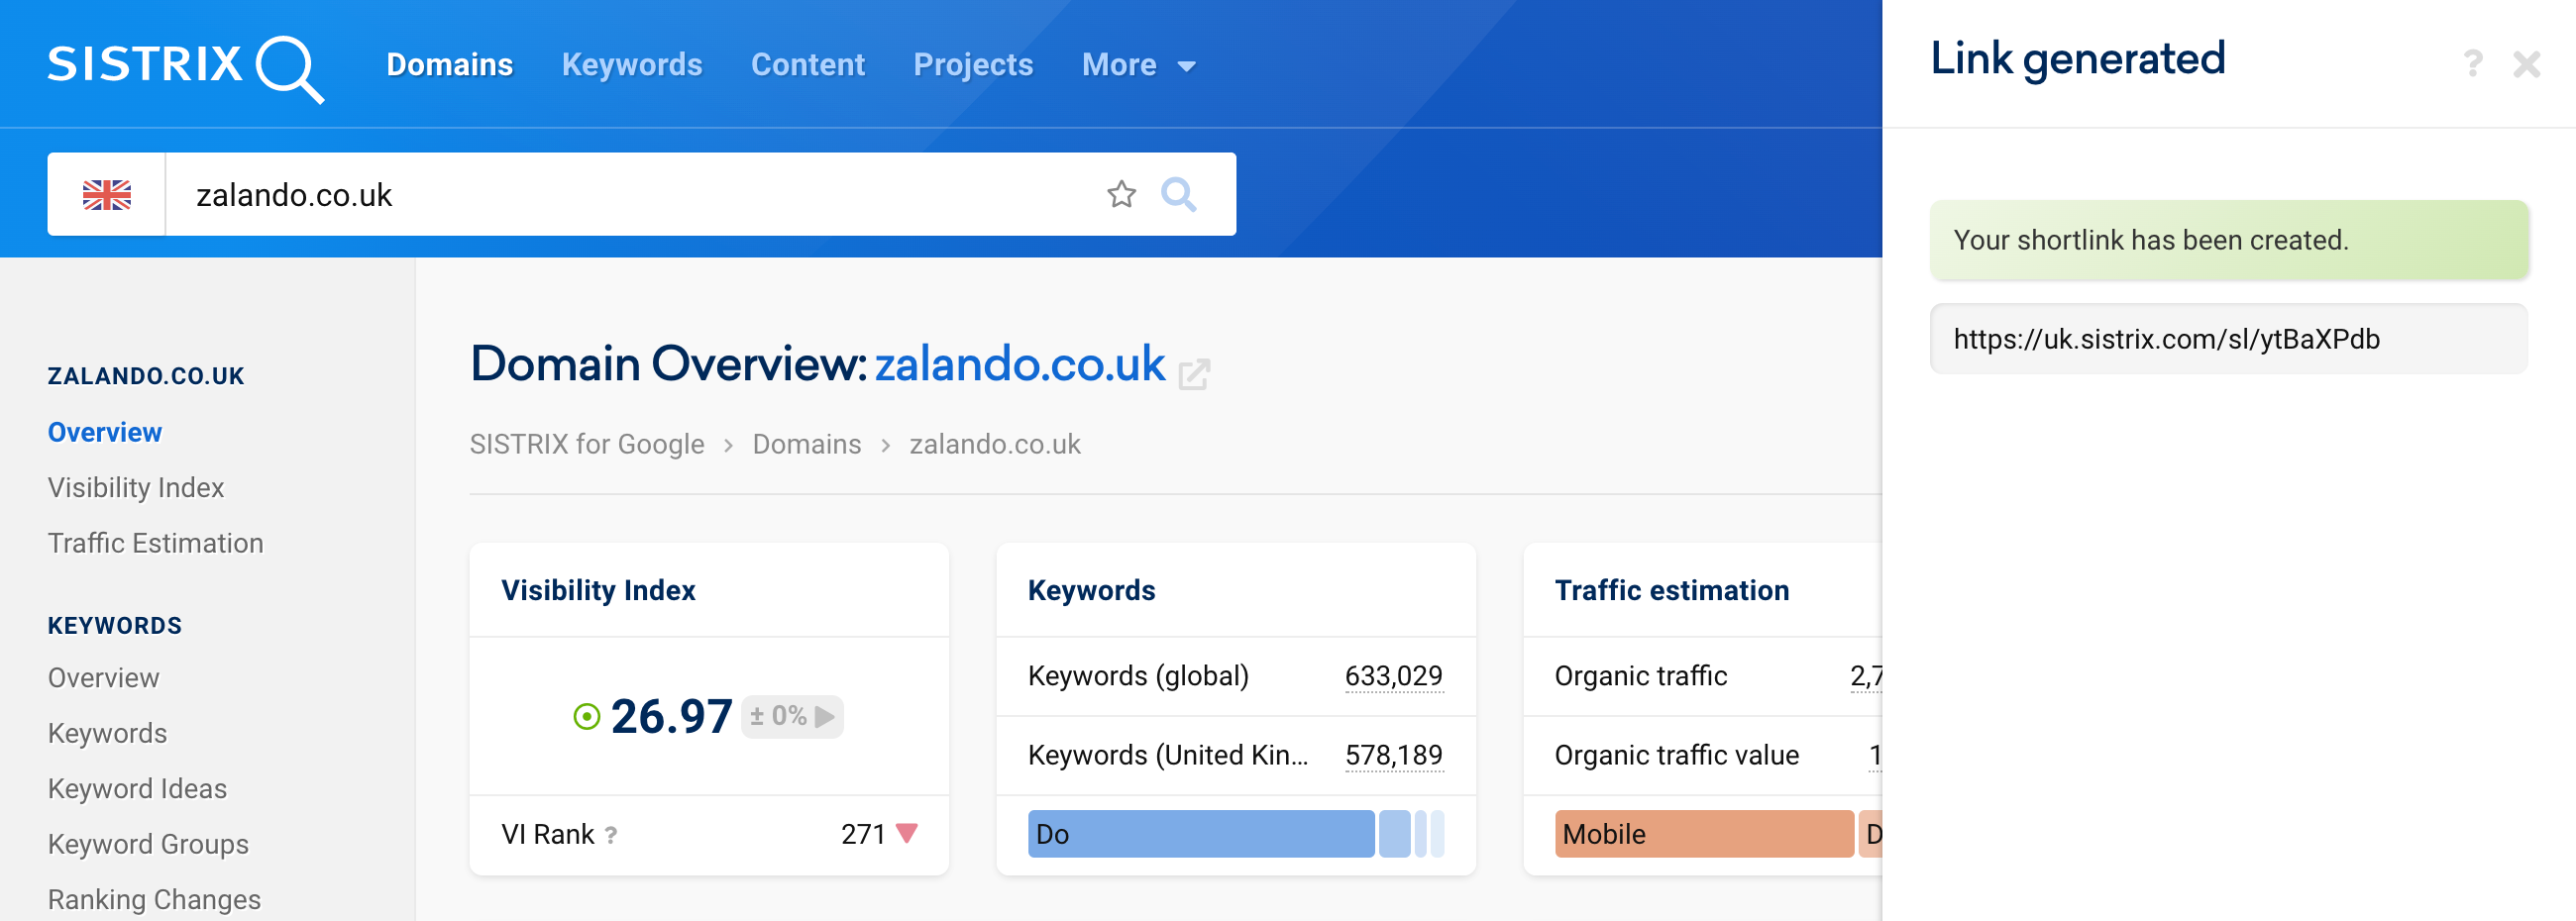
The second button, “Share”, allows you to create a shortlink. This can be shared on social media or among customers, for example.
Each shortlink costs 10 credits and stays active for 7 days. You can find more information about the SISTRIX credit system on the support page “Exports & Credits“.
The shortlinks allow anyone who does not have access to SISTRIX to see the data of the relevant view. With exports, you can also make certain data available in the long term.
Specific Data Box Options
Every data box in SISTRIX has a cogwheel icon in the top right corner.
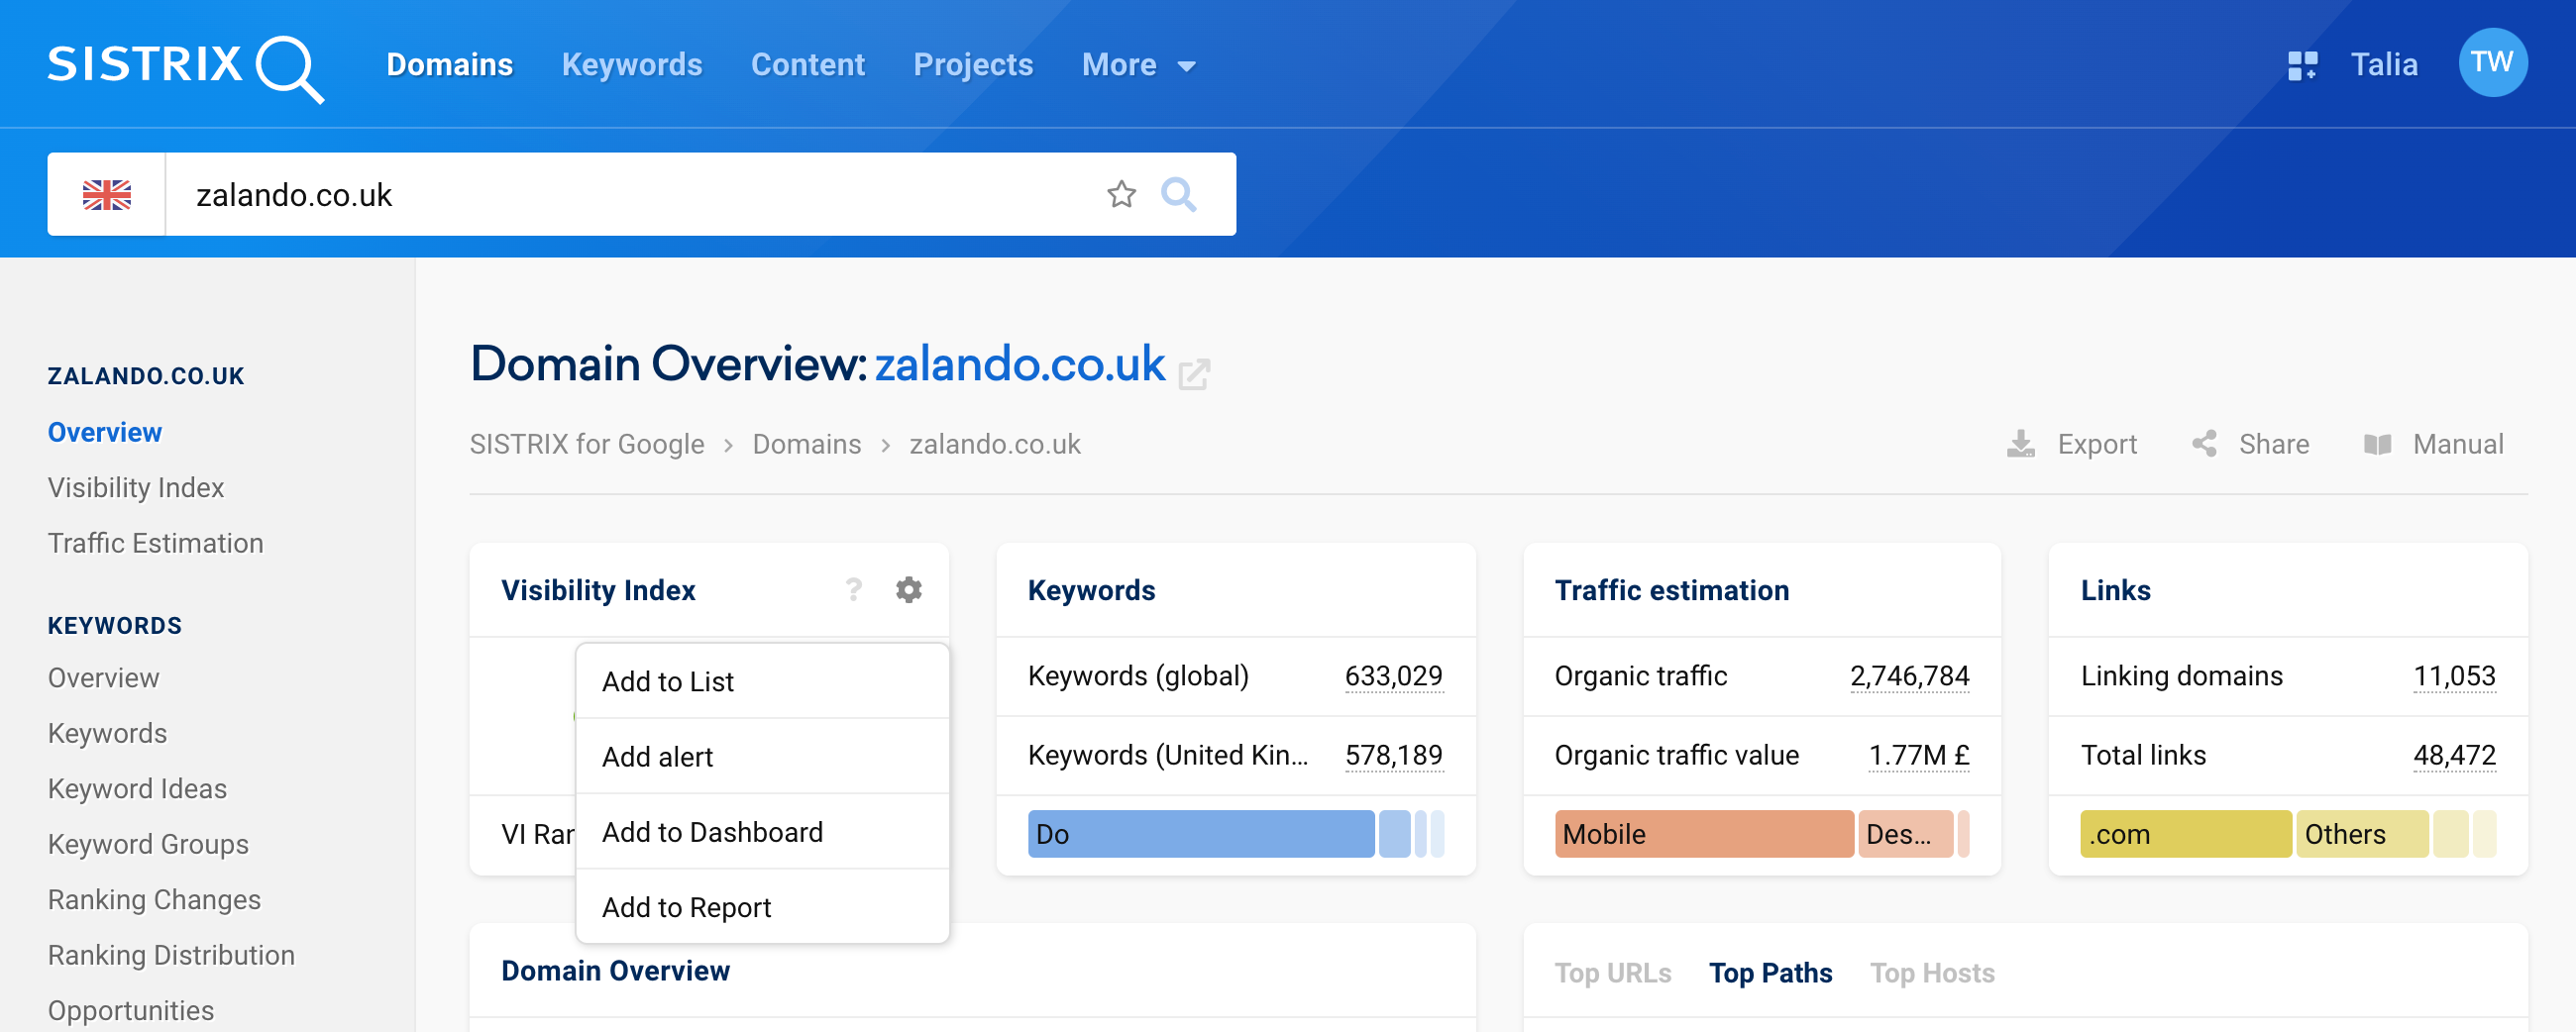
By clicking on this icon, all options available for this specific box appear. These include at least the options to add the data to a dashboard or report.
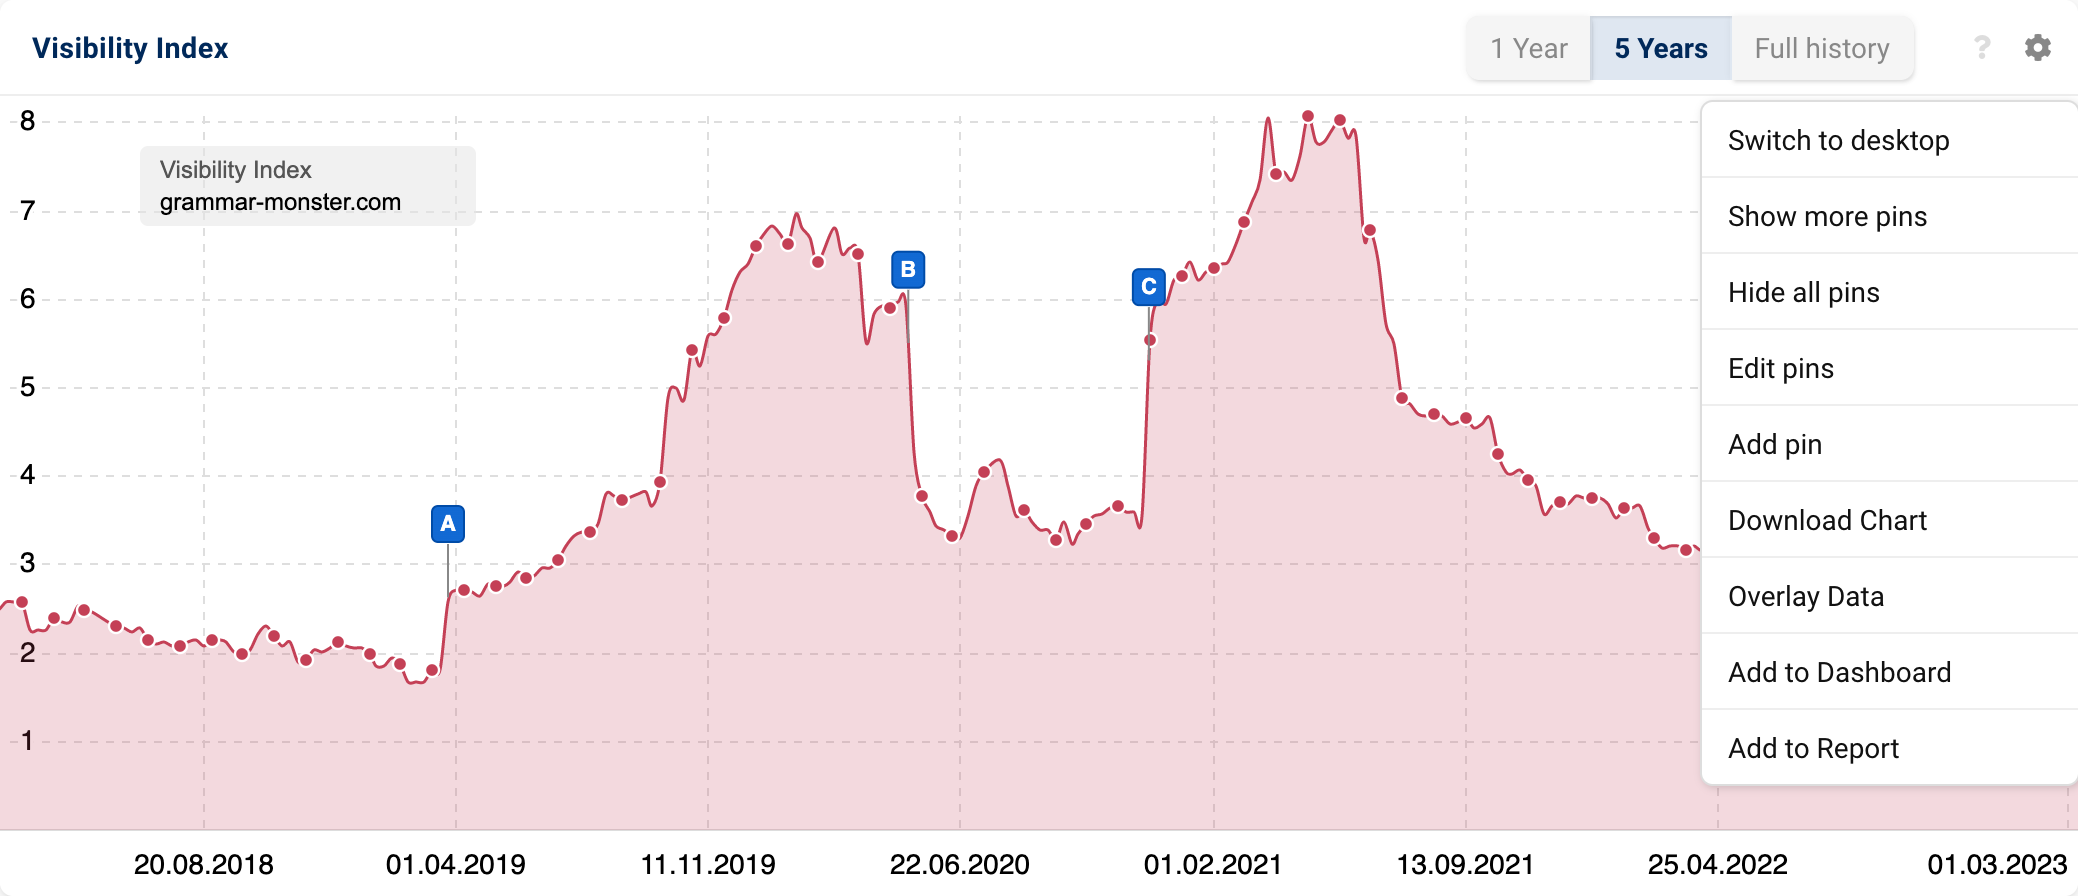
Depending on the data box, more options are also available, like in the box with the Visibility history of the domain.
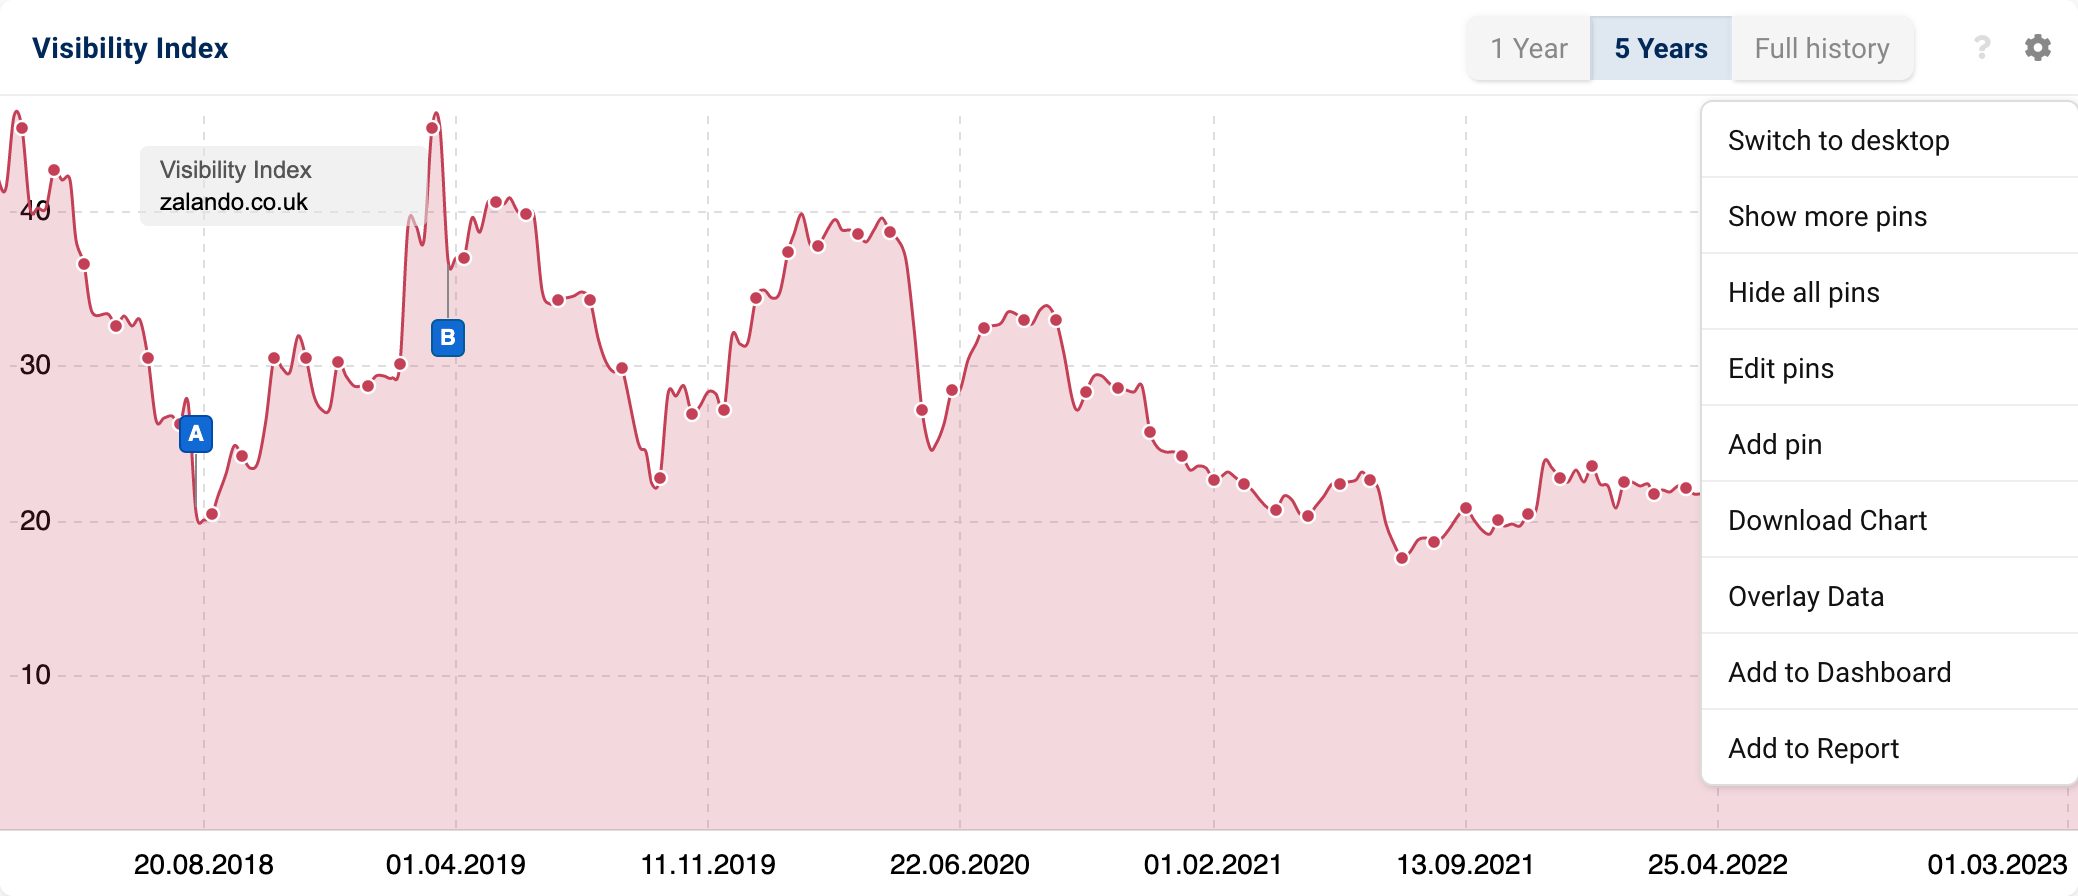
- Switch to desktop: By default, we display the mobile data, as significantly more people search Google on mobile devices than on desktop. However, you can also display the desktop data.
- Show more pins: SISTRIX automatically display pins in the graphs if the Visibility values change by more than 15 percent between two weeks, when Google officially confirms an update. Click on the button “Show more pins” to display all existing pins. Click on this option once more to hide the pins again.
- Hide all pins: This hides all the pins shown in the graph. This is useful, if you want to take screenshots, for example.
- Edit pins: You can choose which pins should be shown in the graph from a selection of all possible pins.
- Add pin: This option allows you to create your own event pin. This pin is only visible to your account. You can find further information in our tutorial “Document Developments with Event Pins“.
- Download Chart: You can export the contents of the graph here. The file formats PDF, PNG and CSV are available.
- Overlay Data: Compare the Visibility trends of different domains, hostnames or directories. You can find out more in this article.
- Add to Dashboard: Add this graph to a dashboard.
- Add to Report: Add this graph to a report.
Navigation Menu
When you are looking at the data for a specific domain (or host, etc.), you will see the navigation for the different features on the left side of the screen. Here you can access the different evaluations of the domain.
If you want to switch between the areas in SISTRIX, for example between domains and keywords, you can do so via the navigation at the top.
Help in the Toolbox
If you have questions about the data within SISTRIX, you have two options for answering these questions.
Every data box in SISTRIX contains a question mark in the top right corner 1. It appears when you move the mouse over the data box. Clicking on it opens the help text for the respective box.
Additionally, you can find a question mark button 2 at the bottom right on each subpage, which you can use to contact our support team directly.
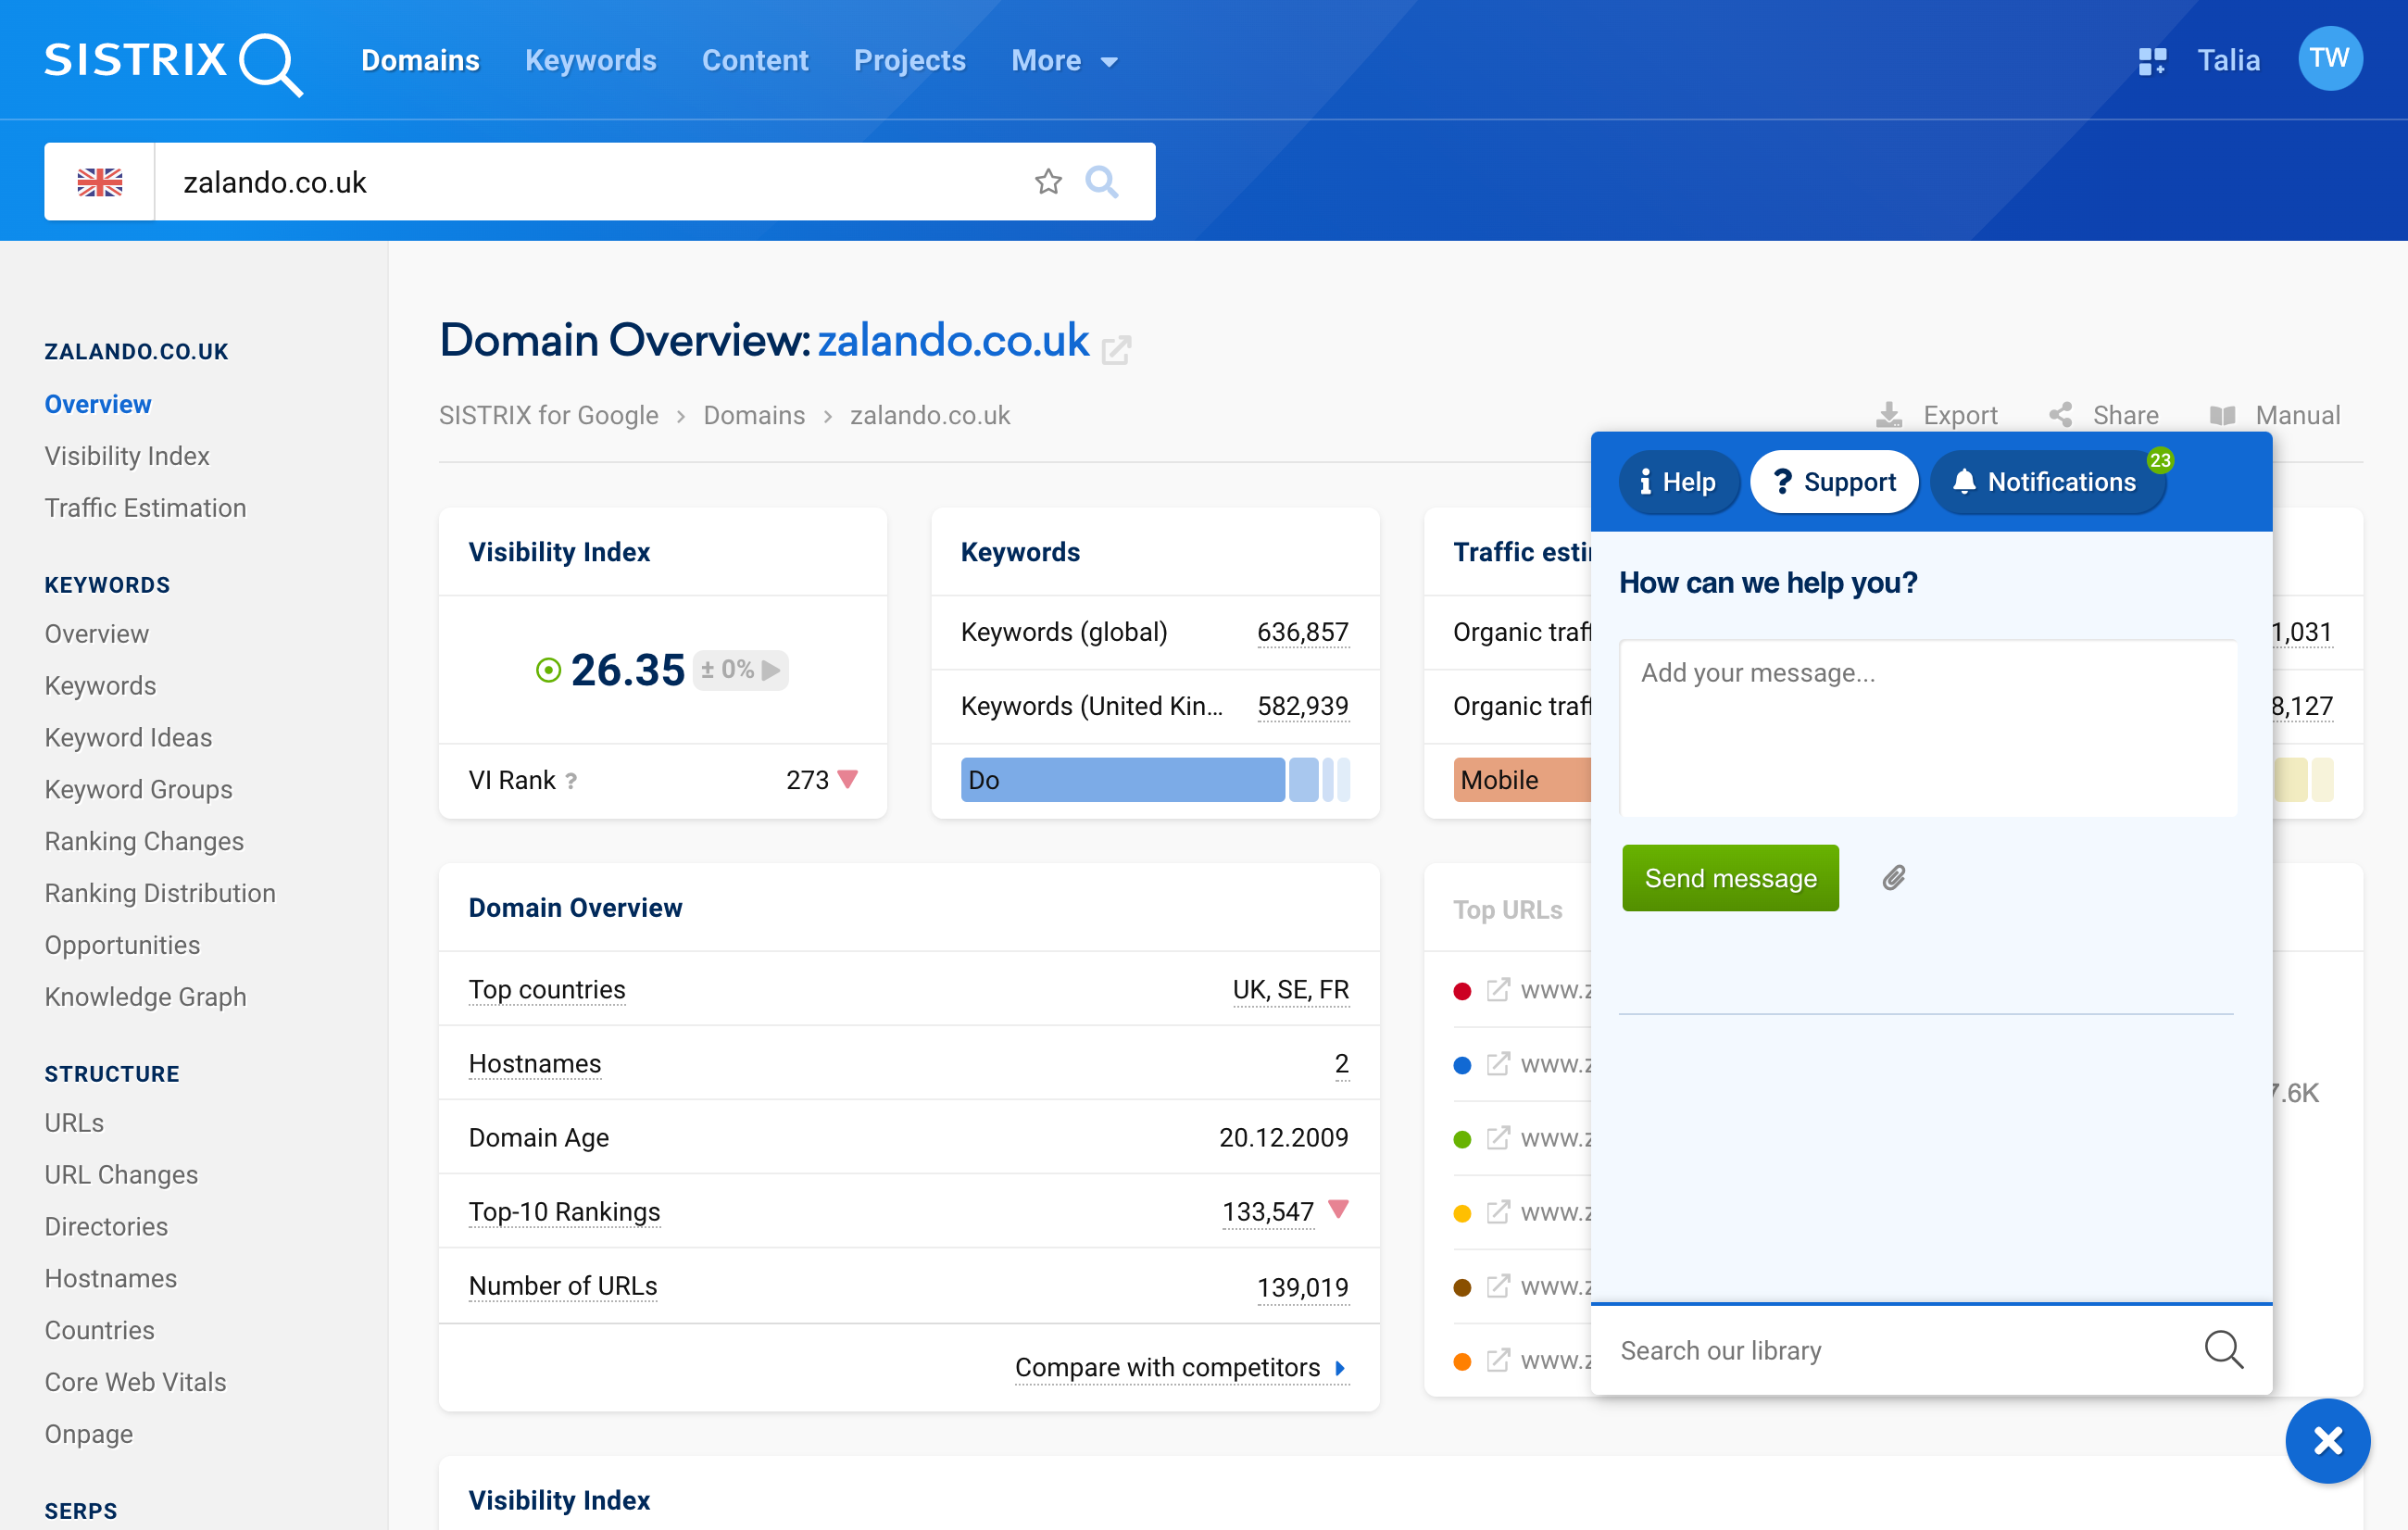
By clicking on the “Support” tab, you will find a chat window where you can write a message with your question to the support team.
Summary
The domain overview page is a fundamental part of gaining a good overview of the most important SEO indicators for a domain, host, directory or URL.
Thanks to this page you can keep an eye on your domain and immediately identify possible SEO problems, as well as analyse your competitors in terms of which content they rank well for, how their Visibility on Google is and where they may have weak points. You can then use these insights for your own website.