
Analysing hostname-level visibility can help you learn a lot about a business and it online activities. You can use this information to find out which strategies work (or don’t work).
Just as you can analyse directories in detail – with their own visibility data and ranking keywords – you can also analyse the hostnames of a domain. The history up to 2008 is available for all data, so you can get started right away.
In this tutorial, we will show you how to analyse a domain at the hostname level.
Where can I find the hostname view?
First things first: You can access the overview page of a host in several ways.
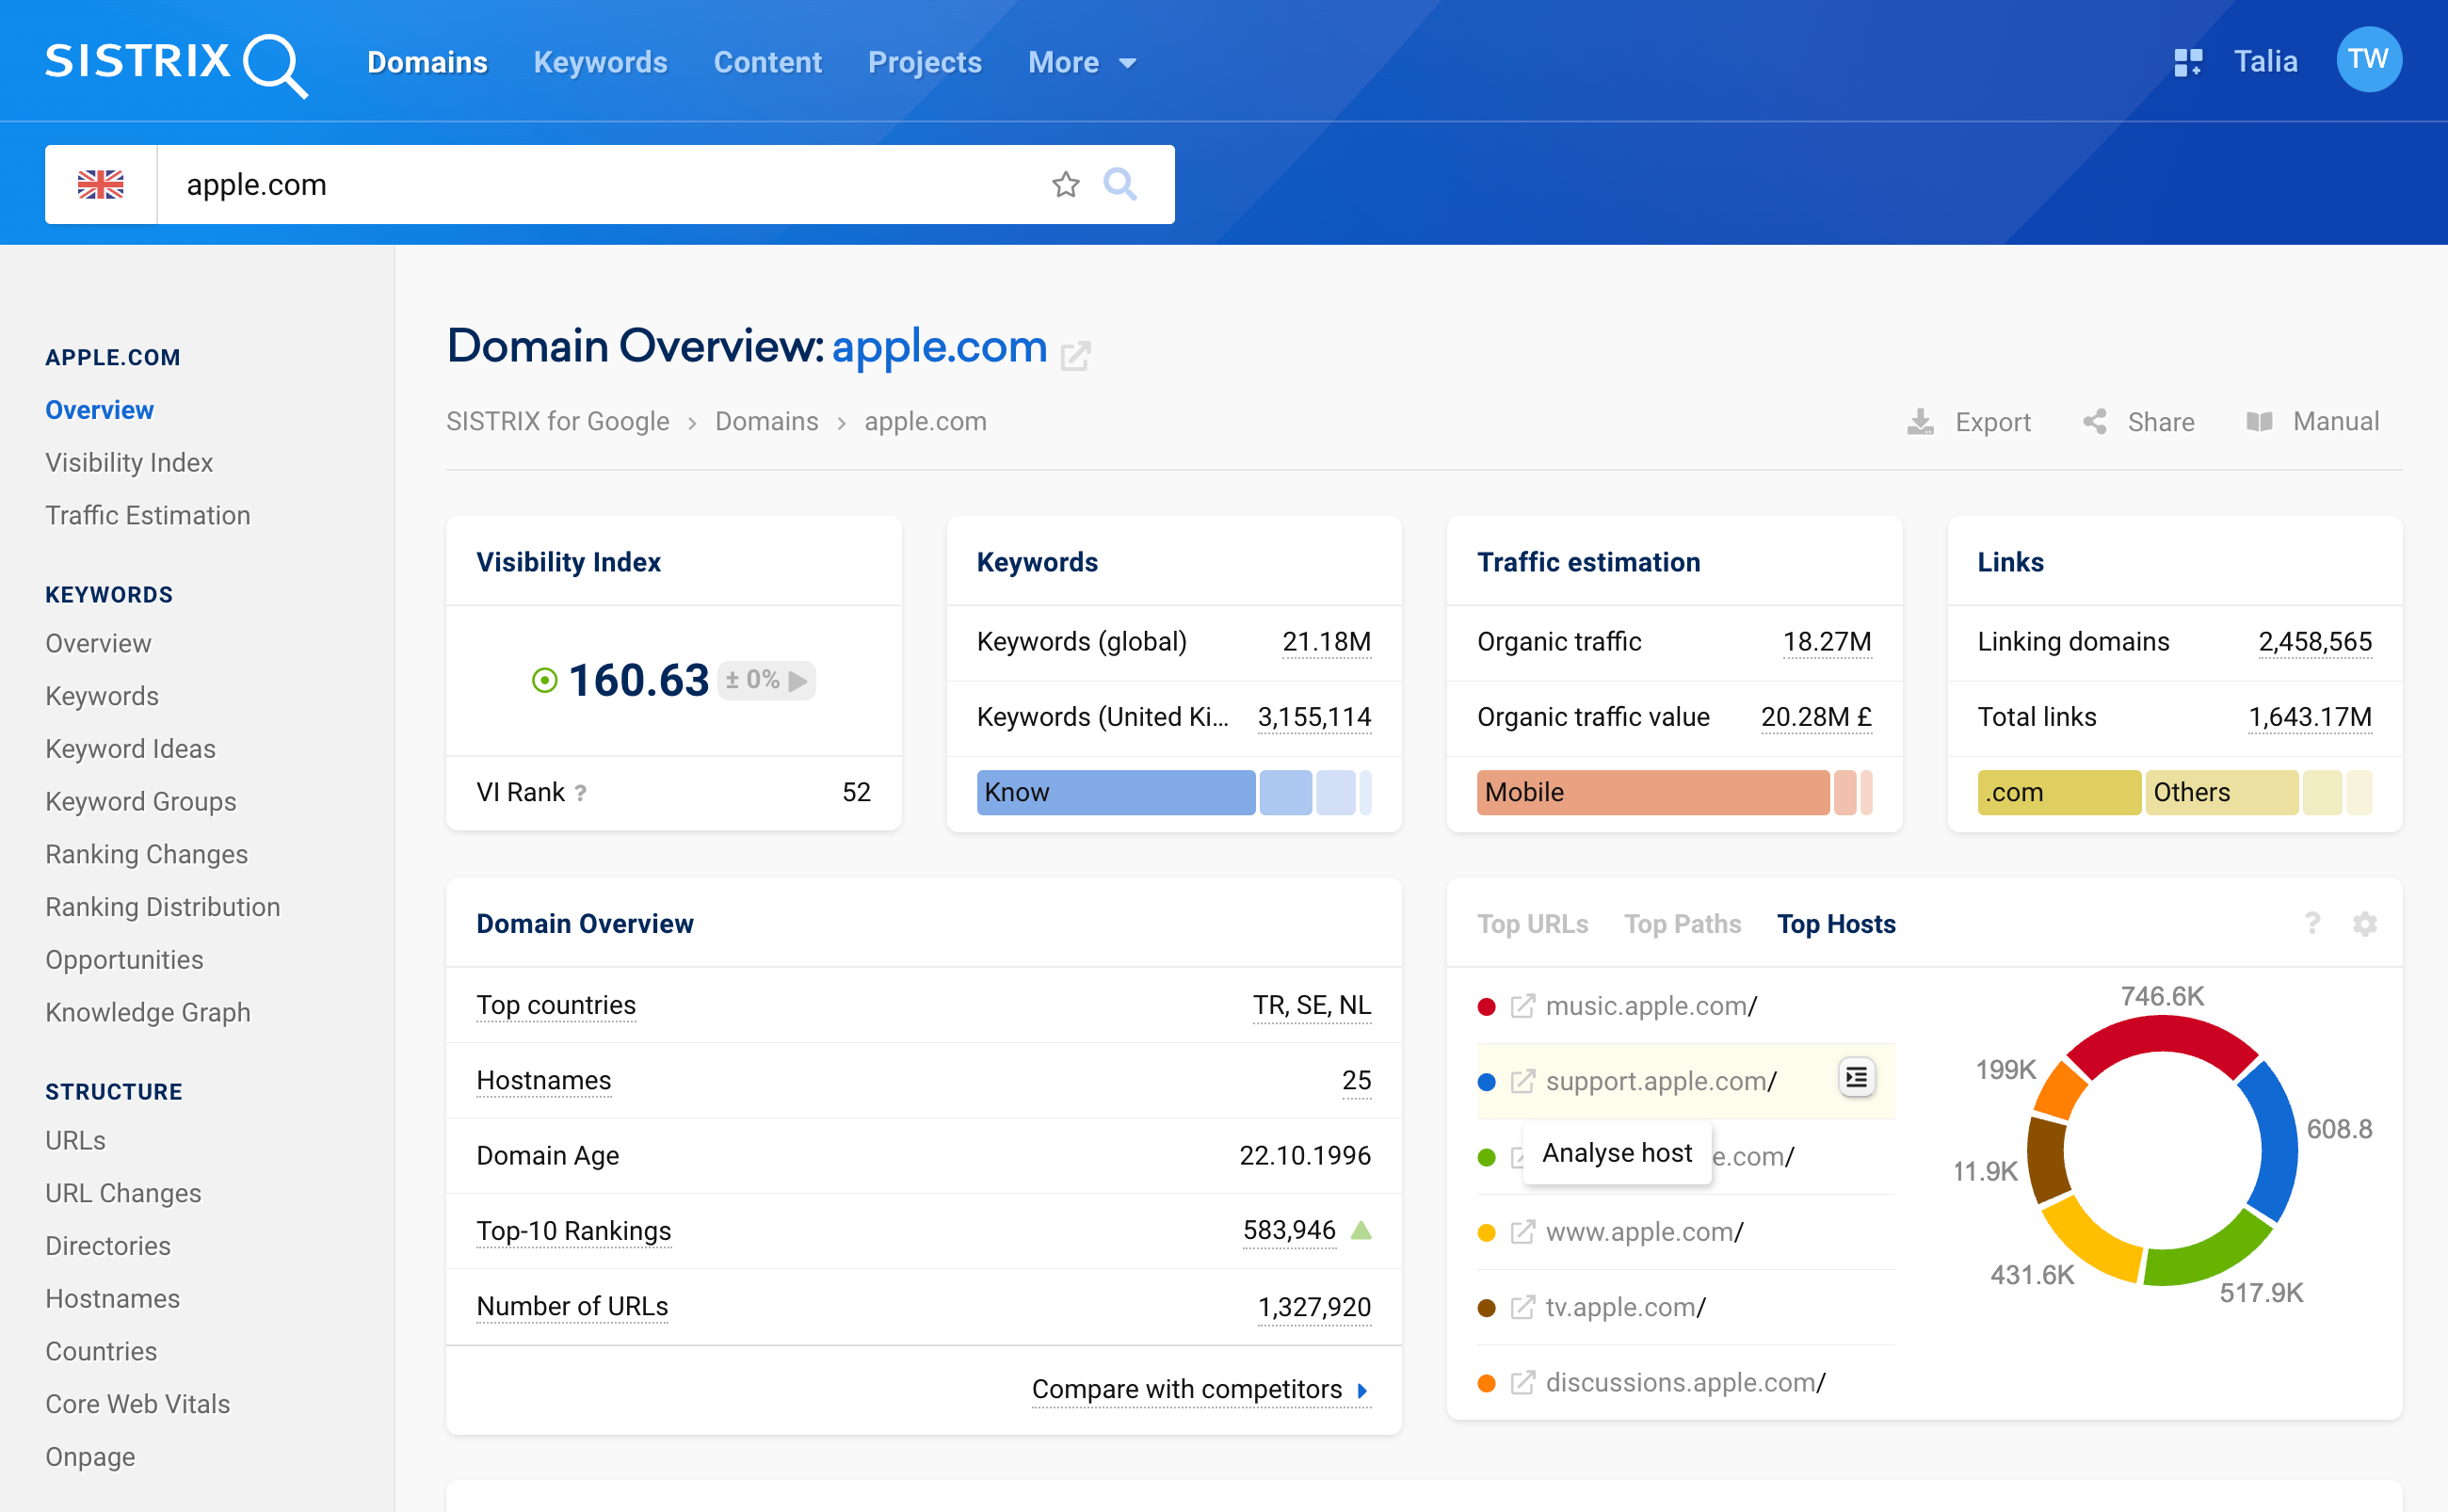
On the overview page of a domain, you will find a data box on the right with the top URLs, the top directories and the top hosts of this domain 1. If you click on a hostname there 2, it will lead you directly to the host overview.
If you are not necessarily interested in the six top hosts, but would like to get an overview of the hosts of a domain instead, click on “Hostnames” 3 under the section “Structure” in the navigation on the left-hand side. There you can also simply click on one of the hosts.
You can also directly access a host from any data table in SISTRIX.
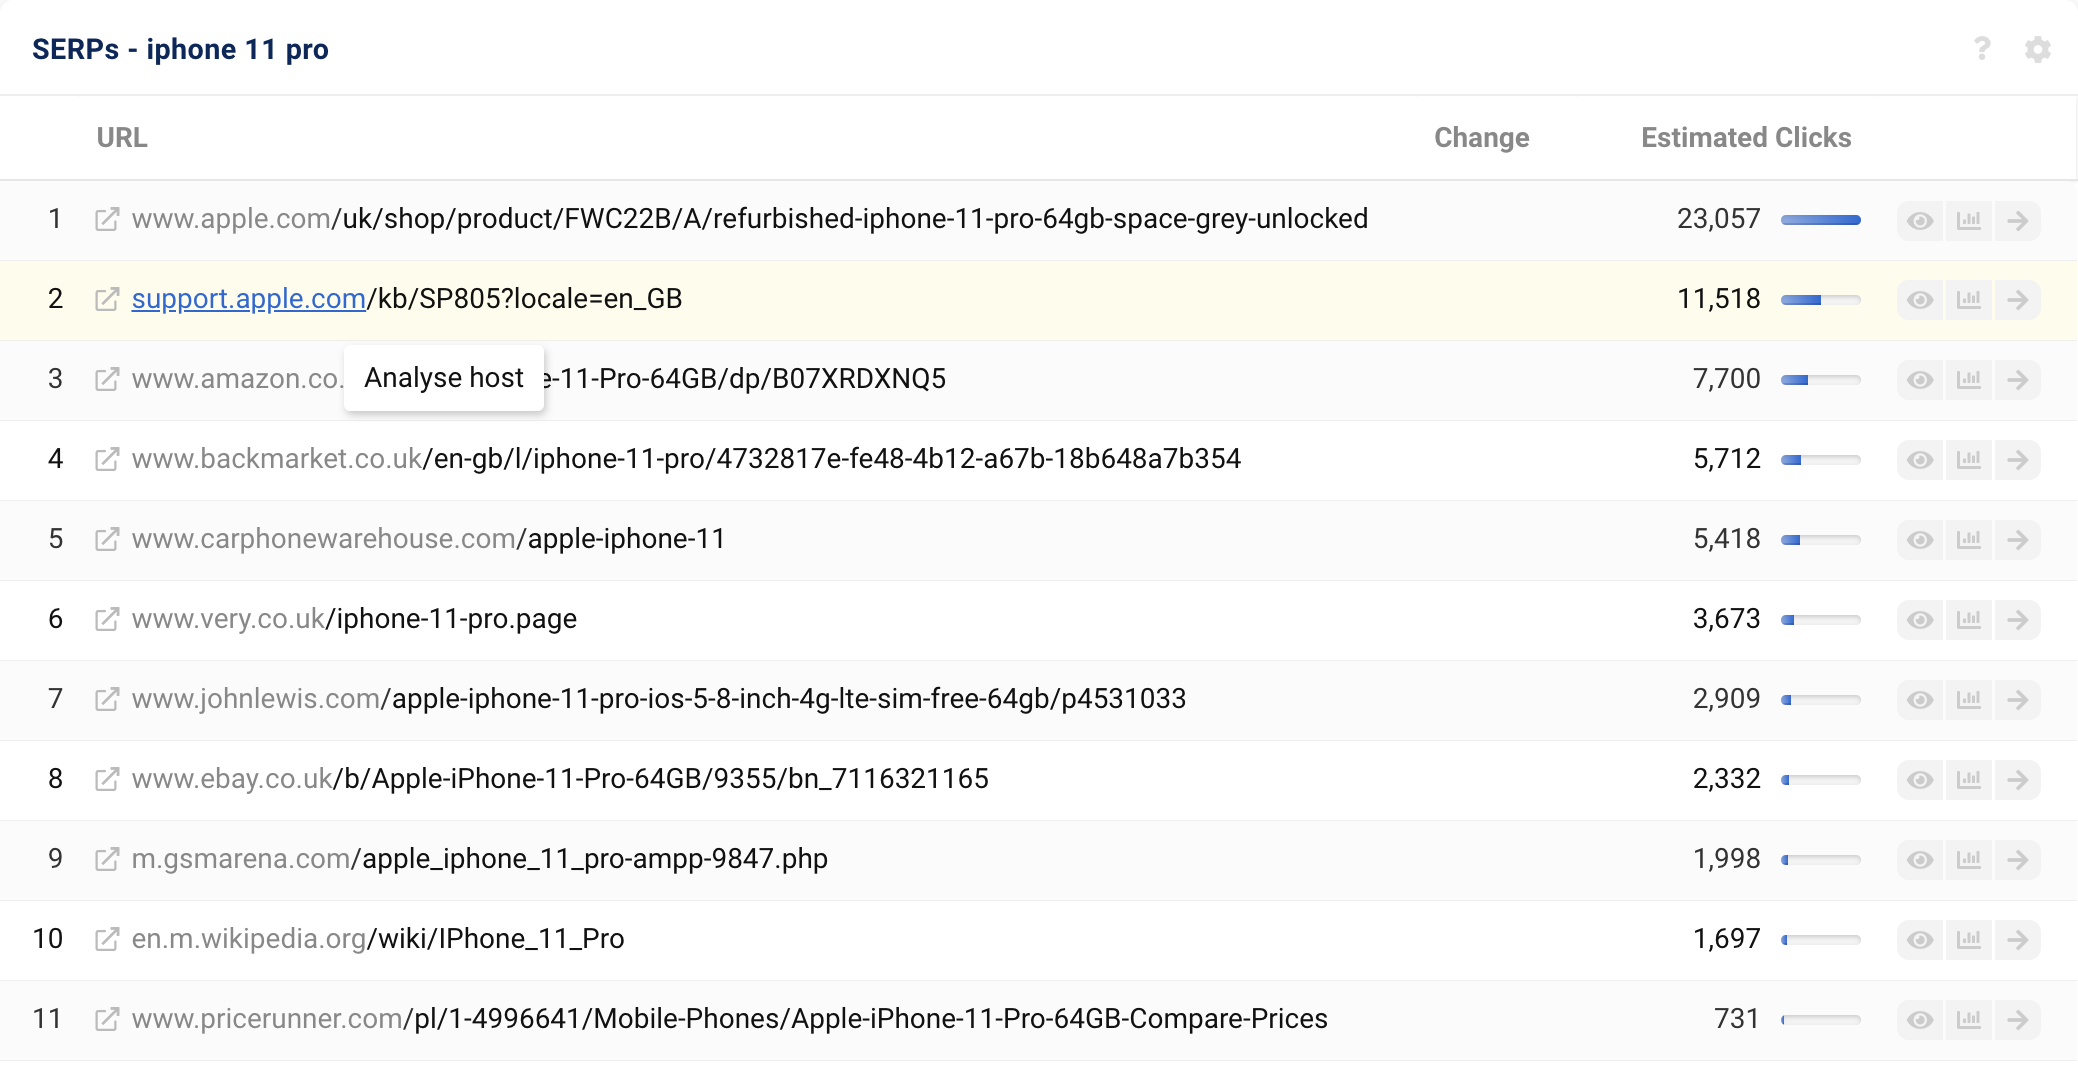
To do this, hover the mouse over the first part of a URL until the box “Analyse host” appears 4. With just one click, you will be taken directly to the host overview.
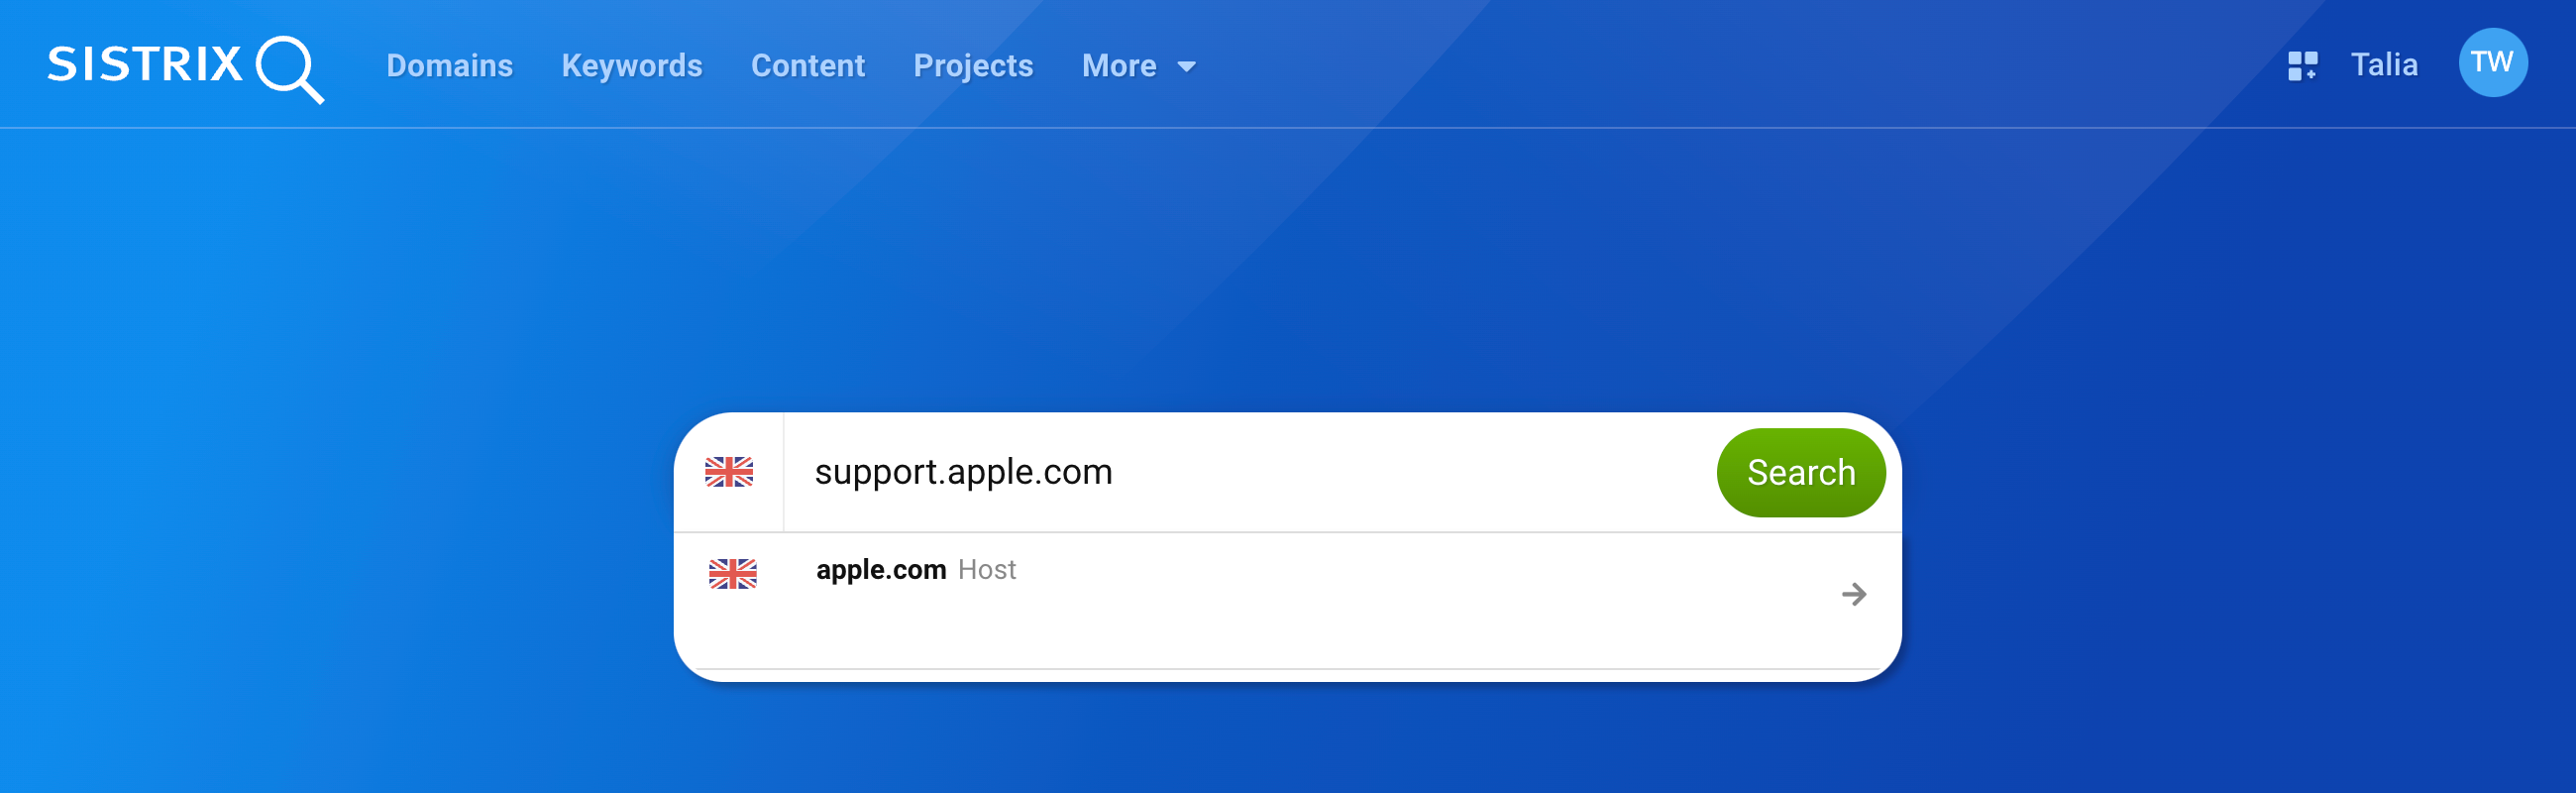
Of course, you can also simply enter a hostname into the SISTRIX search bar.
Examine the Hostnames of a Domain
If you access the hosts of a domain via the item “Hostnames” in the navigation on the left side, you will receive an overview of both the currently most successful hostnames of the domain and possible previously successful hosts.
By default, the mobile data is displayed, but you can change this via the “Options” button at the top.
Move the mouse over the visibility history of the hosts to see the visibility data of the strongest hosts at specific points in time. We always save the data point from Monday, so you have access to the data history of weekly updated data.
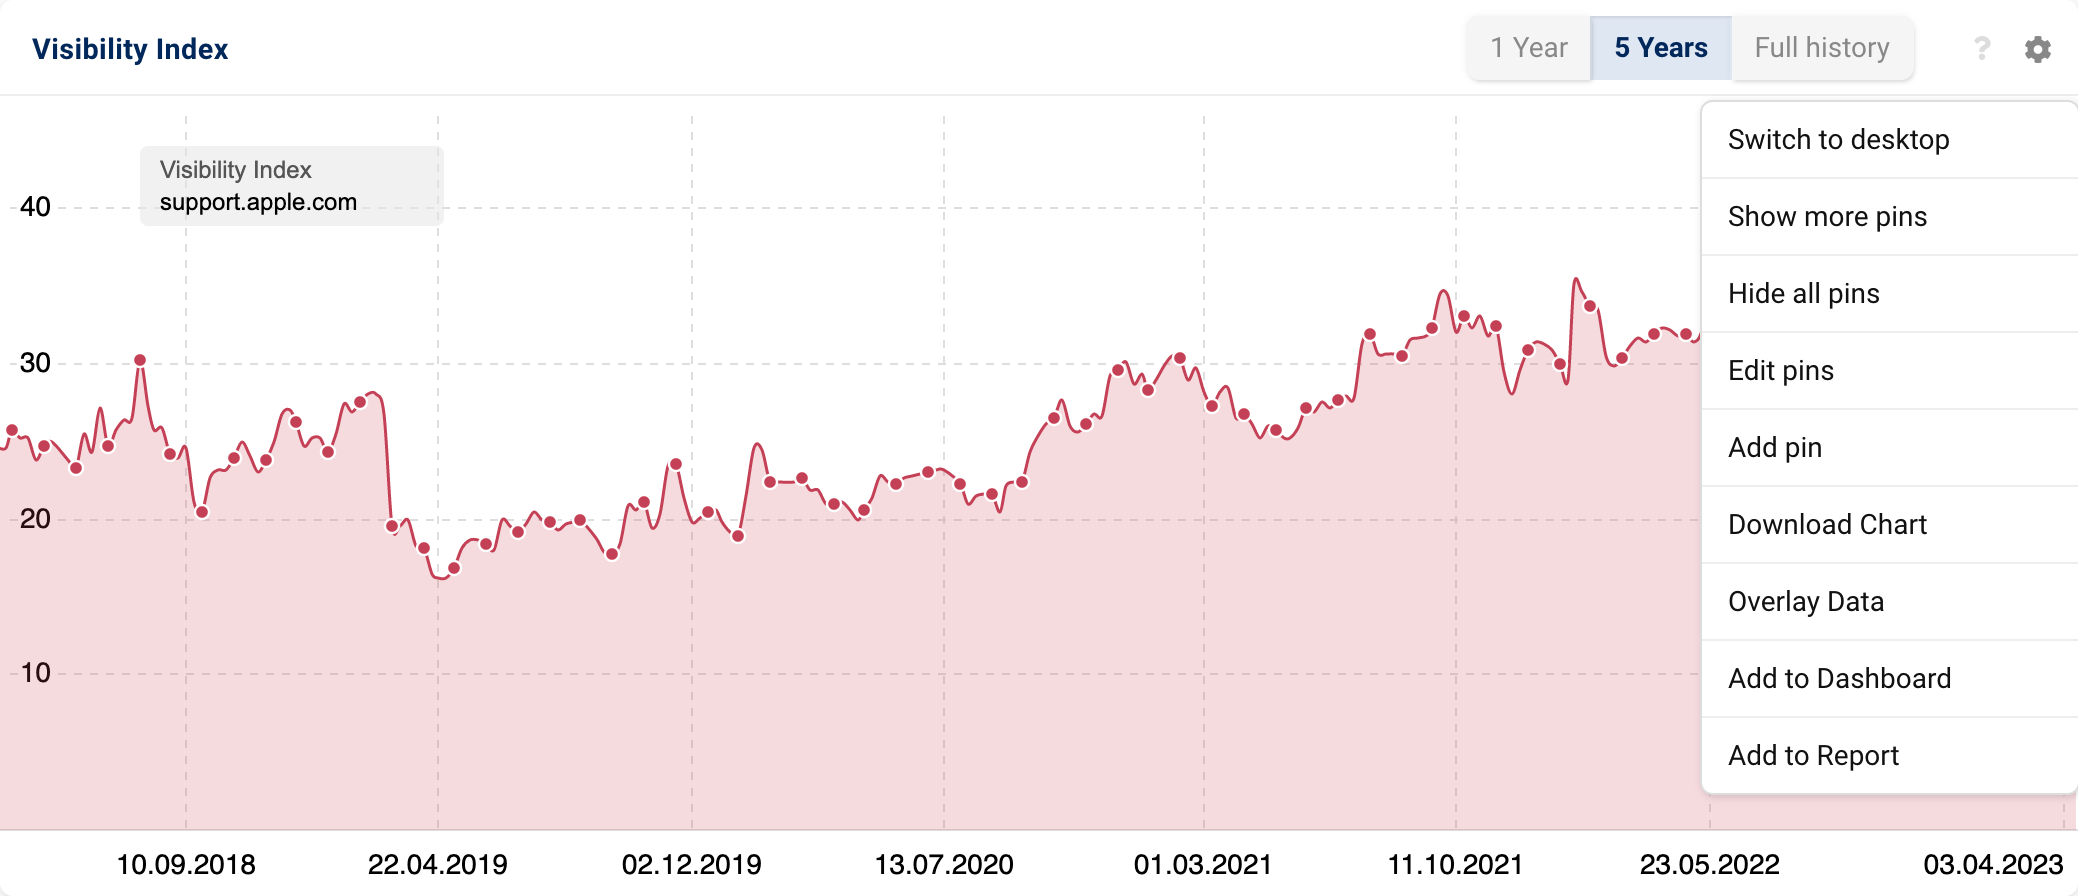
If you want to compare hosts other than the strongest ones, open the box options via the cogwheel at the top right and click on “Overlay Data” 1. There you can enter the hostnames that you want to compare (of course also hosts from different domains).
You can find a complete overview of all hosts of the domain in the table below the visibility history.
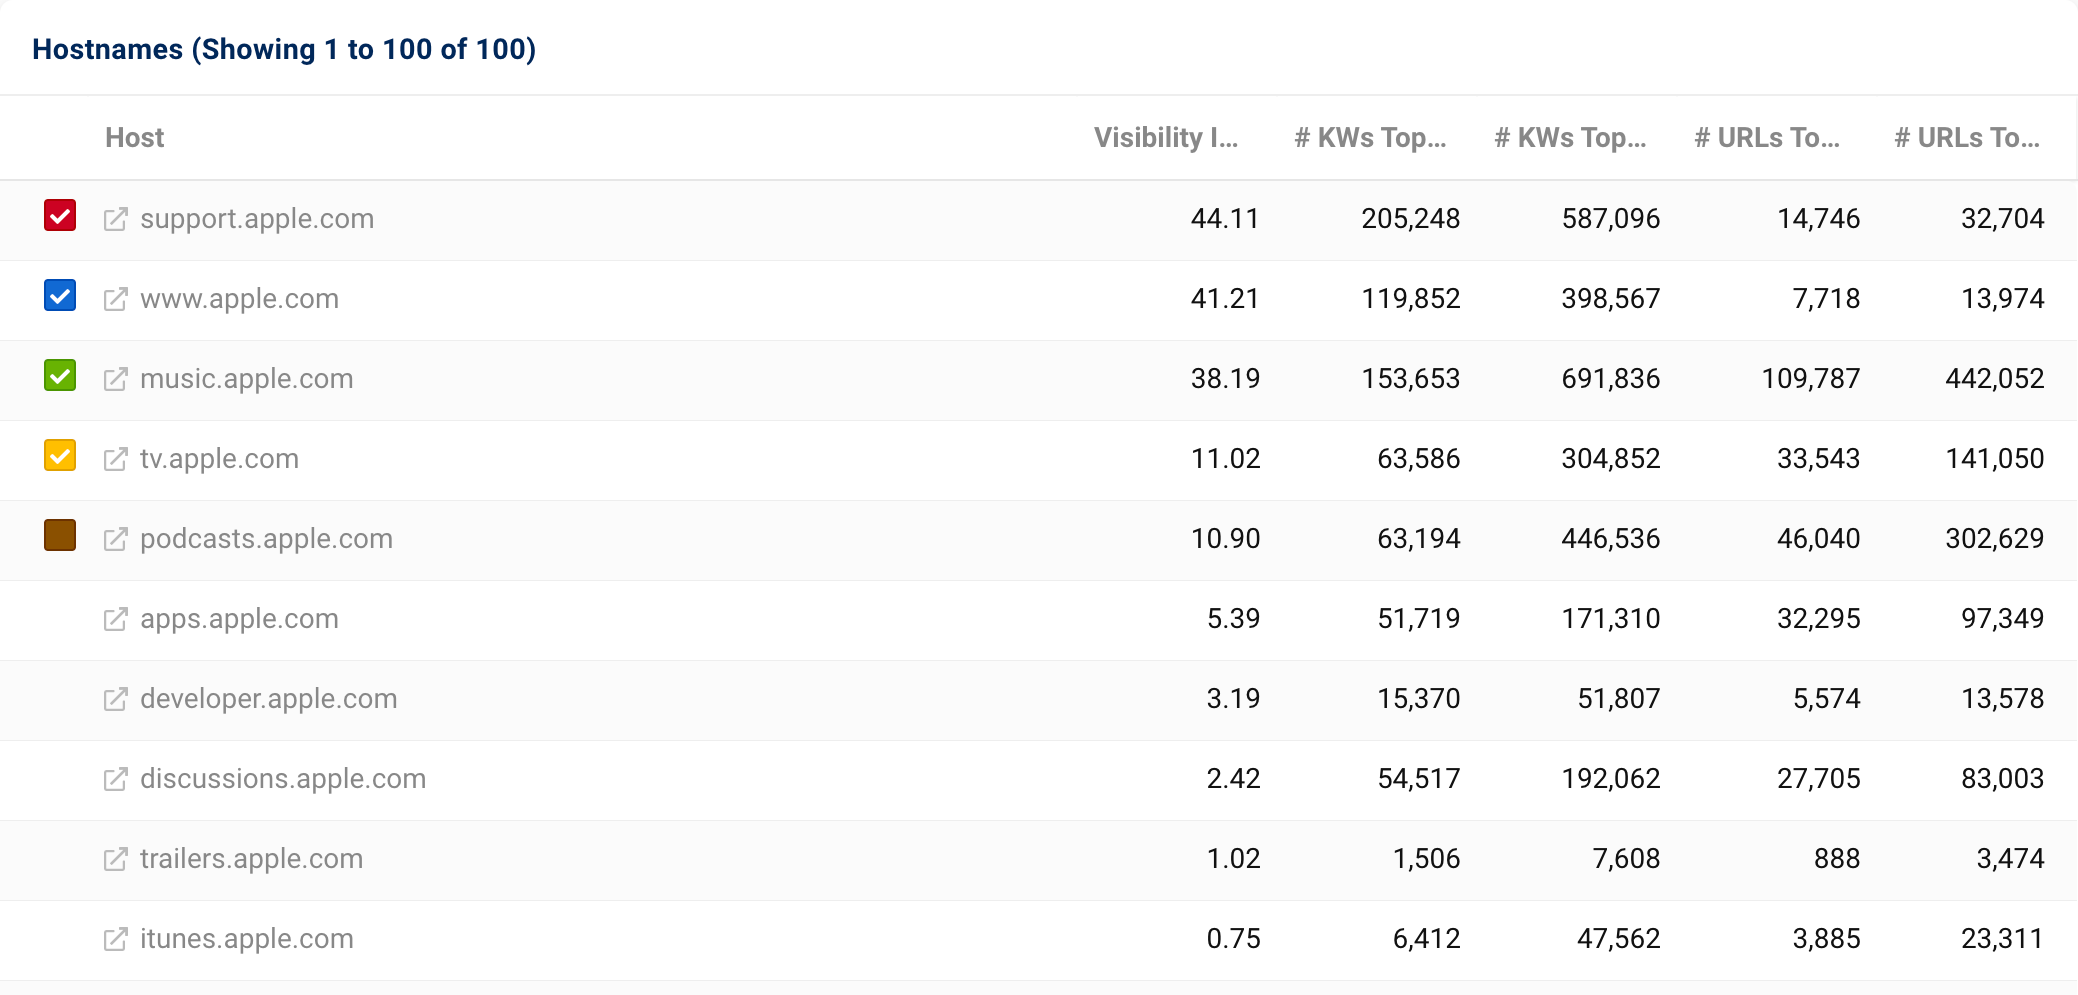
For each hostname, you will also find the respective Visibility Index of this host, the Top Keywords as well as the Top URLs.
You can use this data to quickly find out which subdomains a website has and which of those work well – or have worked well in the past.
Analyse a Host
The data in SISTRIX is available down to URL level, so you can segment a website more and more finely. This also includes the possibility of analysing the most import KPIs of hostnames.
Therefore, you should analyse the hosts you are particularly interested in more closely in the next step. You could get to the bottom of the following questions:
- What is the ranking performance on Google of each individual hostname of a domain?
- Are there any visibility problems with the subdomains caused by technical issues (due to a relaunch, for example)?
- How have the hostnames developed historically? Have there been changes in the domain structure?
Answering these questions is important, not only for your own domain. It also provides information advantages when observing competitors.
The host overview
Click on a hostname to open the host overview.
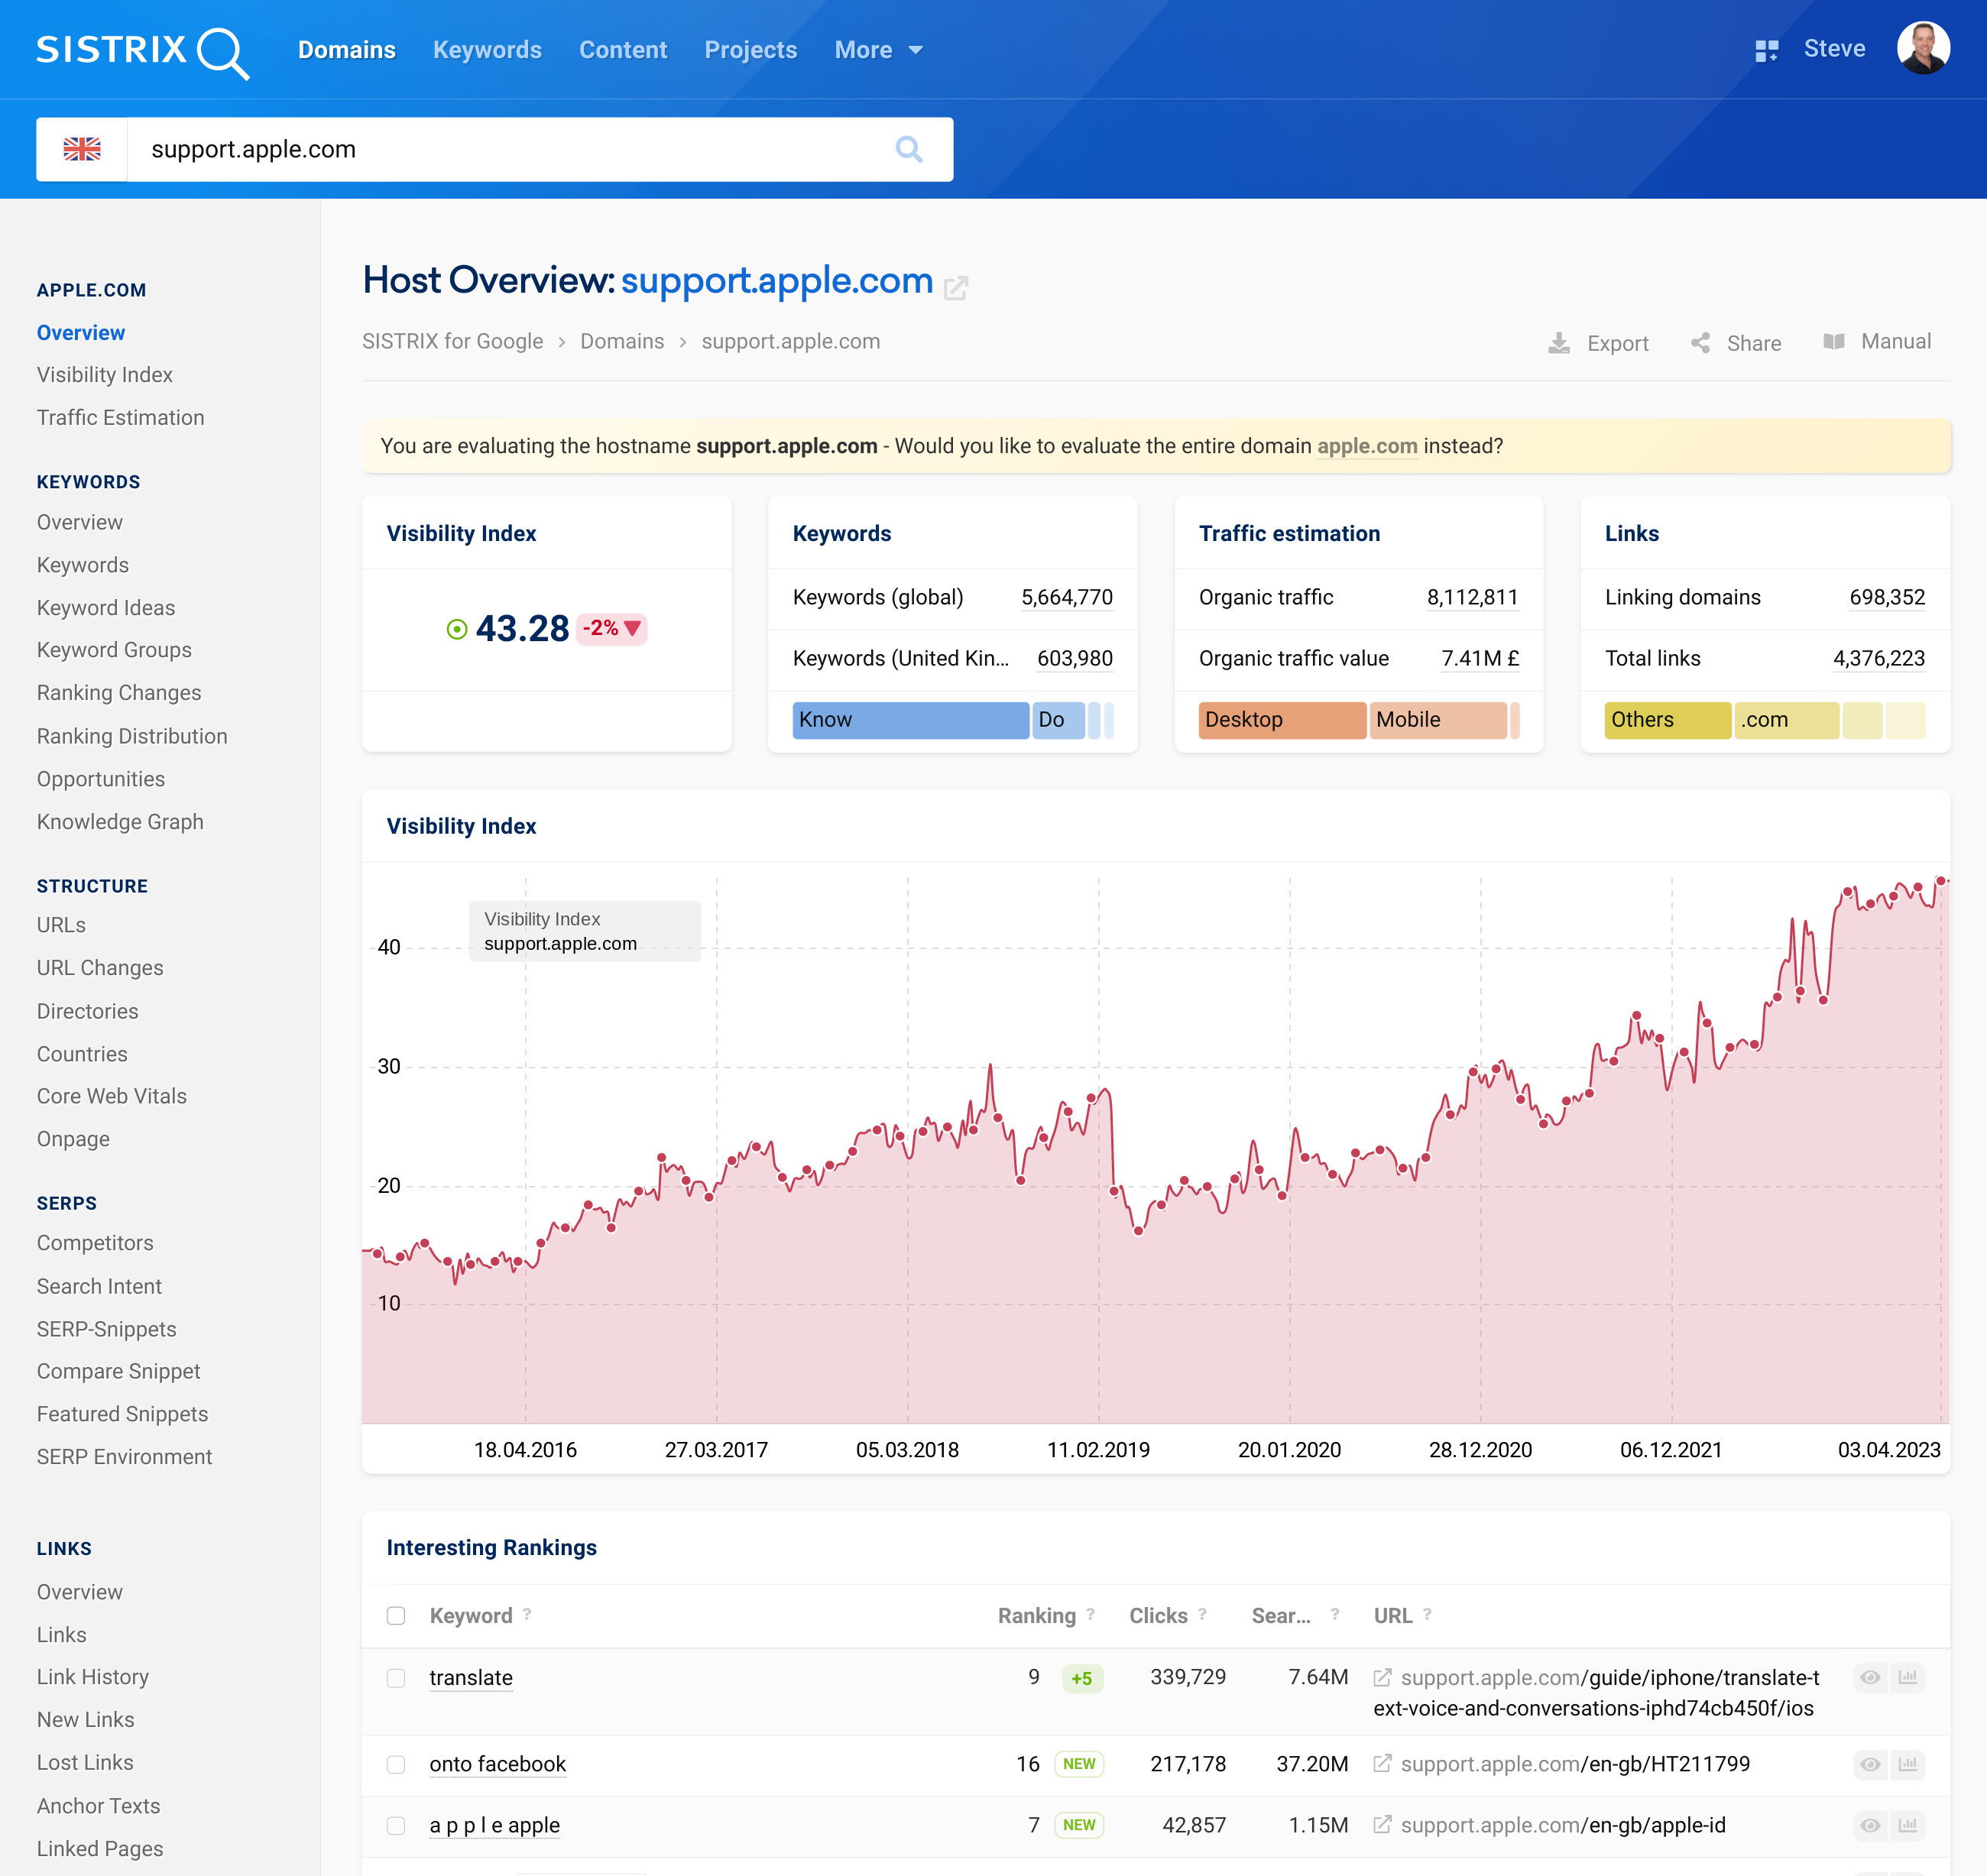
On the host overview page, you will find the most important key figures for this host: You will find the Visibility Index, figures for the host’s keywords, traffic figures, information on the backlinks, the graph of the visibility history as well as interesting rankings.
You will probably notice that the host overview is structured in the same way as the domain overview. Take a look at the tutorial on the domain overview to familiarise yourself with the individual data boxes and to get to know the practical features.
We will now look at some examples of ways you can use the visibility data of hostnames.
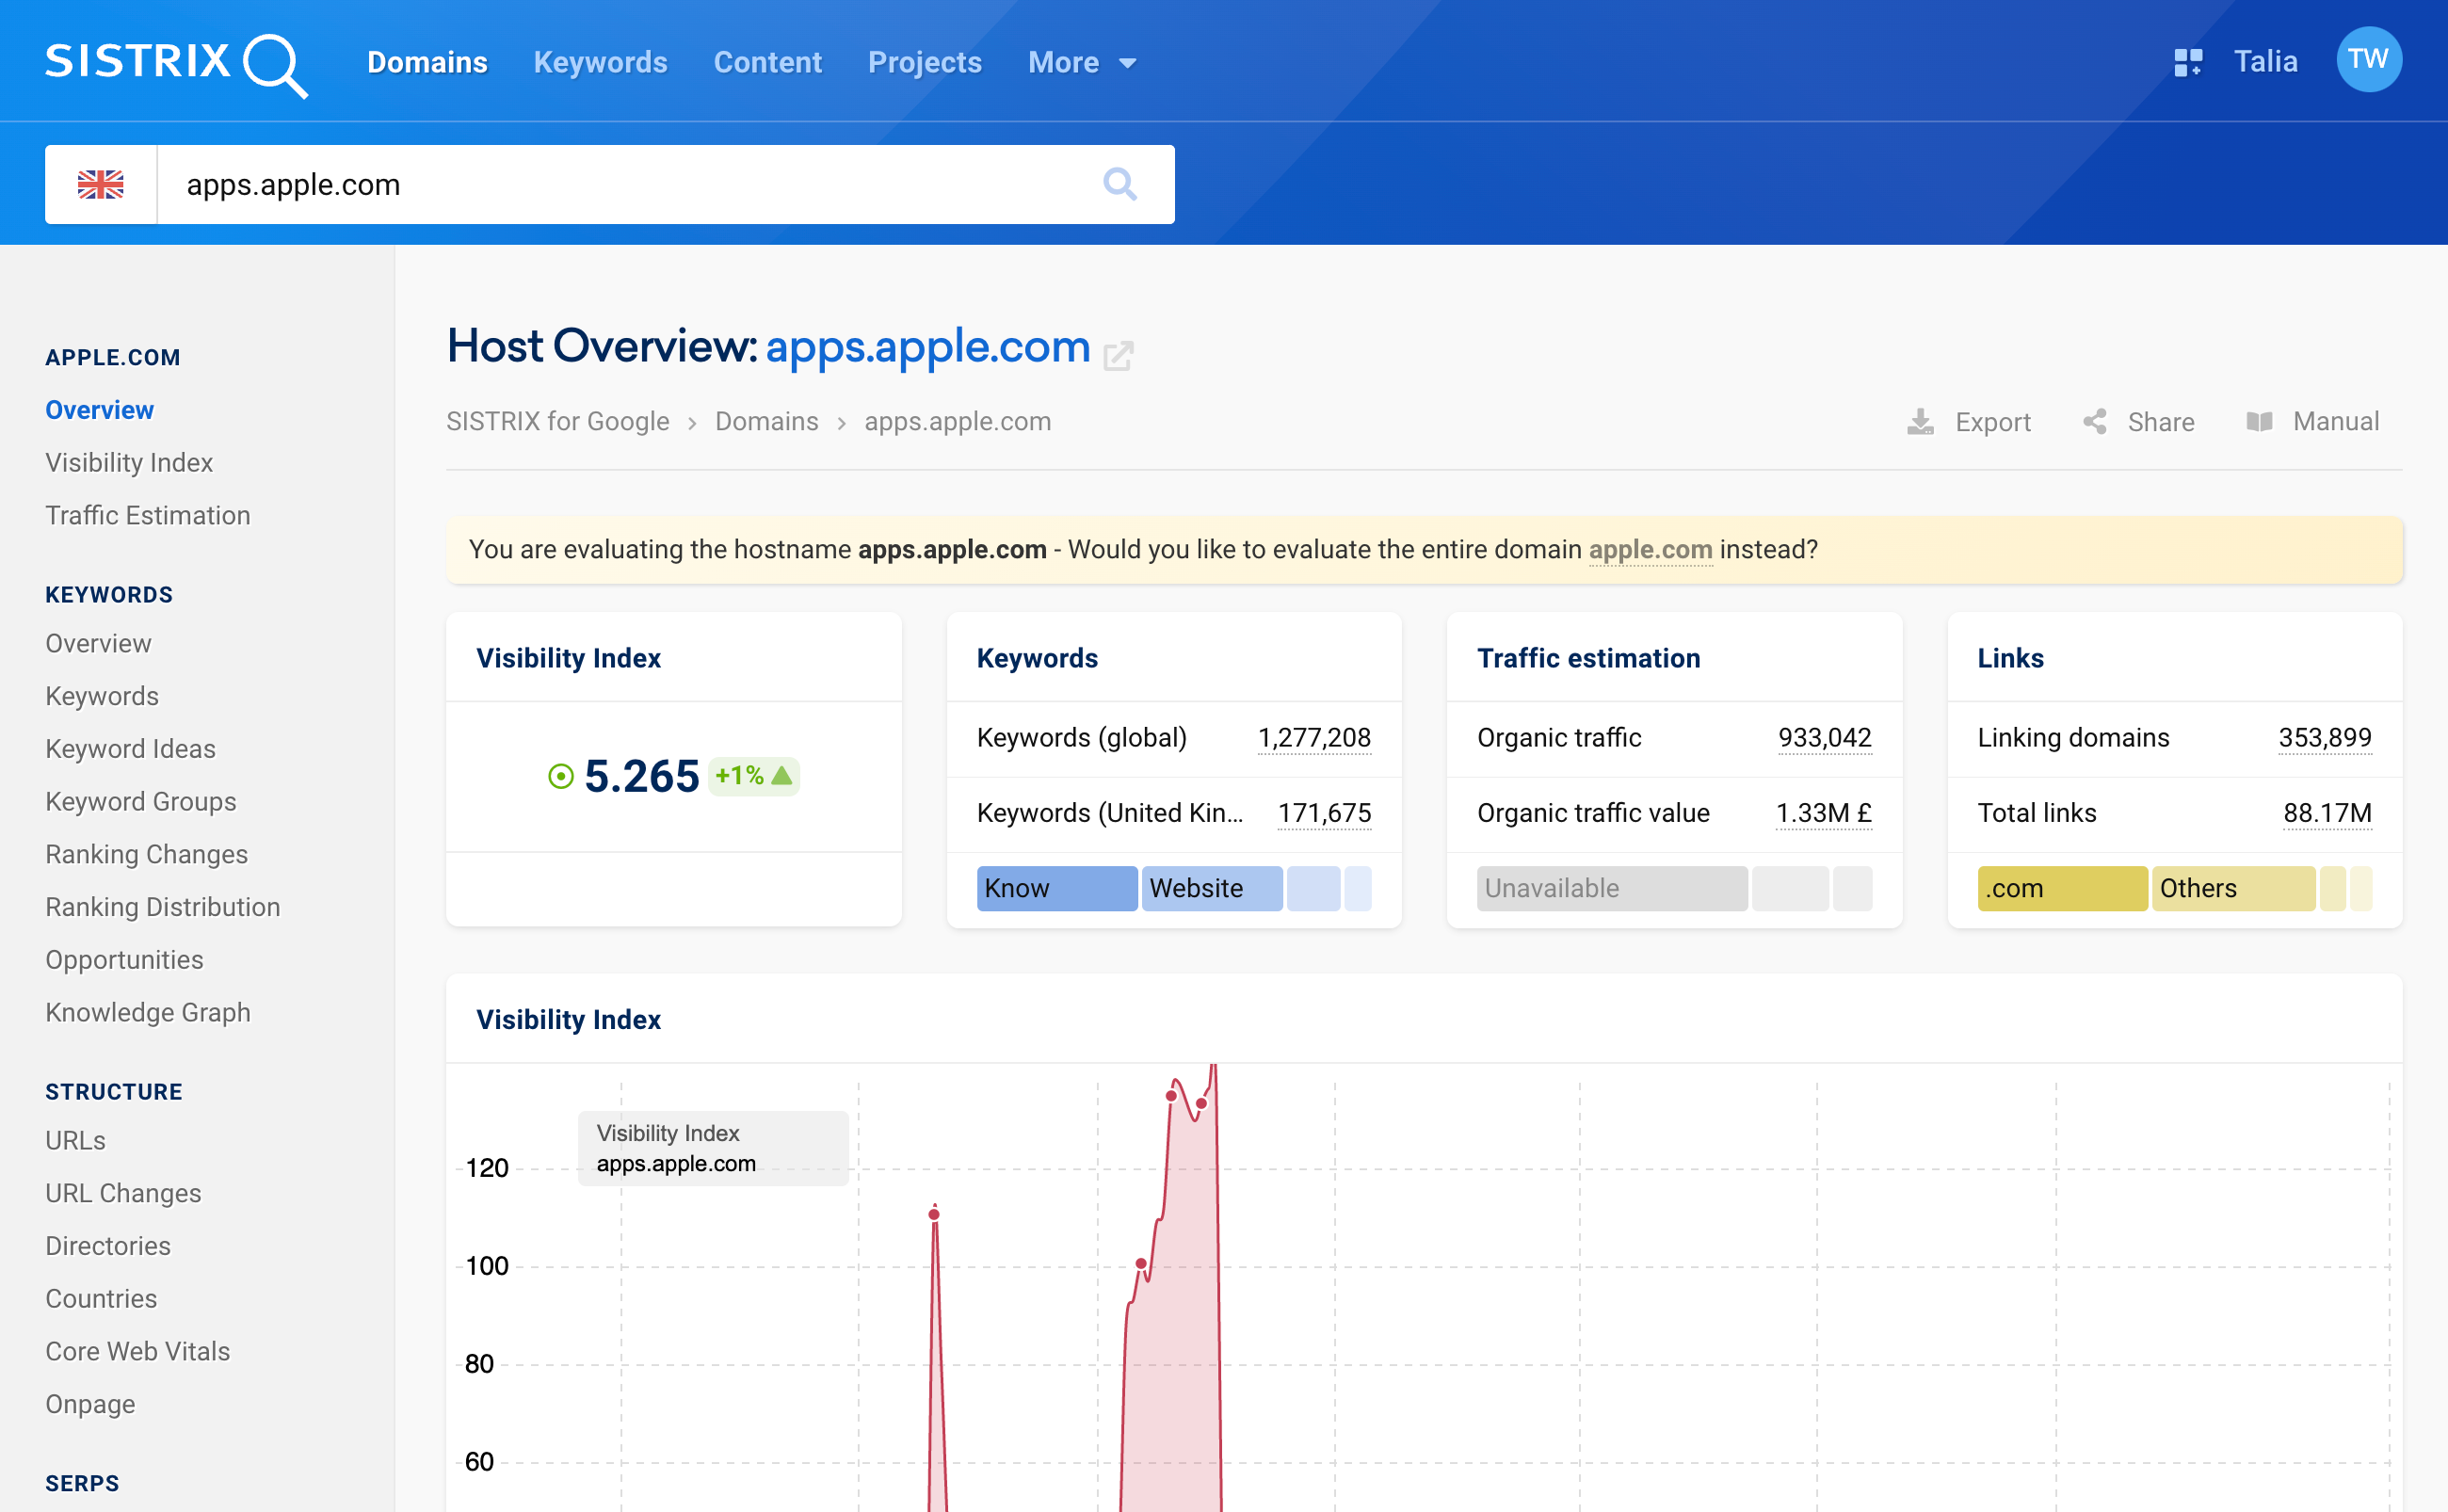
From now on, all features in the navigation on the left-hand side always refer to the host you have selected. You can identify this by what is displayed in the search bar at the top.
Thus, you have numerous possibilities to examine your host.
The evaluation of a host
We will use the domain apple.com as an example. As we have already seen above, subdomains are used a lot here.
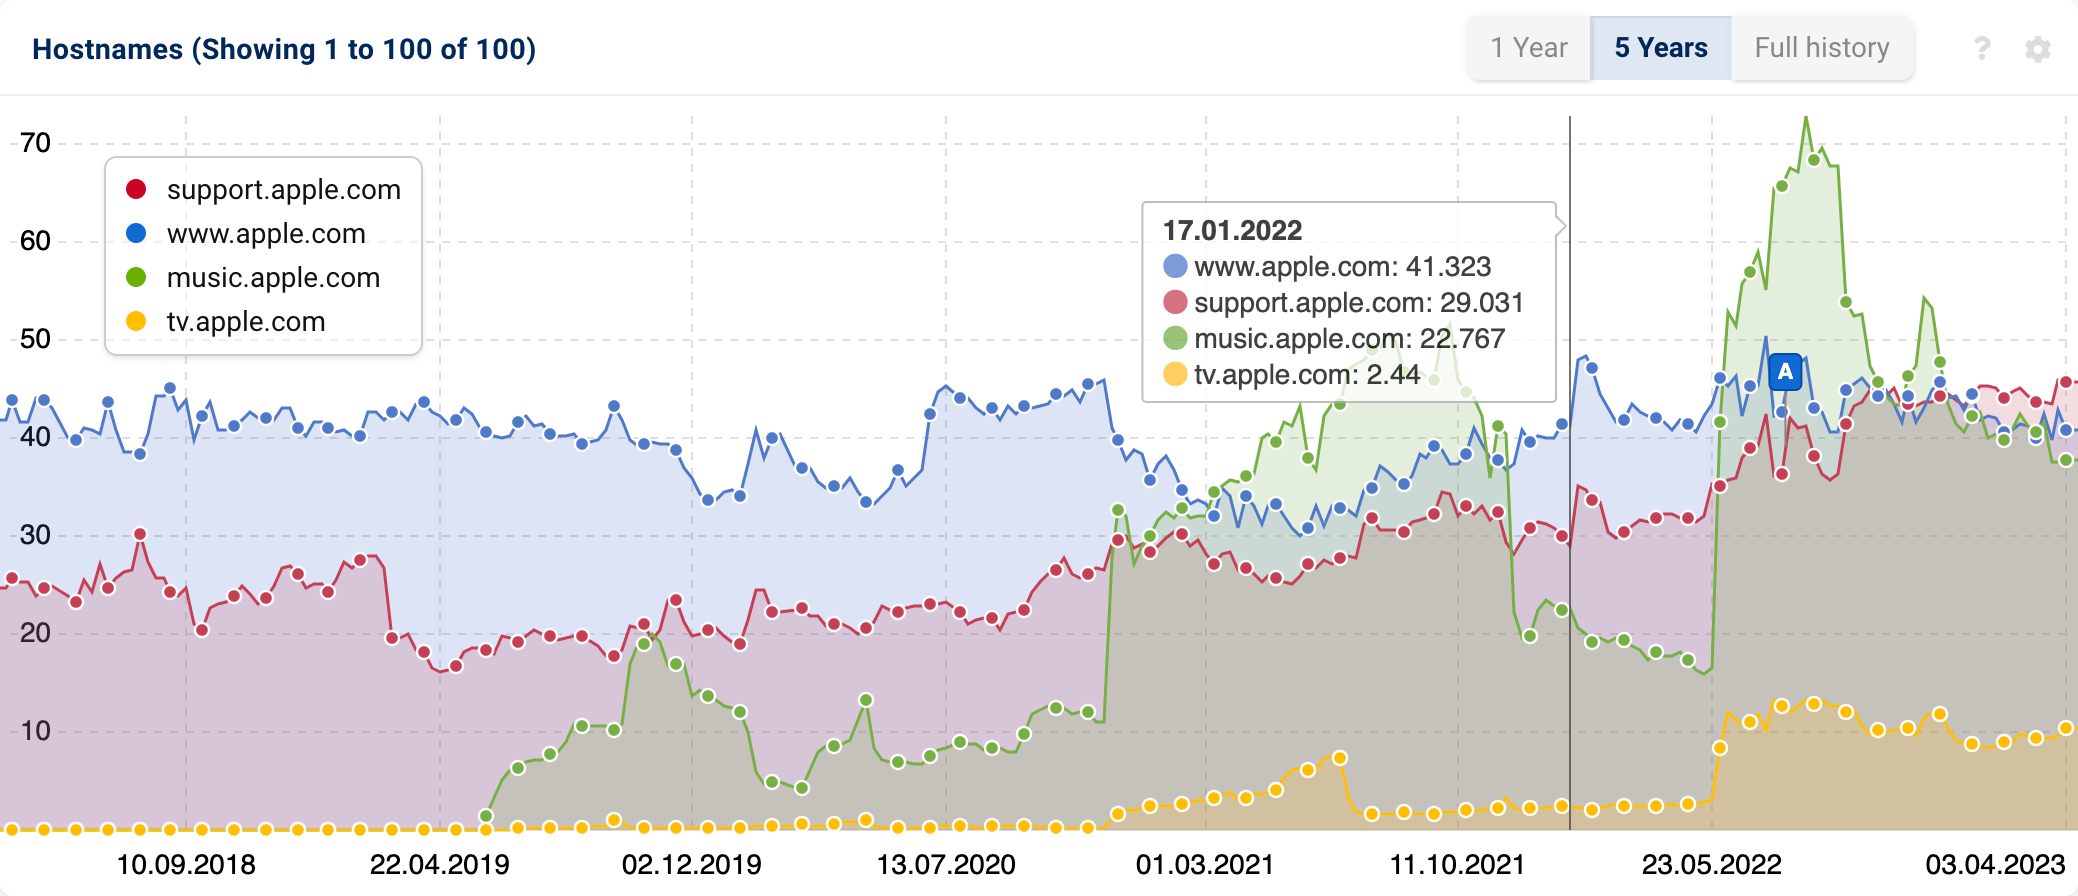
If we take a look at the data of the iPhone manufacturer’s hosts, we immediately notice that the hosts support. and www. each account for about one fourth of the total visibility of the domain apple.com (currently 158.79).
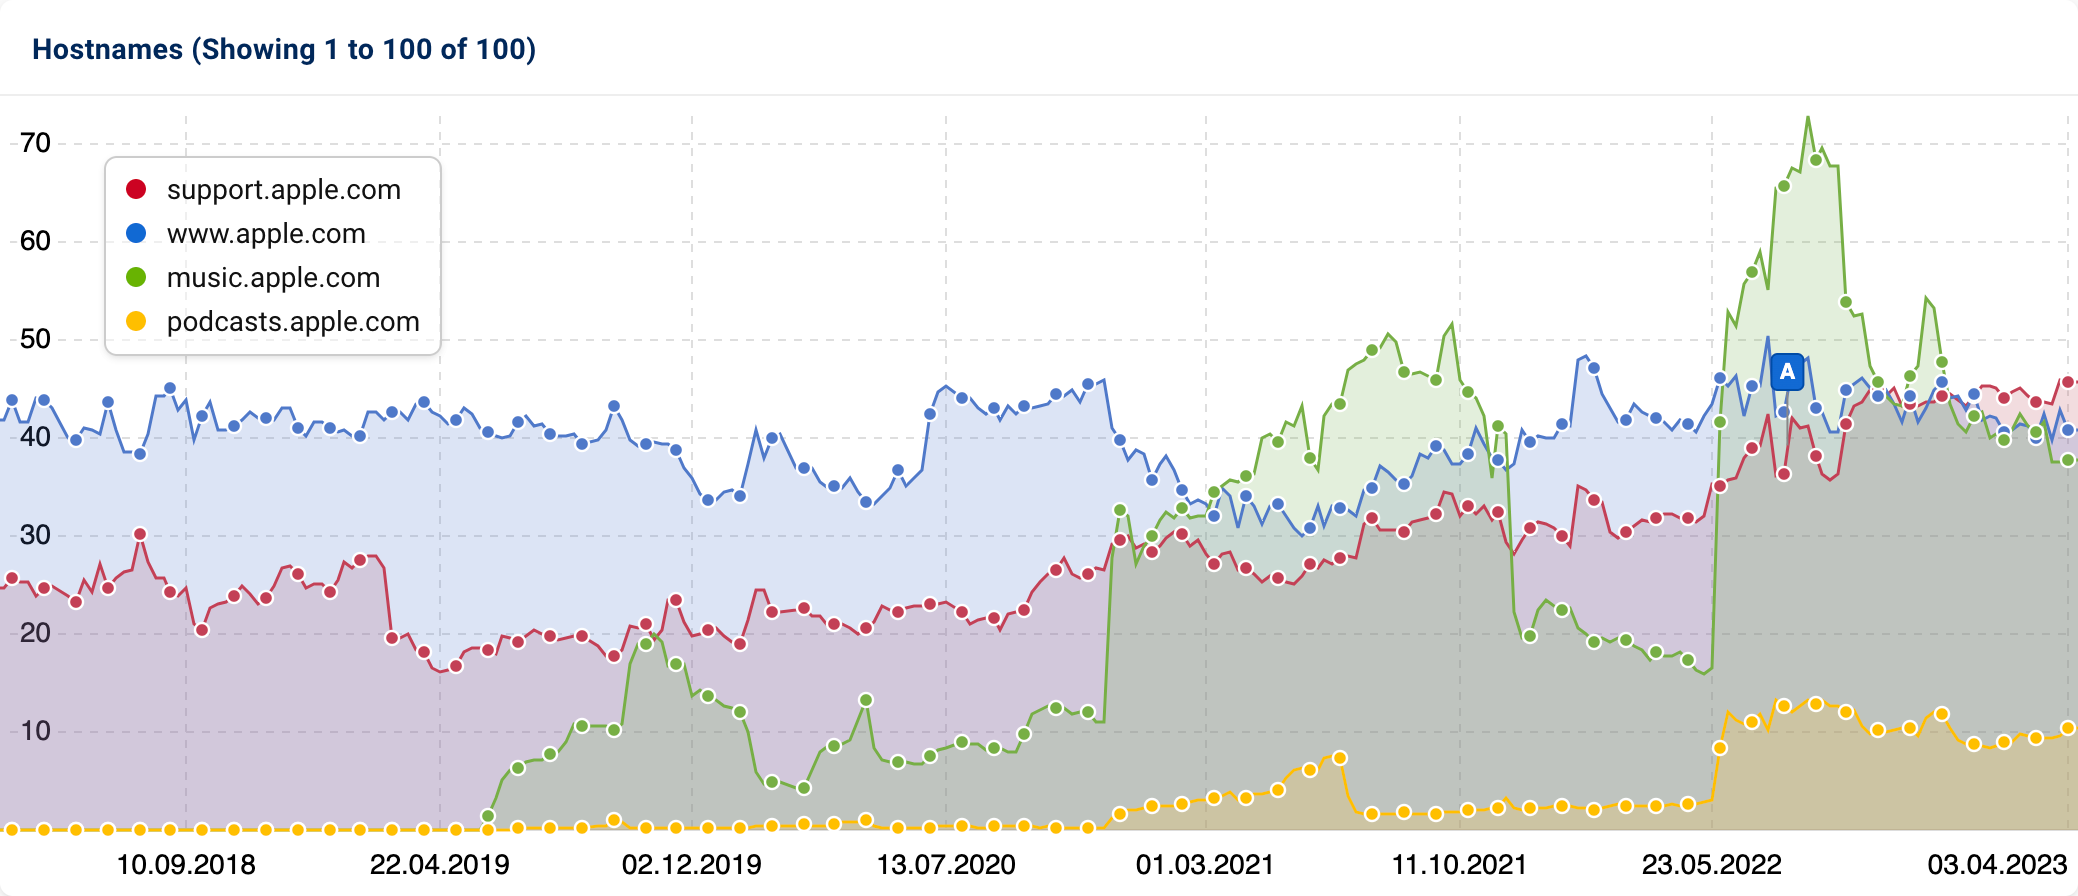
In the graph above the table, we see that the music host has jumped out of the ground in mid-2019. This is usually a very good sign that one or more other hosts have been merged into a new one.
By default, the mobile data is selected as the data basis. Using the “Options” button in the bar at the top of the page, in the image below at 1, you can select the desktop data under “Data Source”.
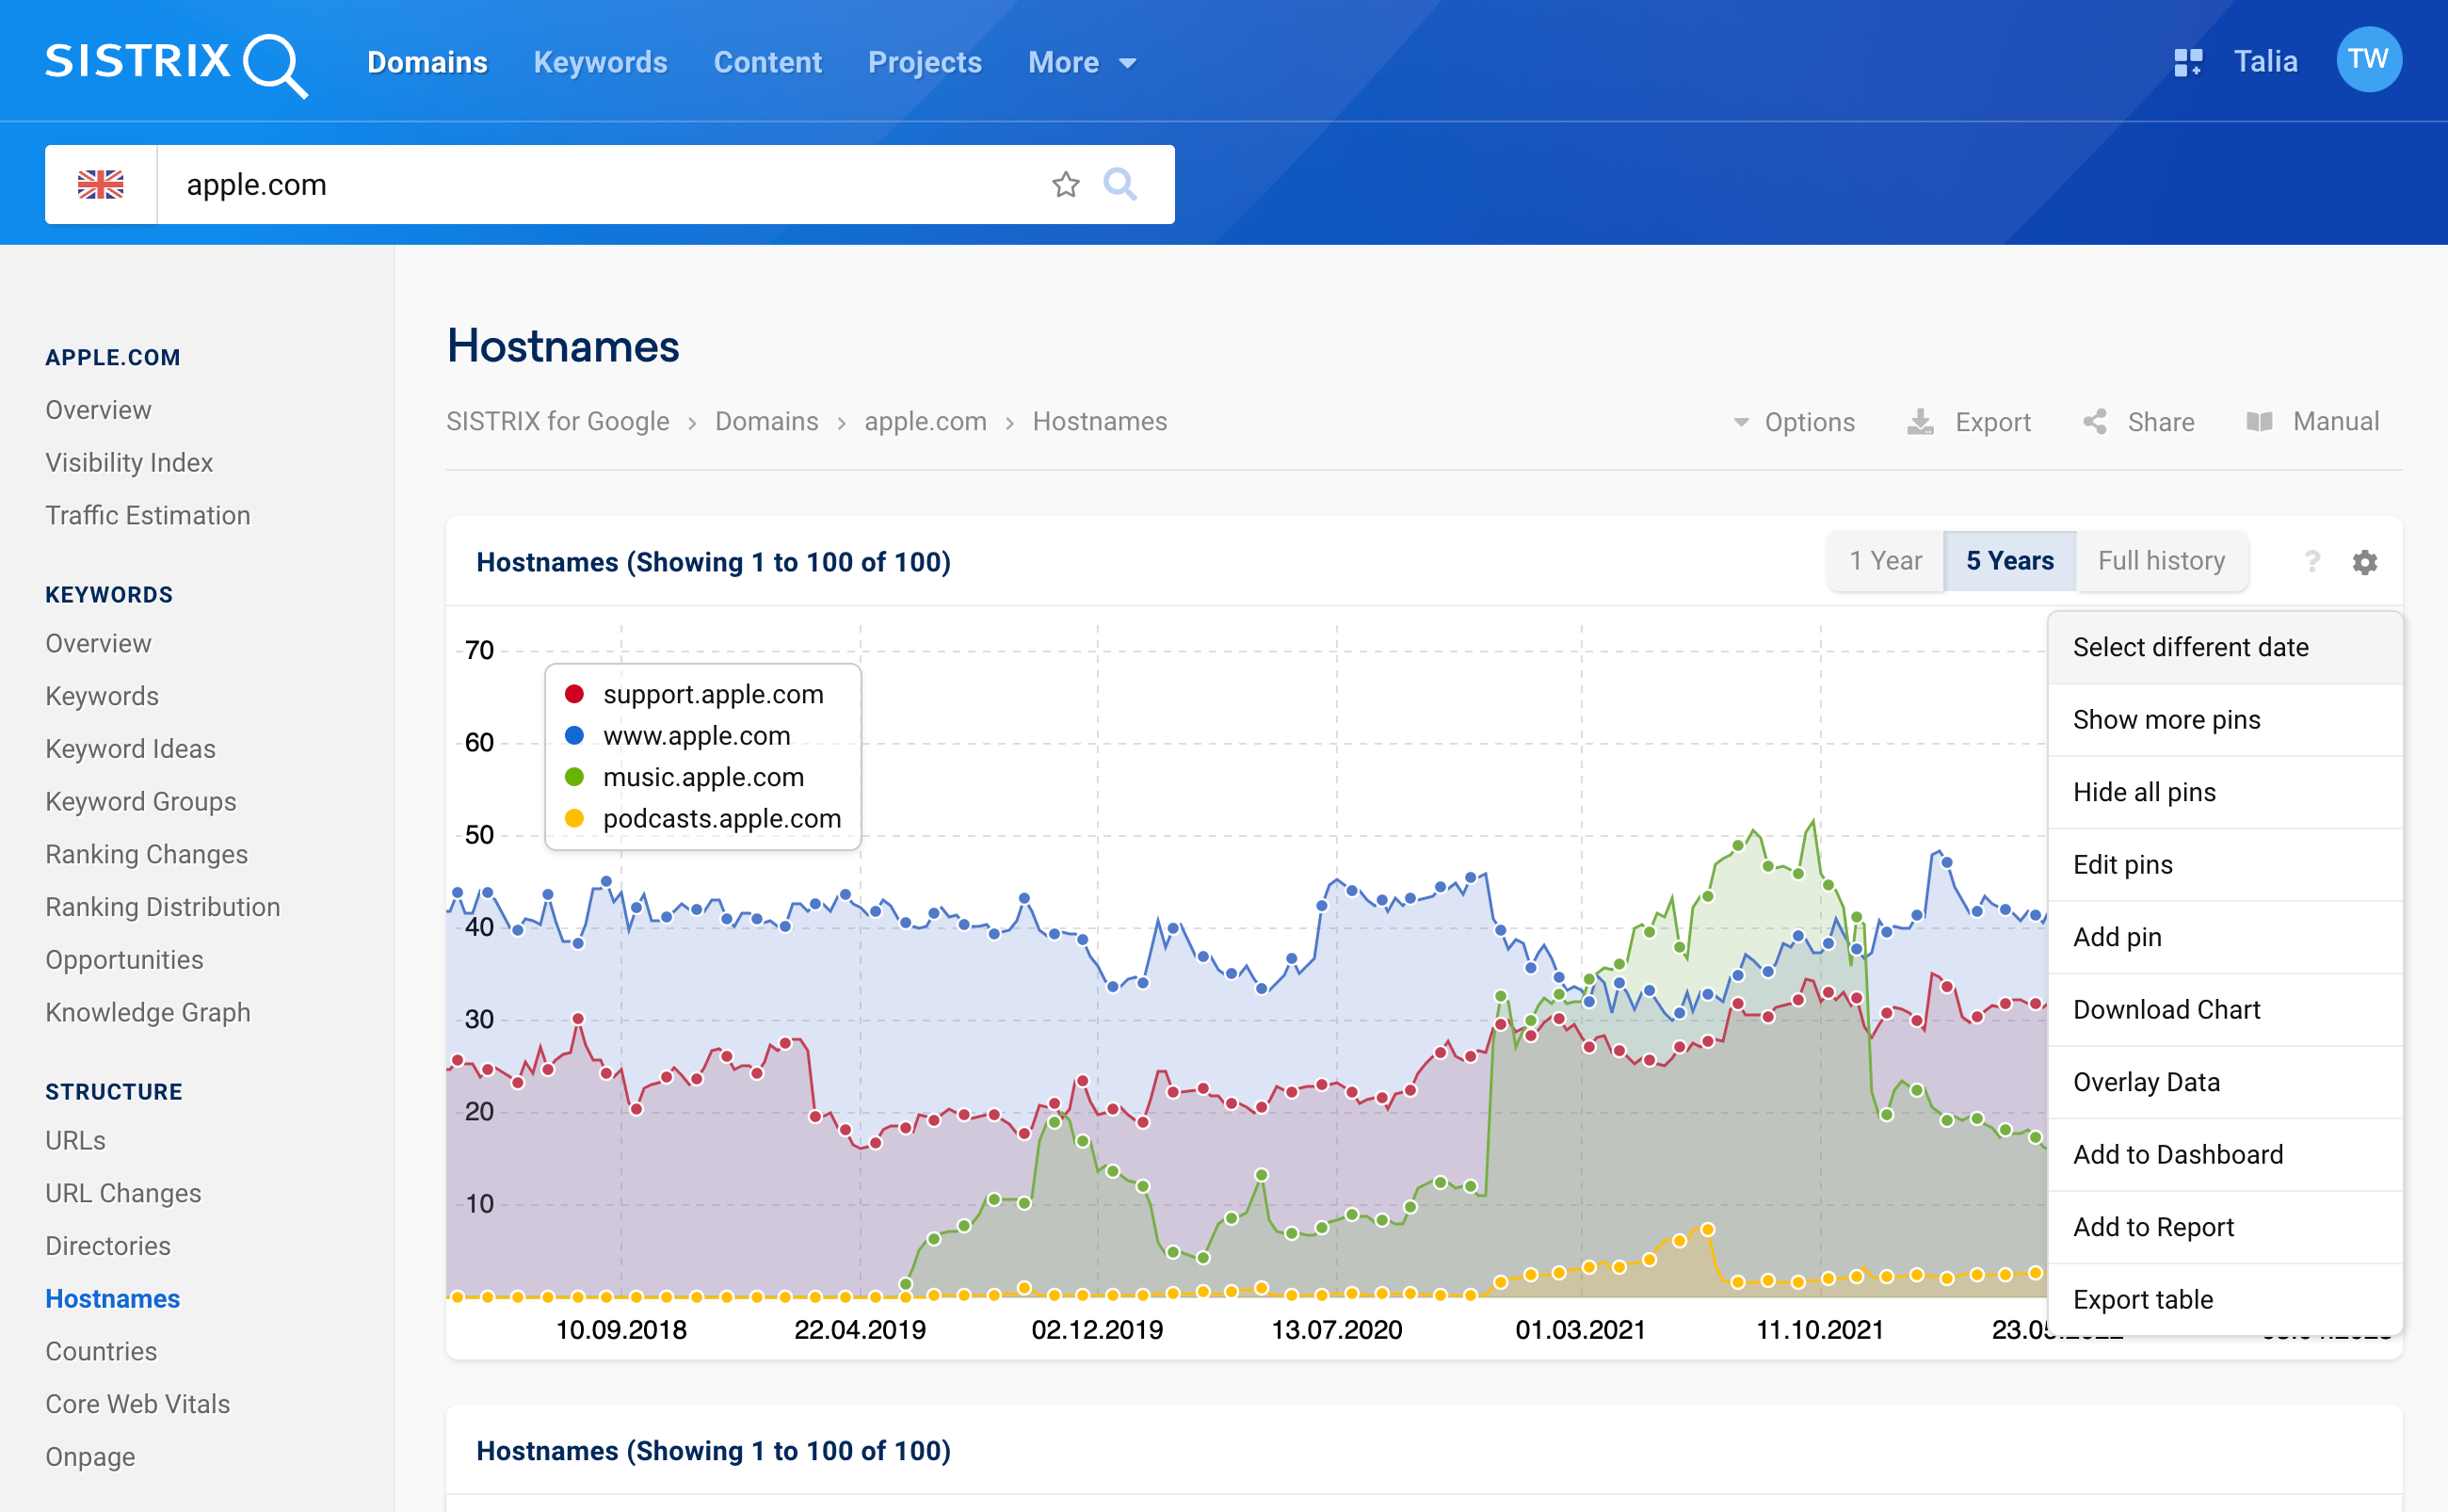
Let us change the data basis to desktop and look at a date before the rapid increase. To do this, open the box options via the cogwheel at the top right and click on “Select different date” 2.
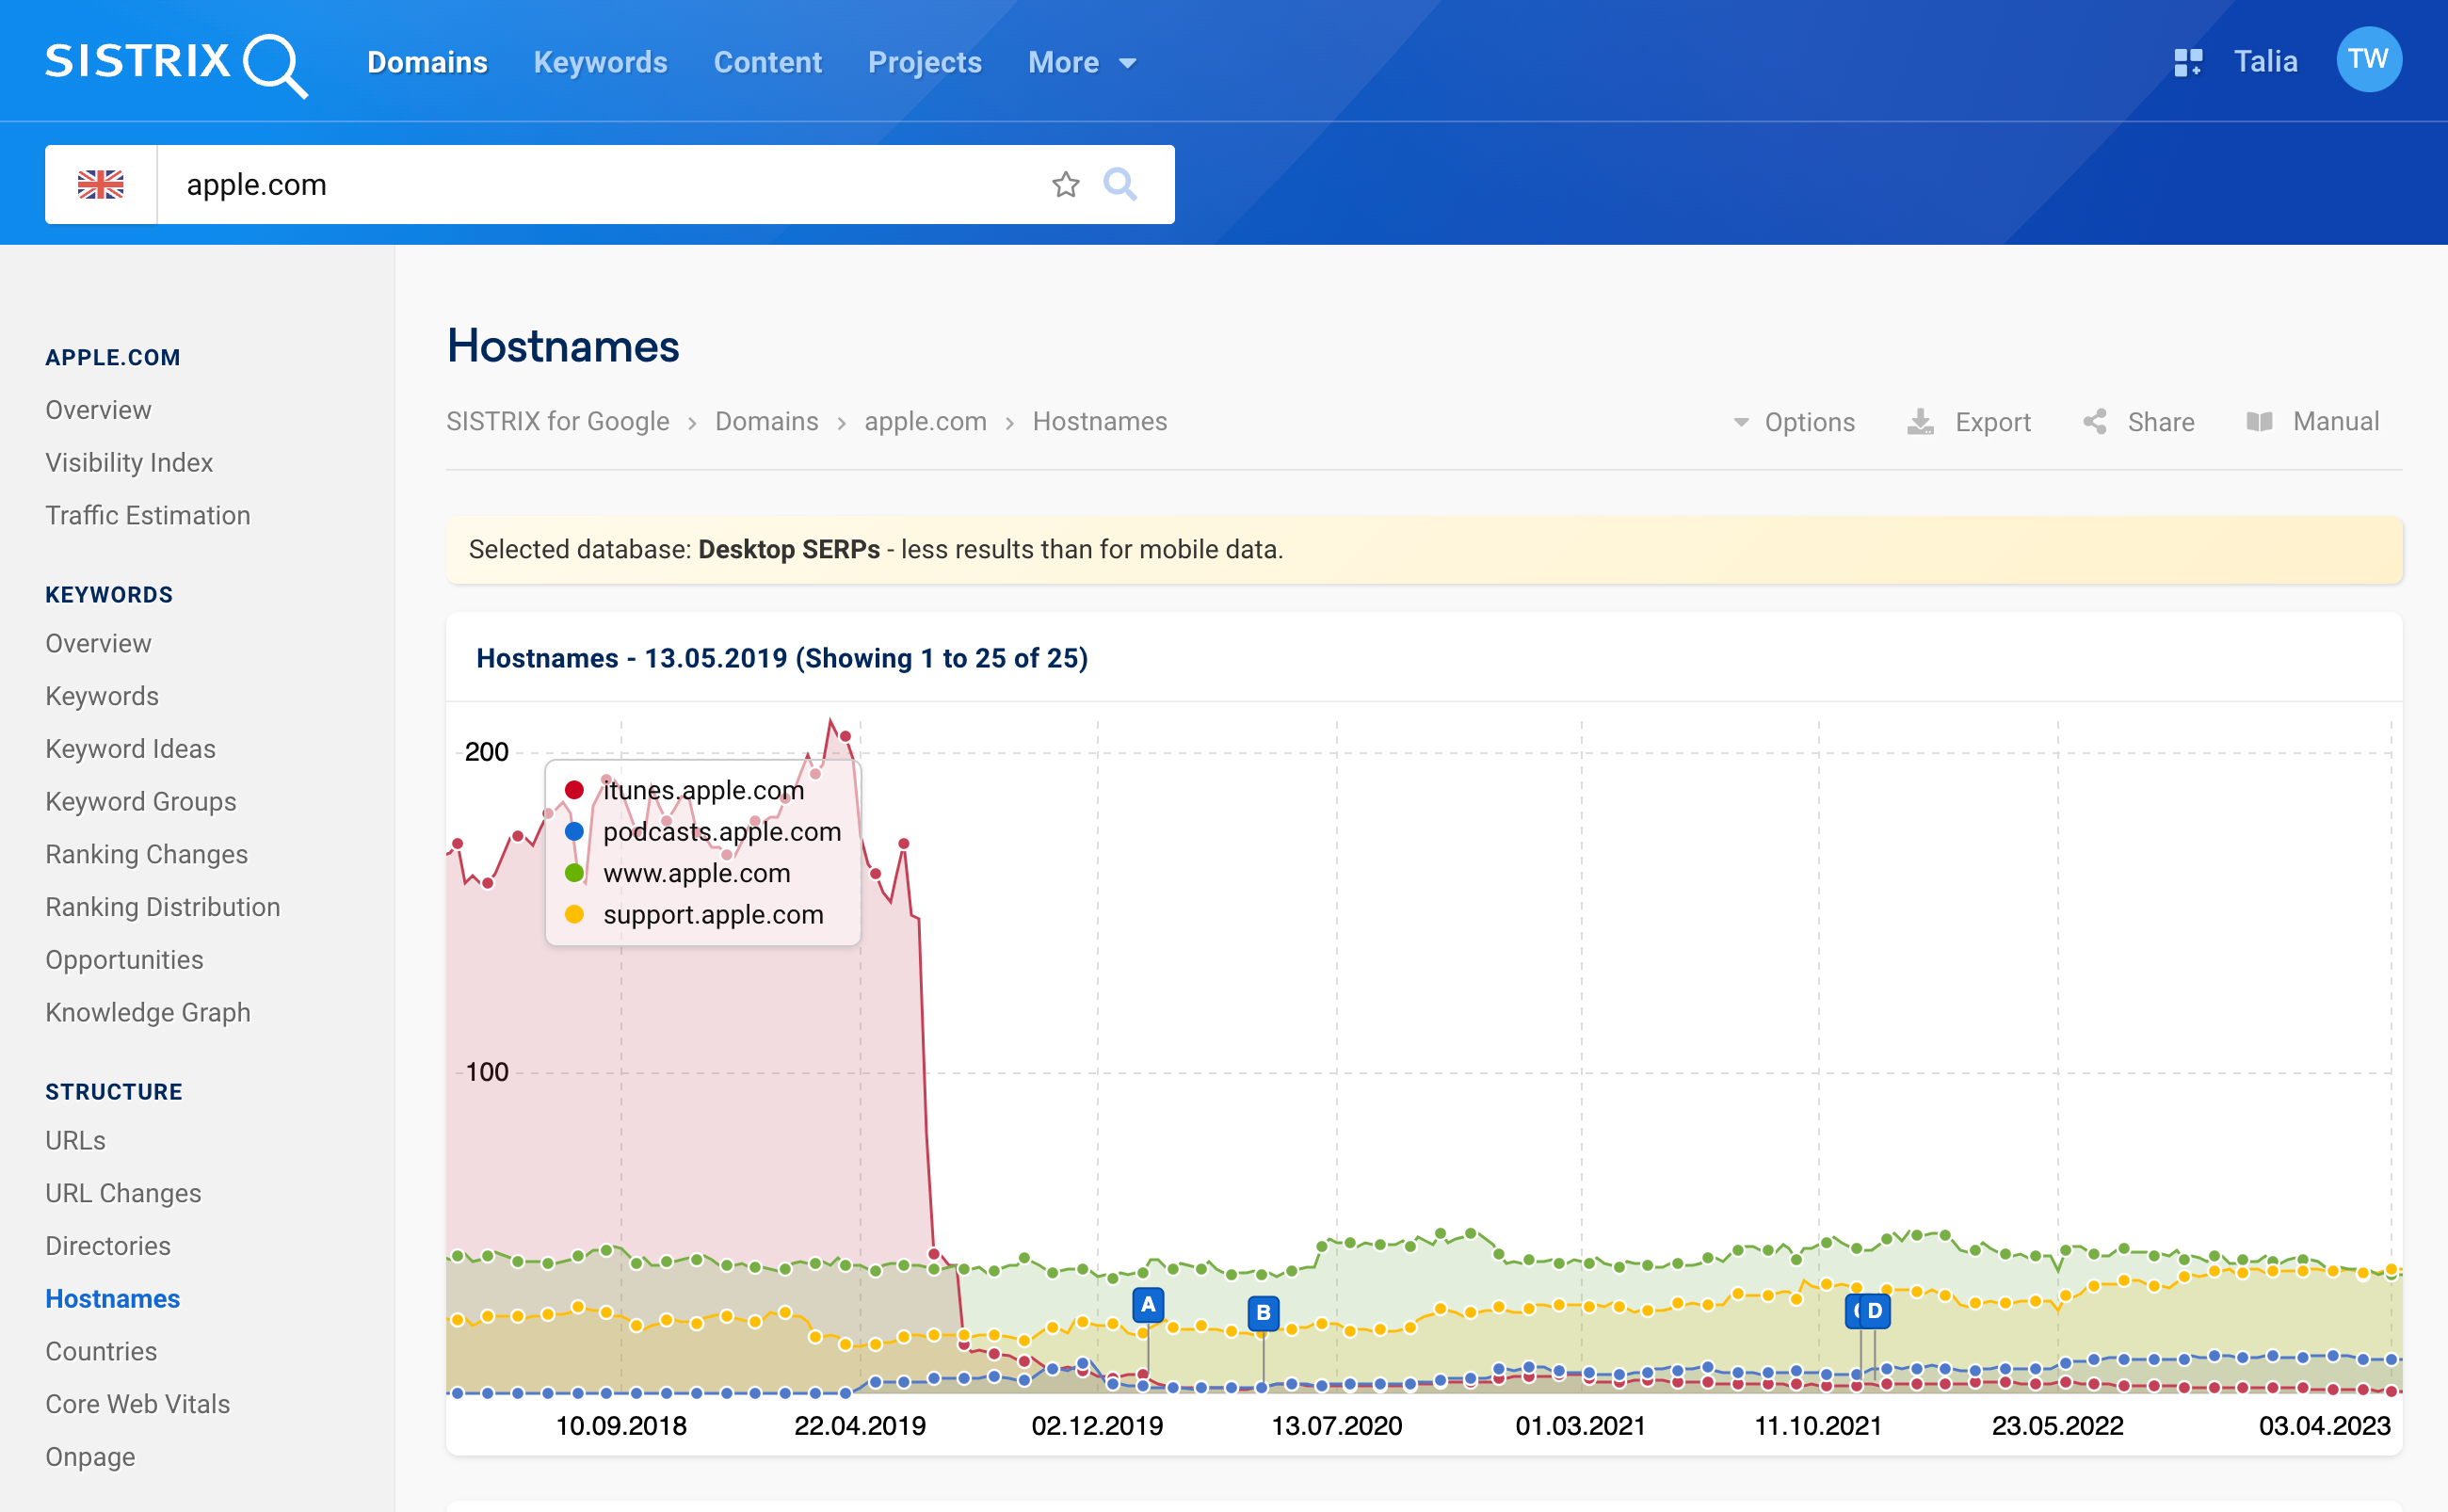
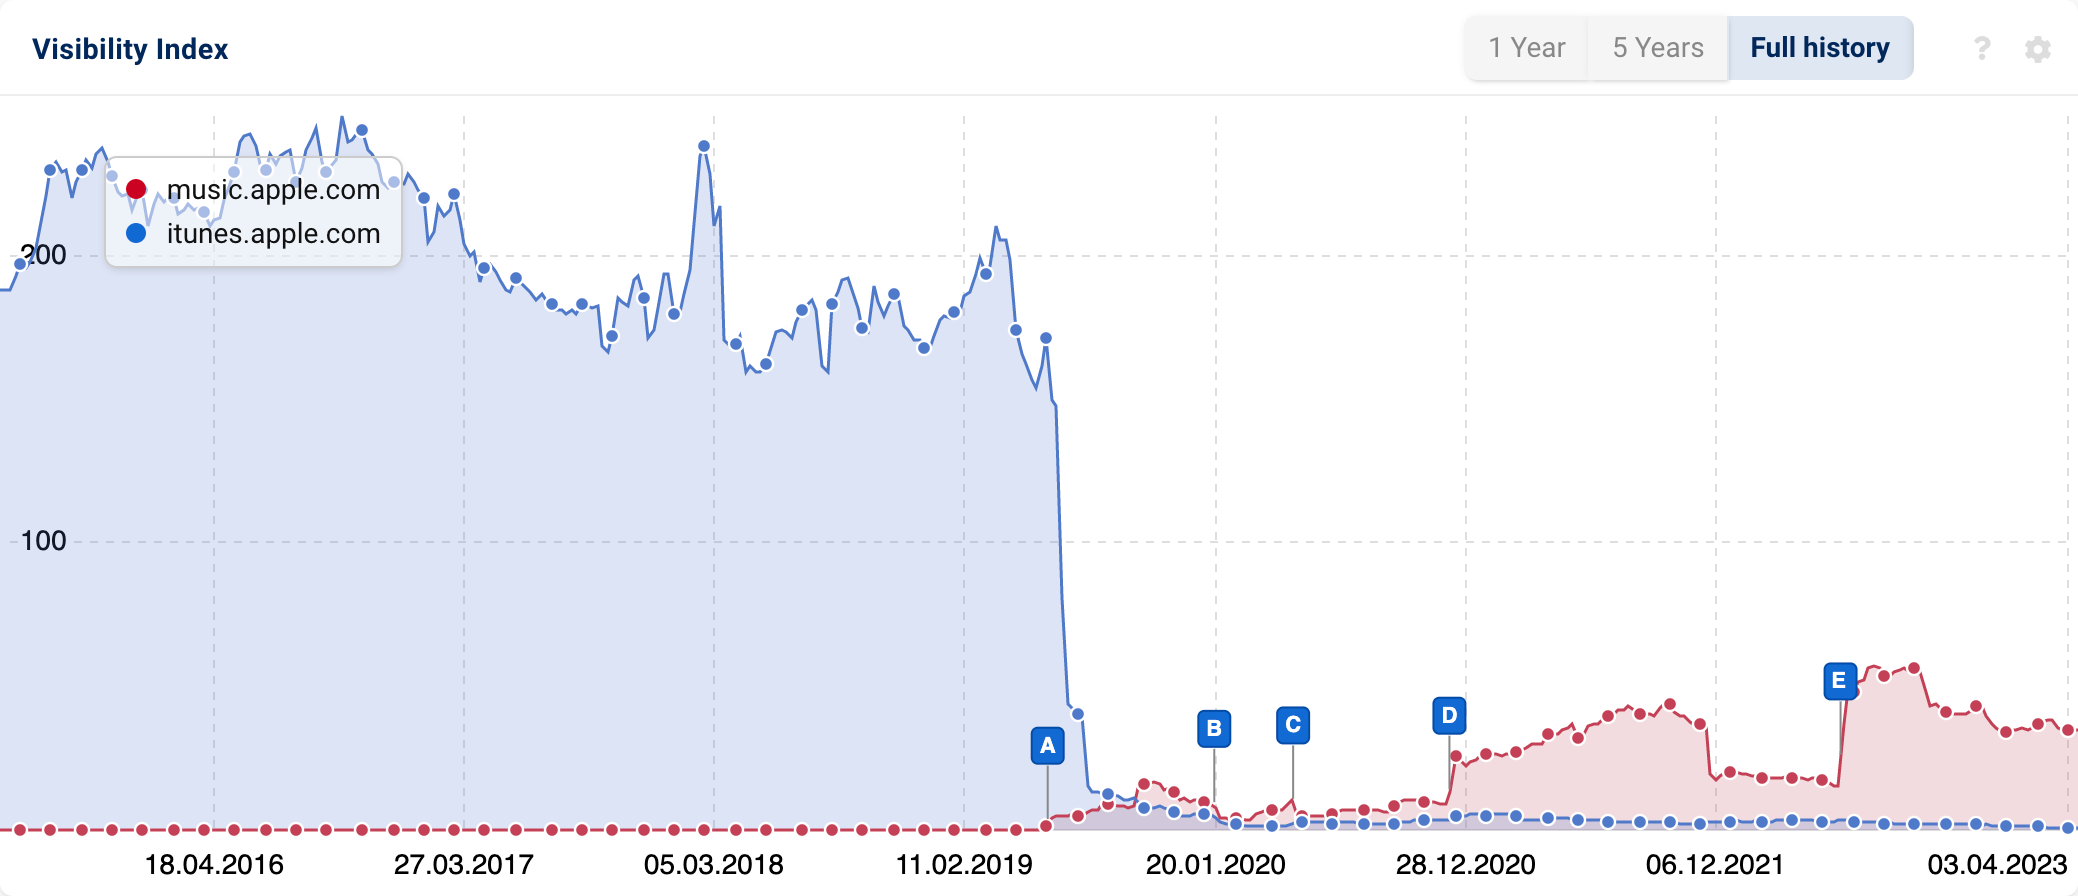
If we choose the data point May 13, 2019, for example, we can see which hostname previously accounted for the majority of visibility: itunes.apple.com.
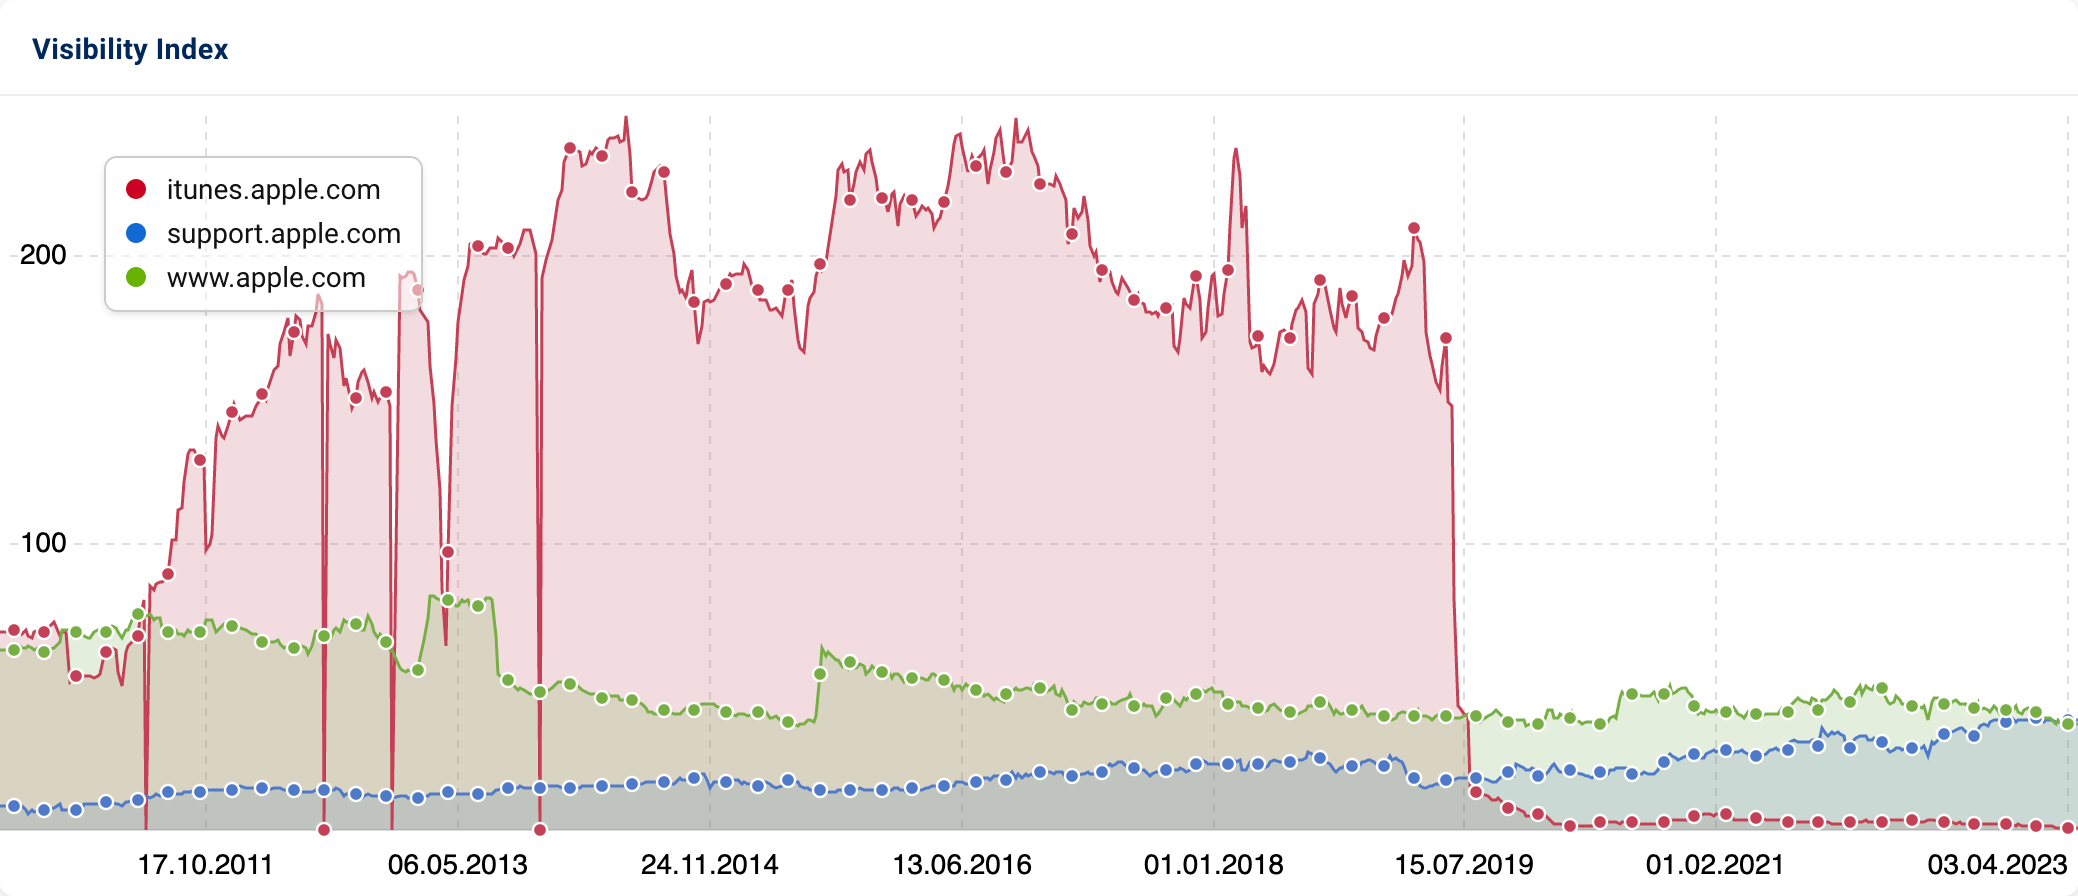
In this case, it makes sense to display both hosts together in a history graph in order to communicate this change, e.g. to the management.
The option “Overlay Data” is helpful here, accessible again via the cogwheel in the top right-hand corner. There we can simply add itunes.apple.com as another line and voilà:
More Ideas for Host Analyses
This way, you can analyse hostnames from different perspectives – depending on the use case. Further ideas could be, for example:
- Planning and monitoring a host change.
- Comparing visibility changes of different hostnames. Which subdomain works? Which one does not?
- Discovering previously unknown activities of the competition – both in the past and present.
- Making sure that the staging environment used (e.g., for relaunches), i.e., a virtual area for testing the new and not yet final content, is not indexed and thus also ranked by Google.
- Finding competitors at the host level.
- Comparing the visibility performance of different hosts graphically.
- Using all information automatically via the API connection.
- Identifying well-functioning internationalisation strategies at host level.