
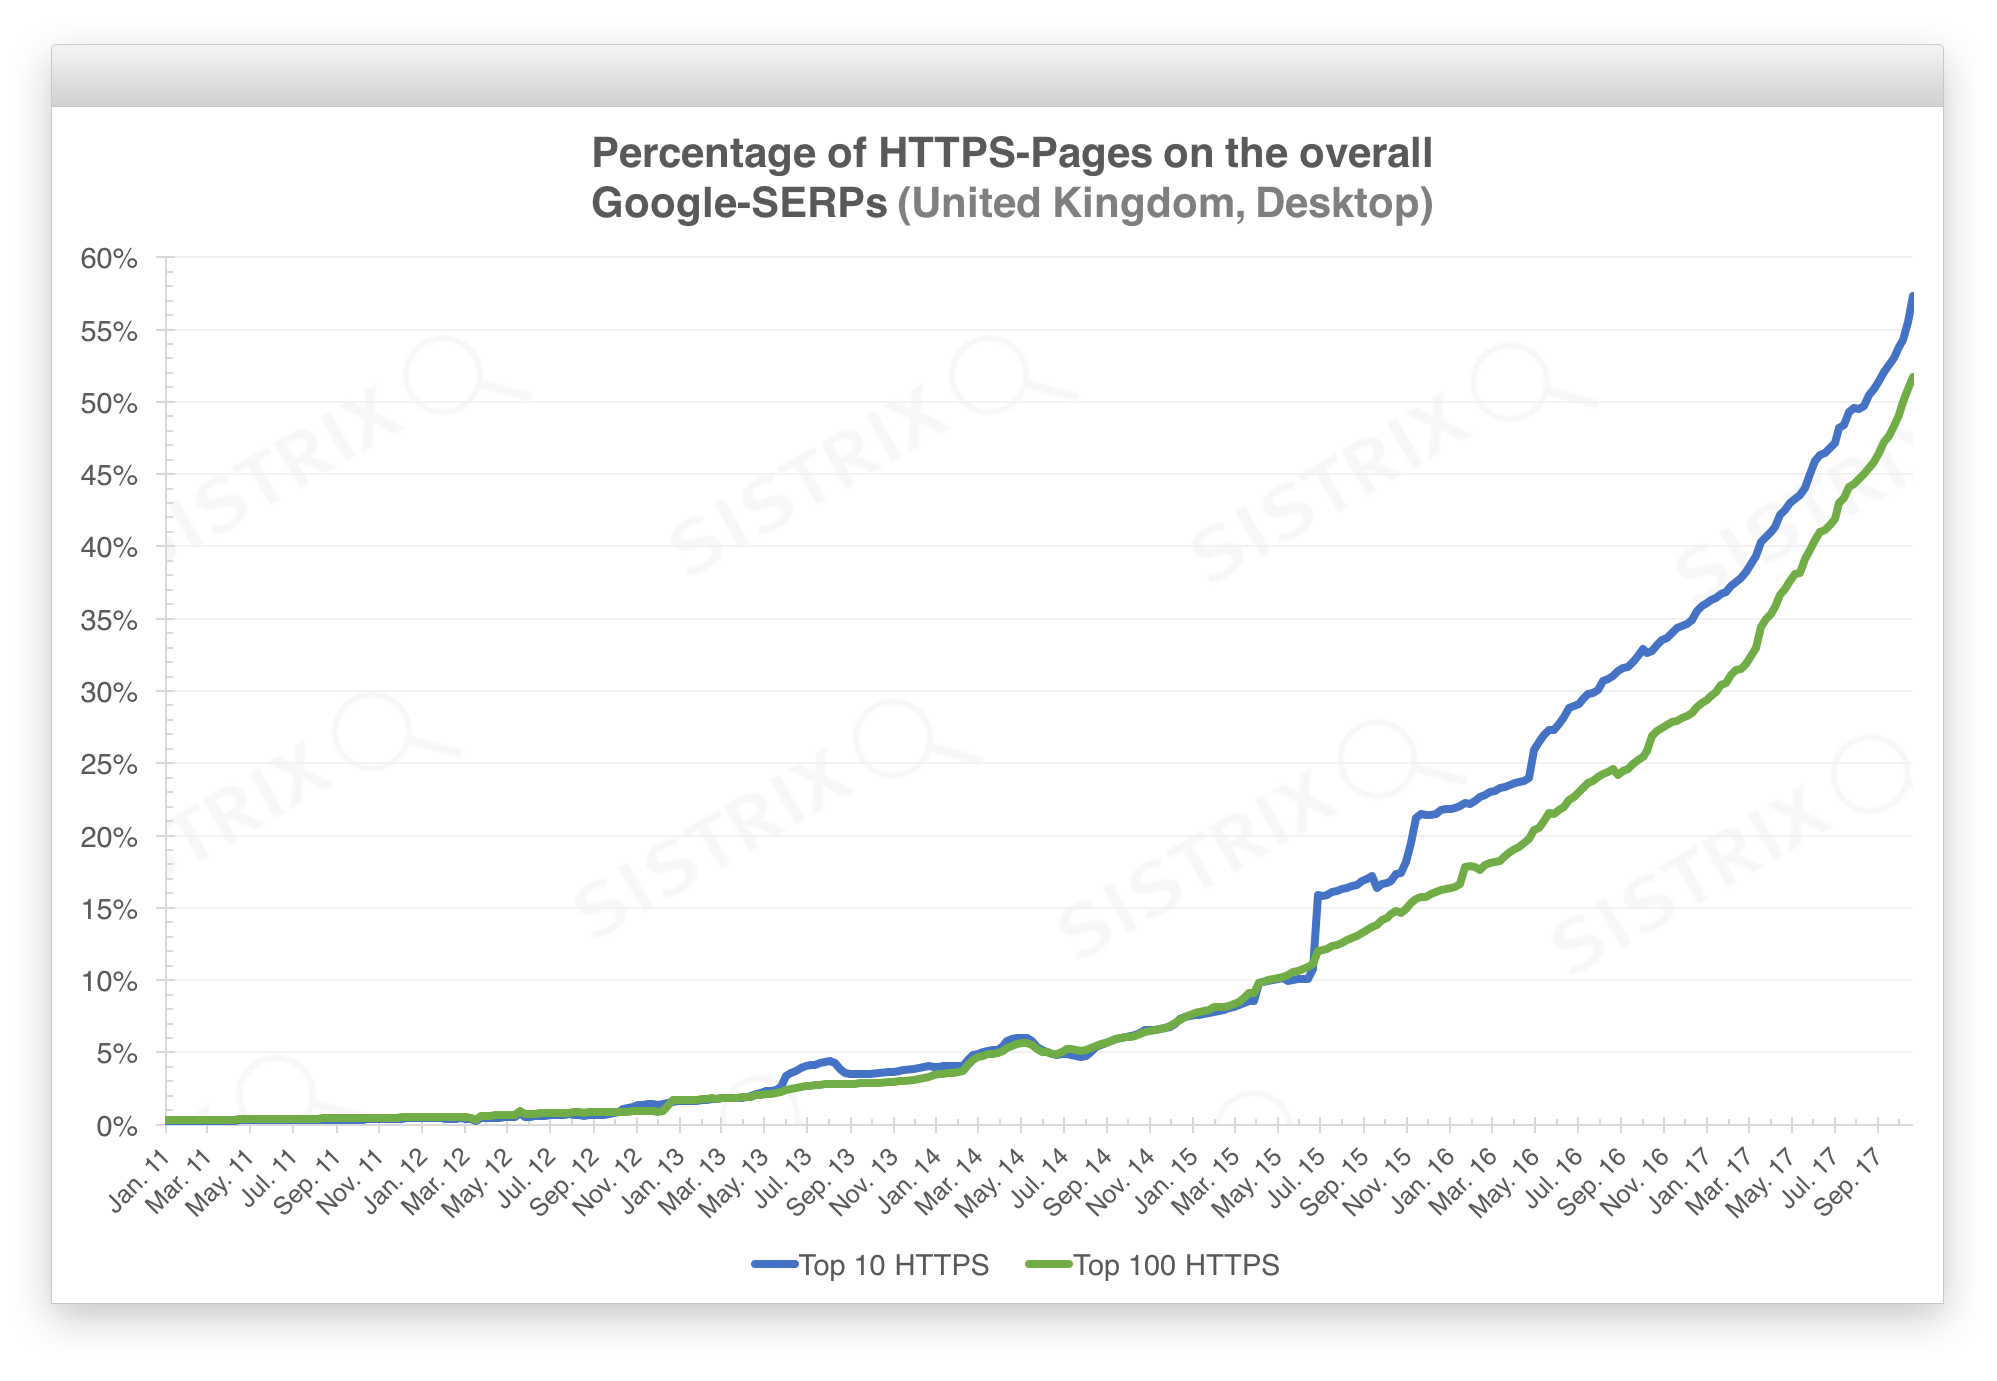
Google has already started to reward the encryption of websites via the HTTPS protocol in 2014. Over the past few years many website operators have switched to HTTPS and the development in the UK shows substantial growth.
A move to HTTPS takes much more than simply flipping a switch. Since you also have to pay attention to many technical aspects, we would like to show you how to follow and monitor the SSL encryption of your website with the SISTRIX Toolbox in this tutorial. This way you can quickly detect potential errors in the conversion.
We do this in three steps:
- We create a report so that you can keep track of the key figures for important areas of your domain during the conversion.
- Immediately after the conversion, you can use an Optimizer project to check whether all pages are accessible.
- With the help of filter options for your URLs, you can observe whether Google has already crawled all the new pages and included them in the rankings in the time following the conversion.
By the end of 2017, almost 55% of the Top 100 results on Google.co.uk already consisted of HTTPS pages:
The SSL Report
For starters, we enter the domain we want to monitor into the SISTRIX search bar 1.
Then, we click on the menu item Hostnames 2 in the left navigation to check if there are multiple subdomains we need to keep an eye on. To do this, see if any other hostnames have Visibility besides the www. or non-www. host.
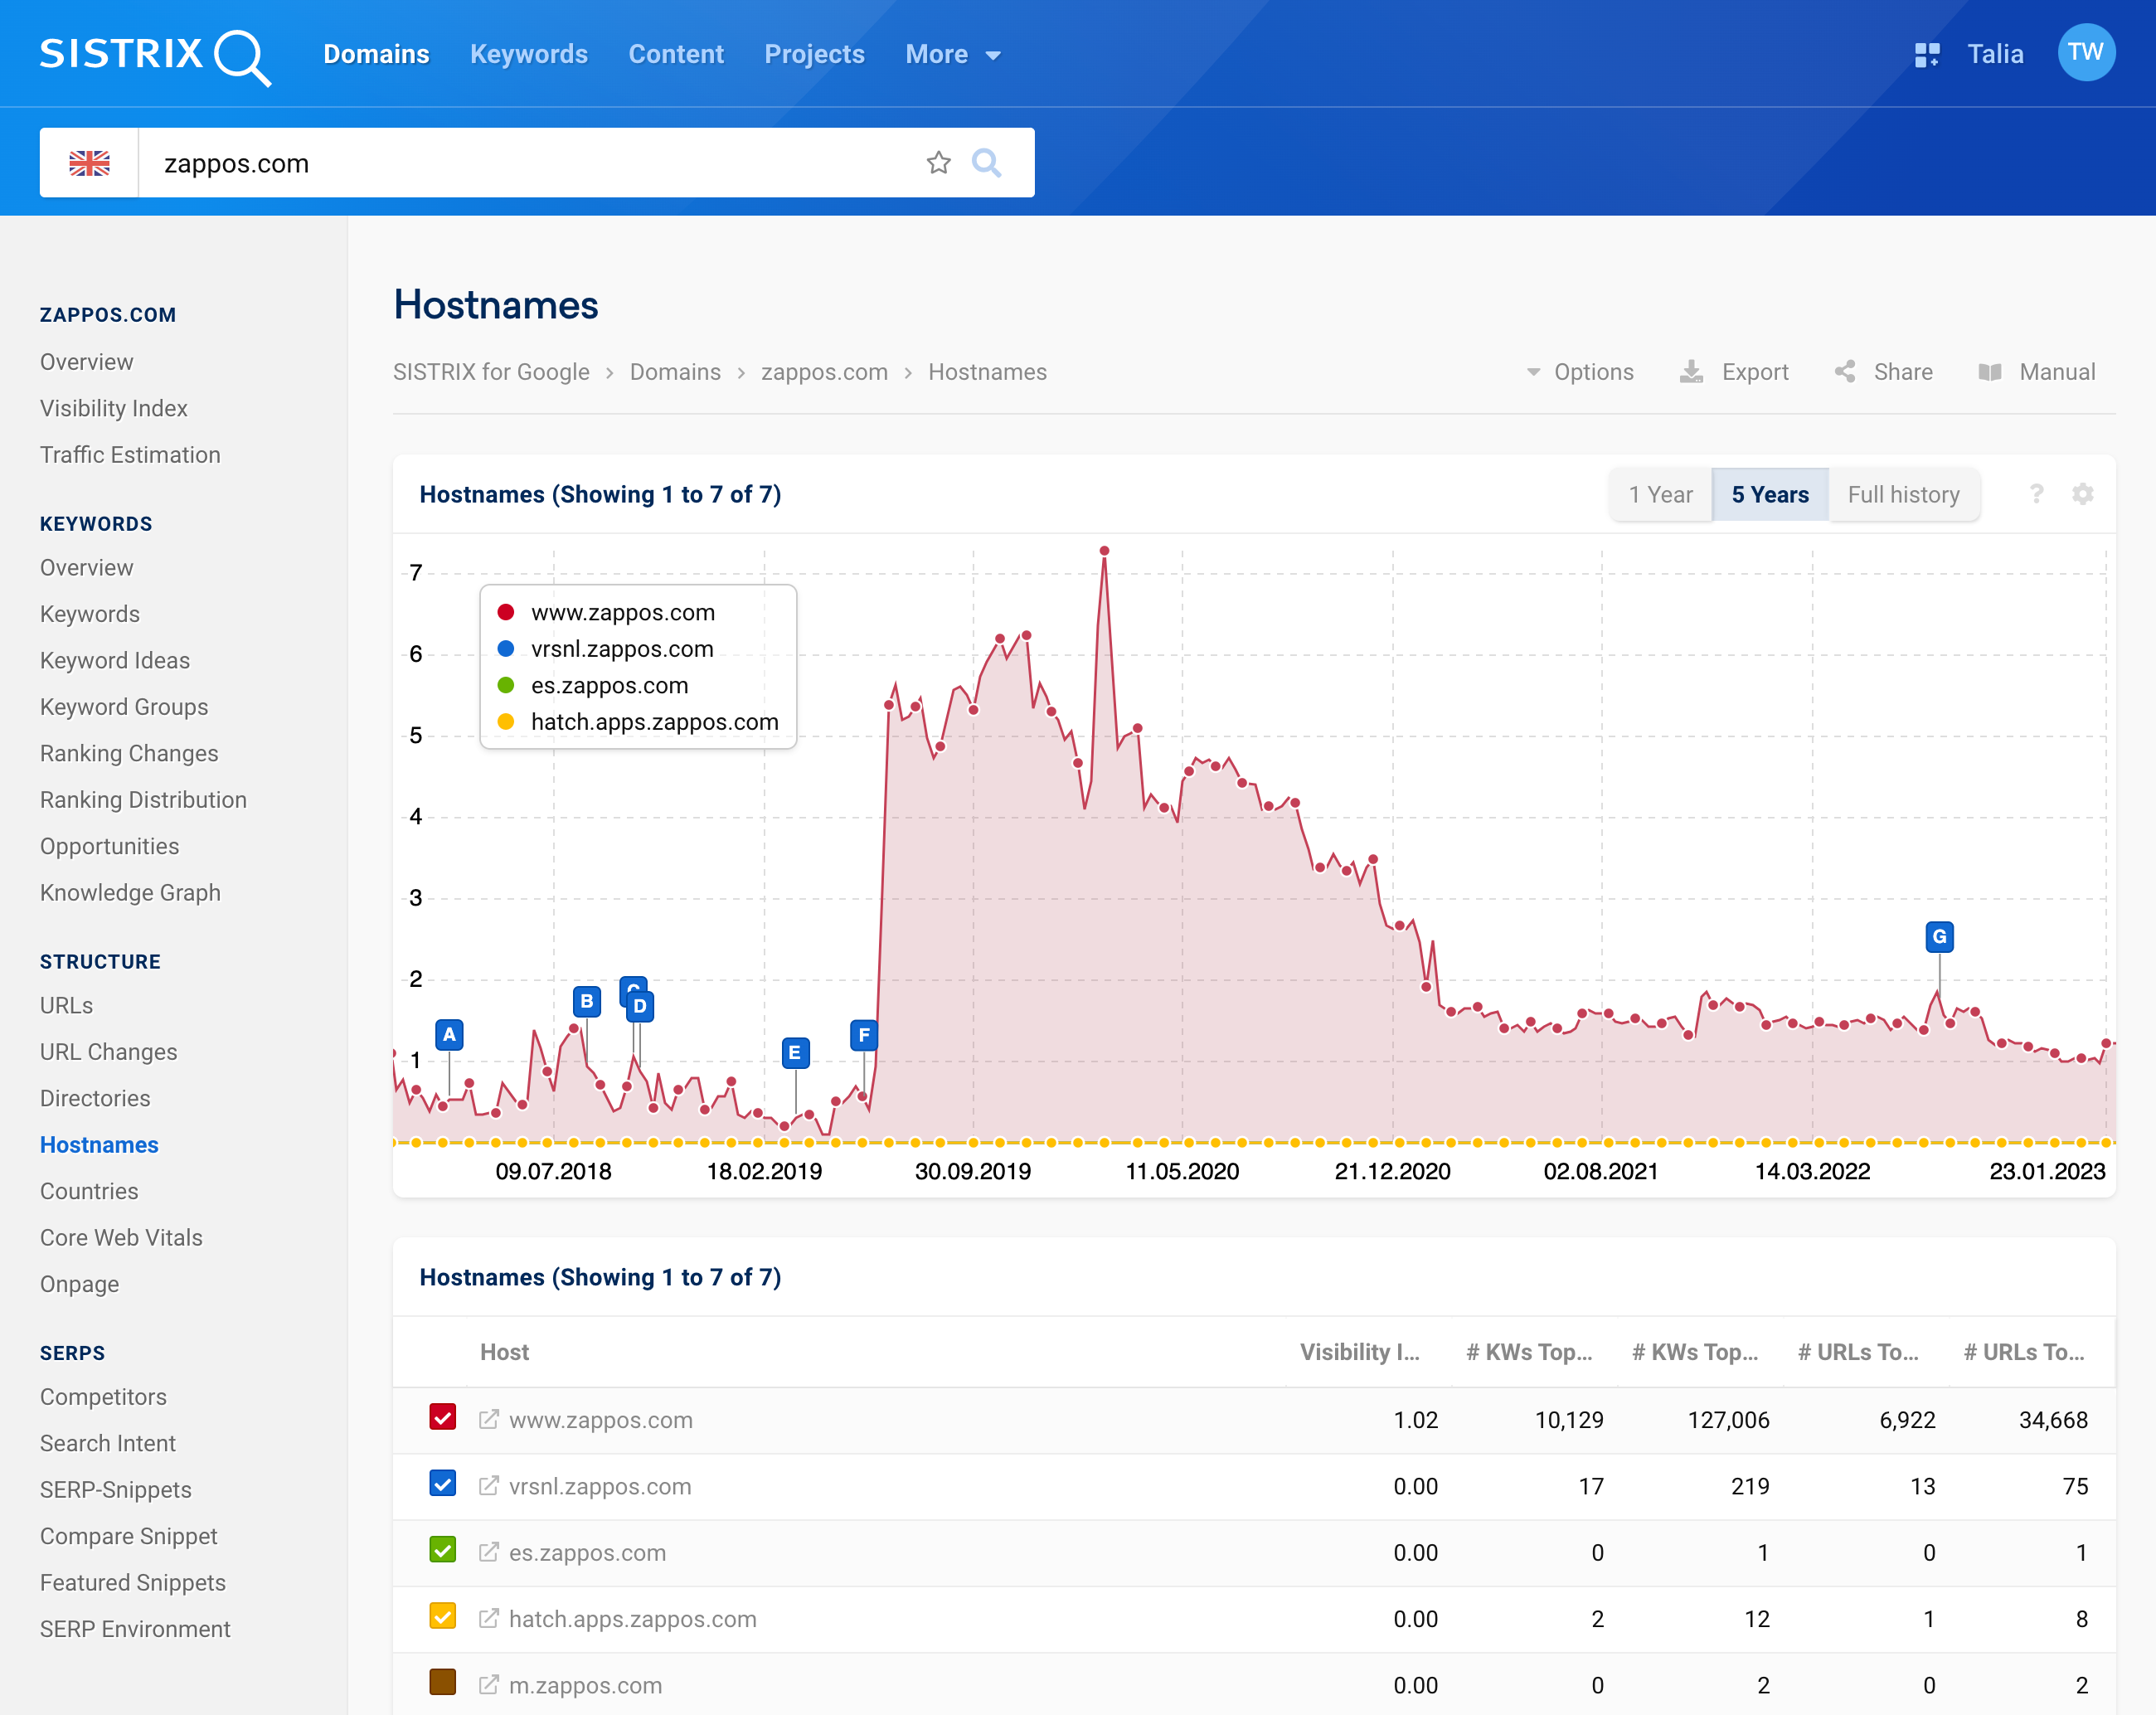
In our example, we will do this retrospectively for the domain zappos.com. In our case, we decide to monitor the top three hosts 3.
Total Overview
Now we can jump back to the domain overview page and click on the cogwheel in the top right-hand corner of the Visibility Index graph, where we choose the “Overlay Data” option.
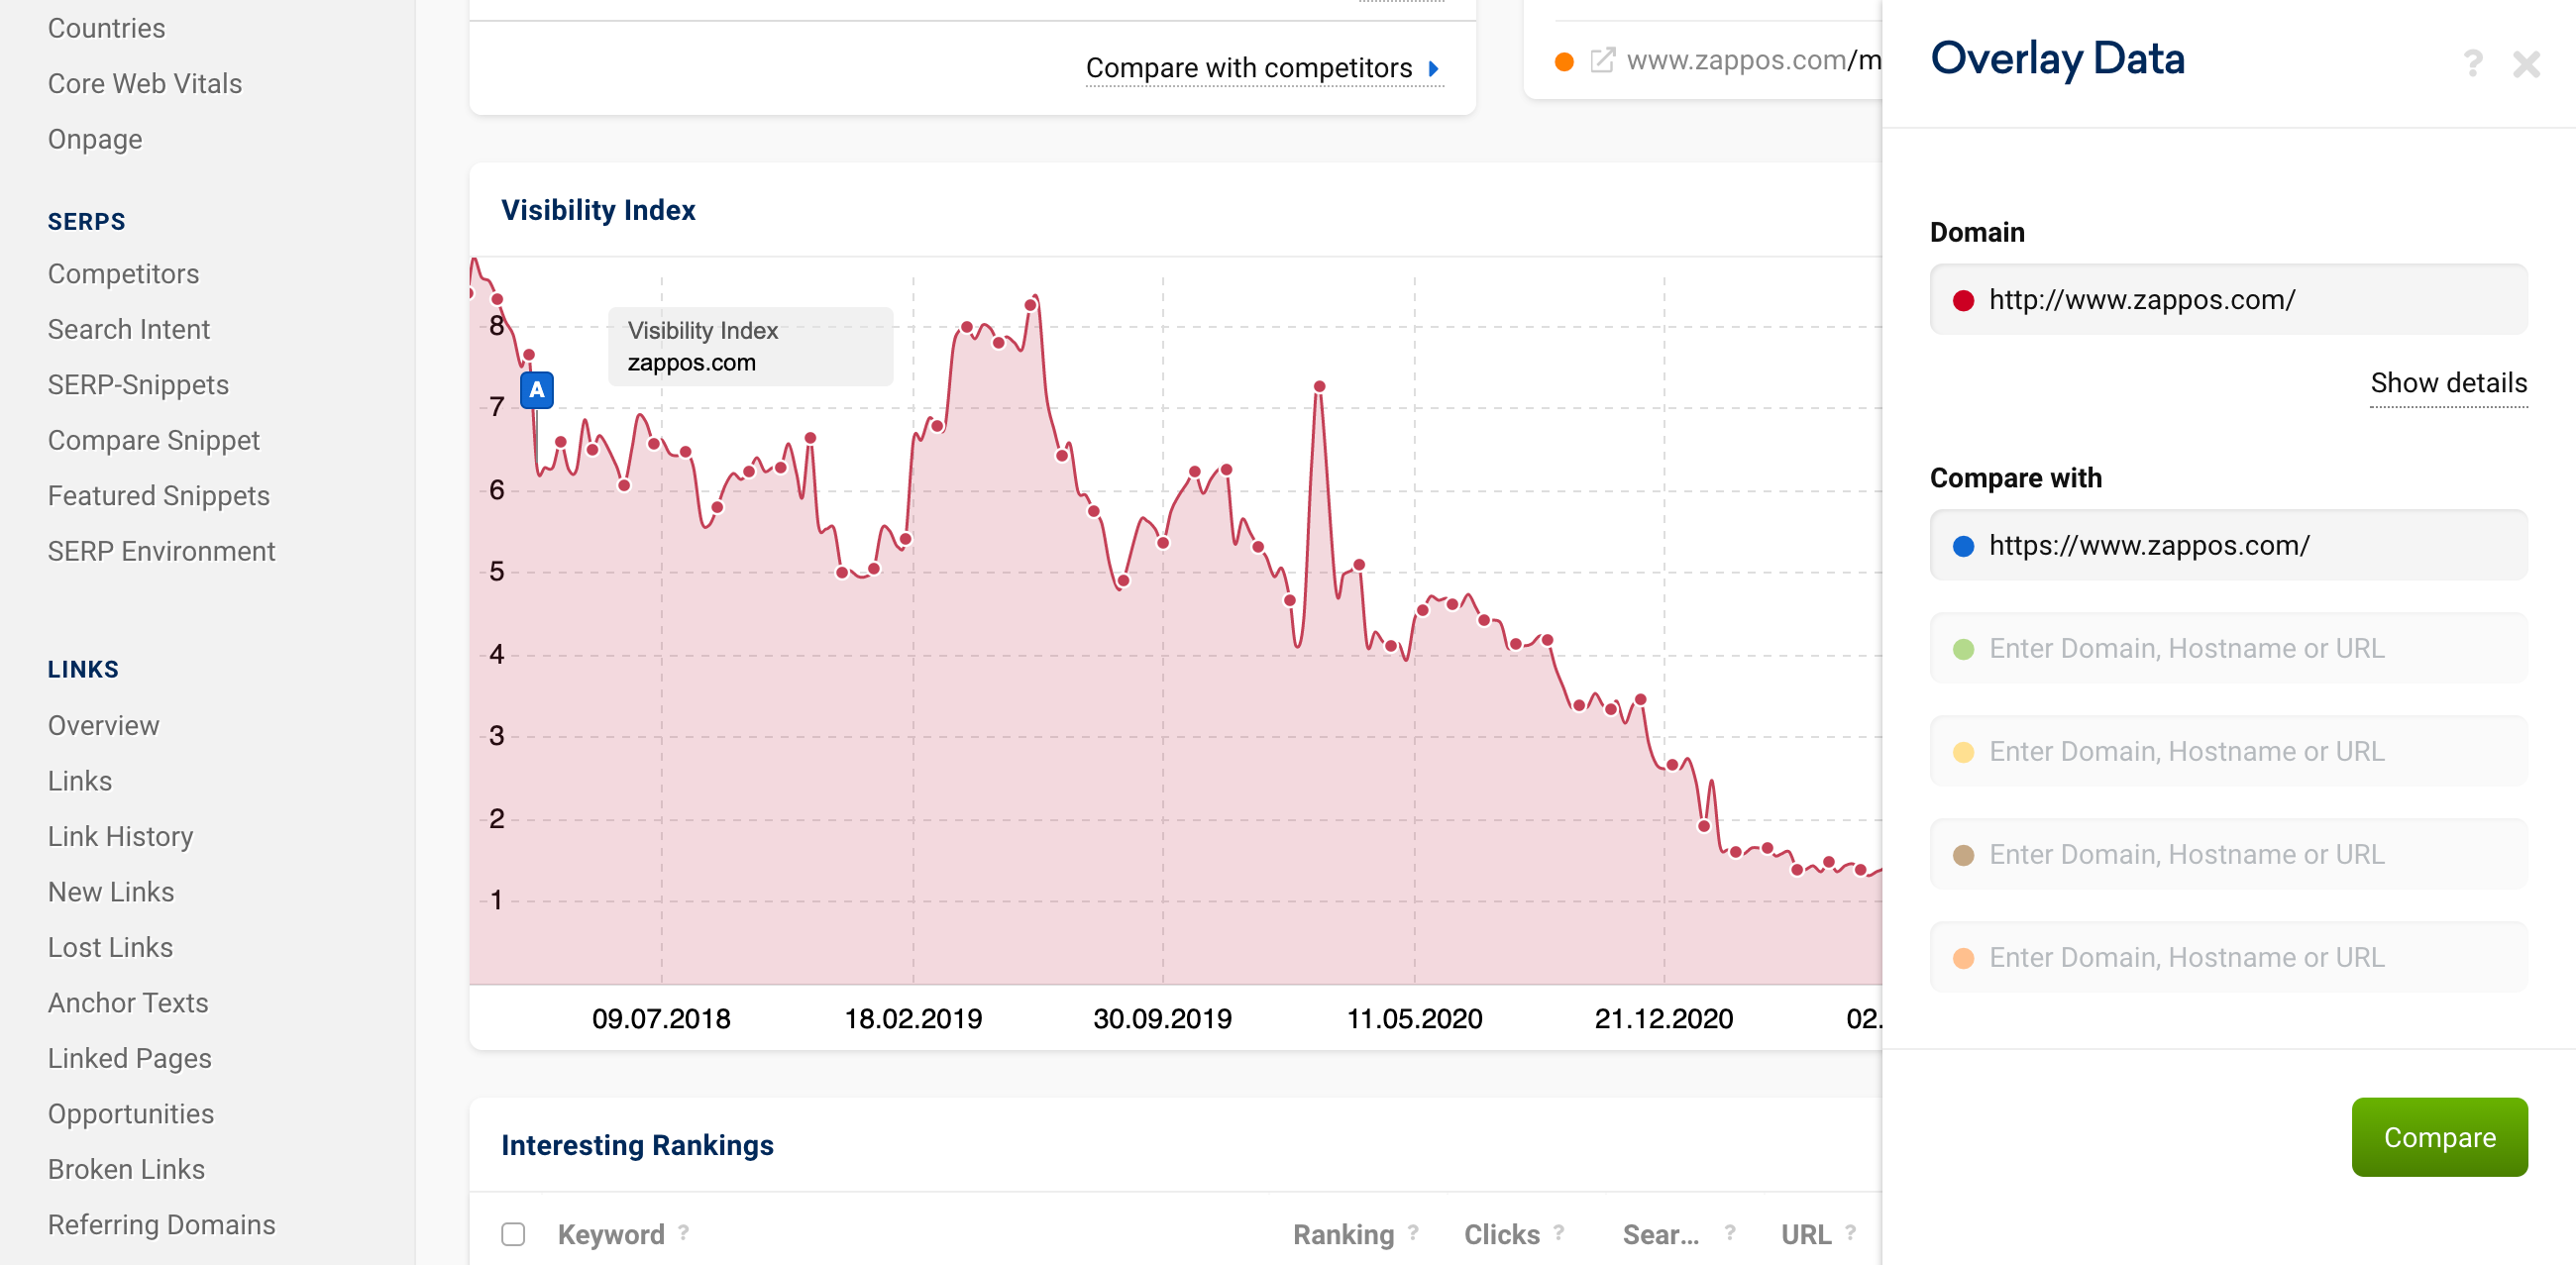
Here, we type in both the HTTP and HTTPS paths for the www.zappos.com host. Here, it is important that the entry starts with the protocol (http:// or https://) and is then followed by the rest of the URL, which ends with a terminating /.
We are now shown the Visibility development for both protocols in one graph. Next, we use the cogwheel, once again, to open the options and select “Add to Report”.
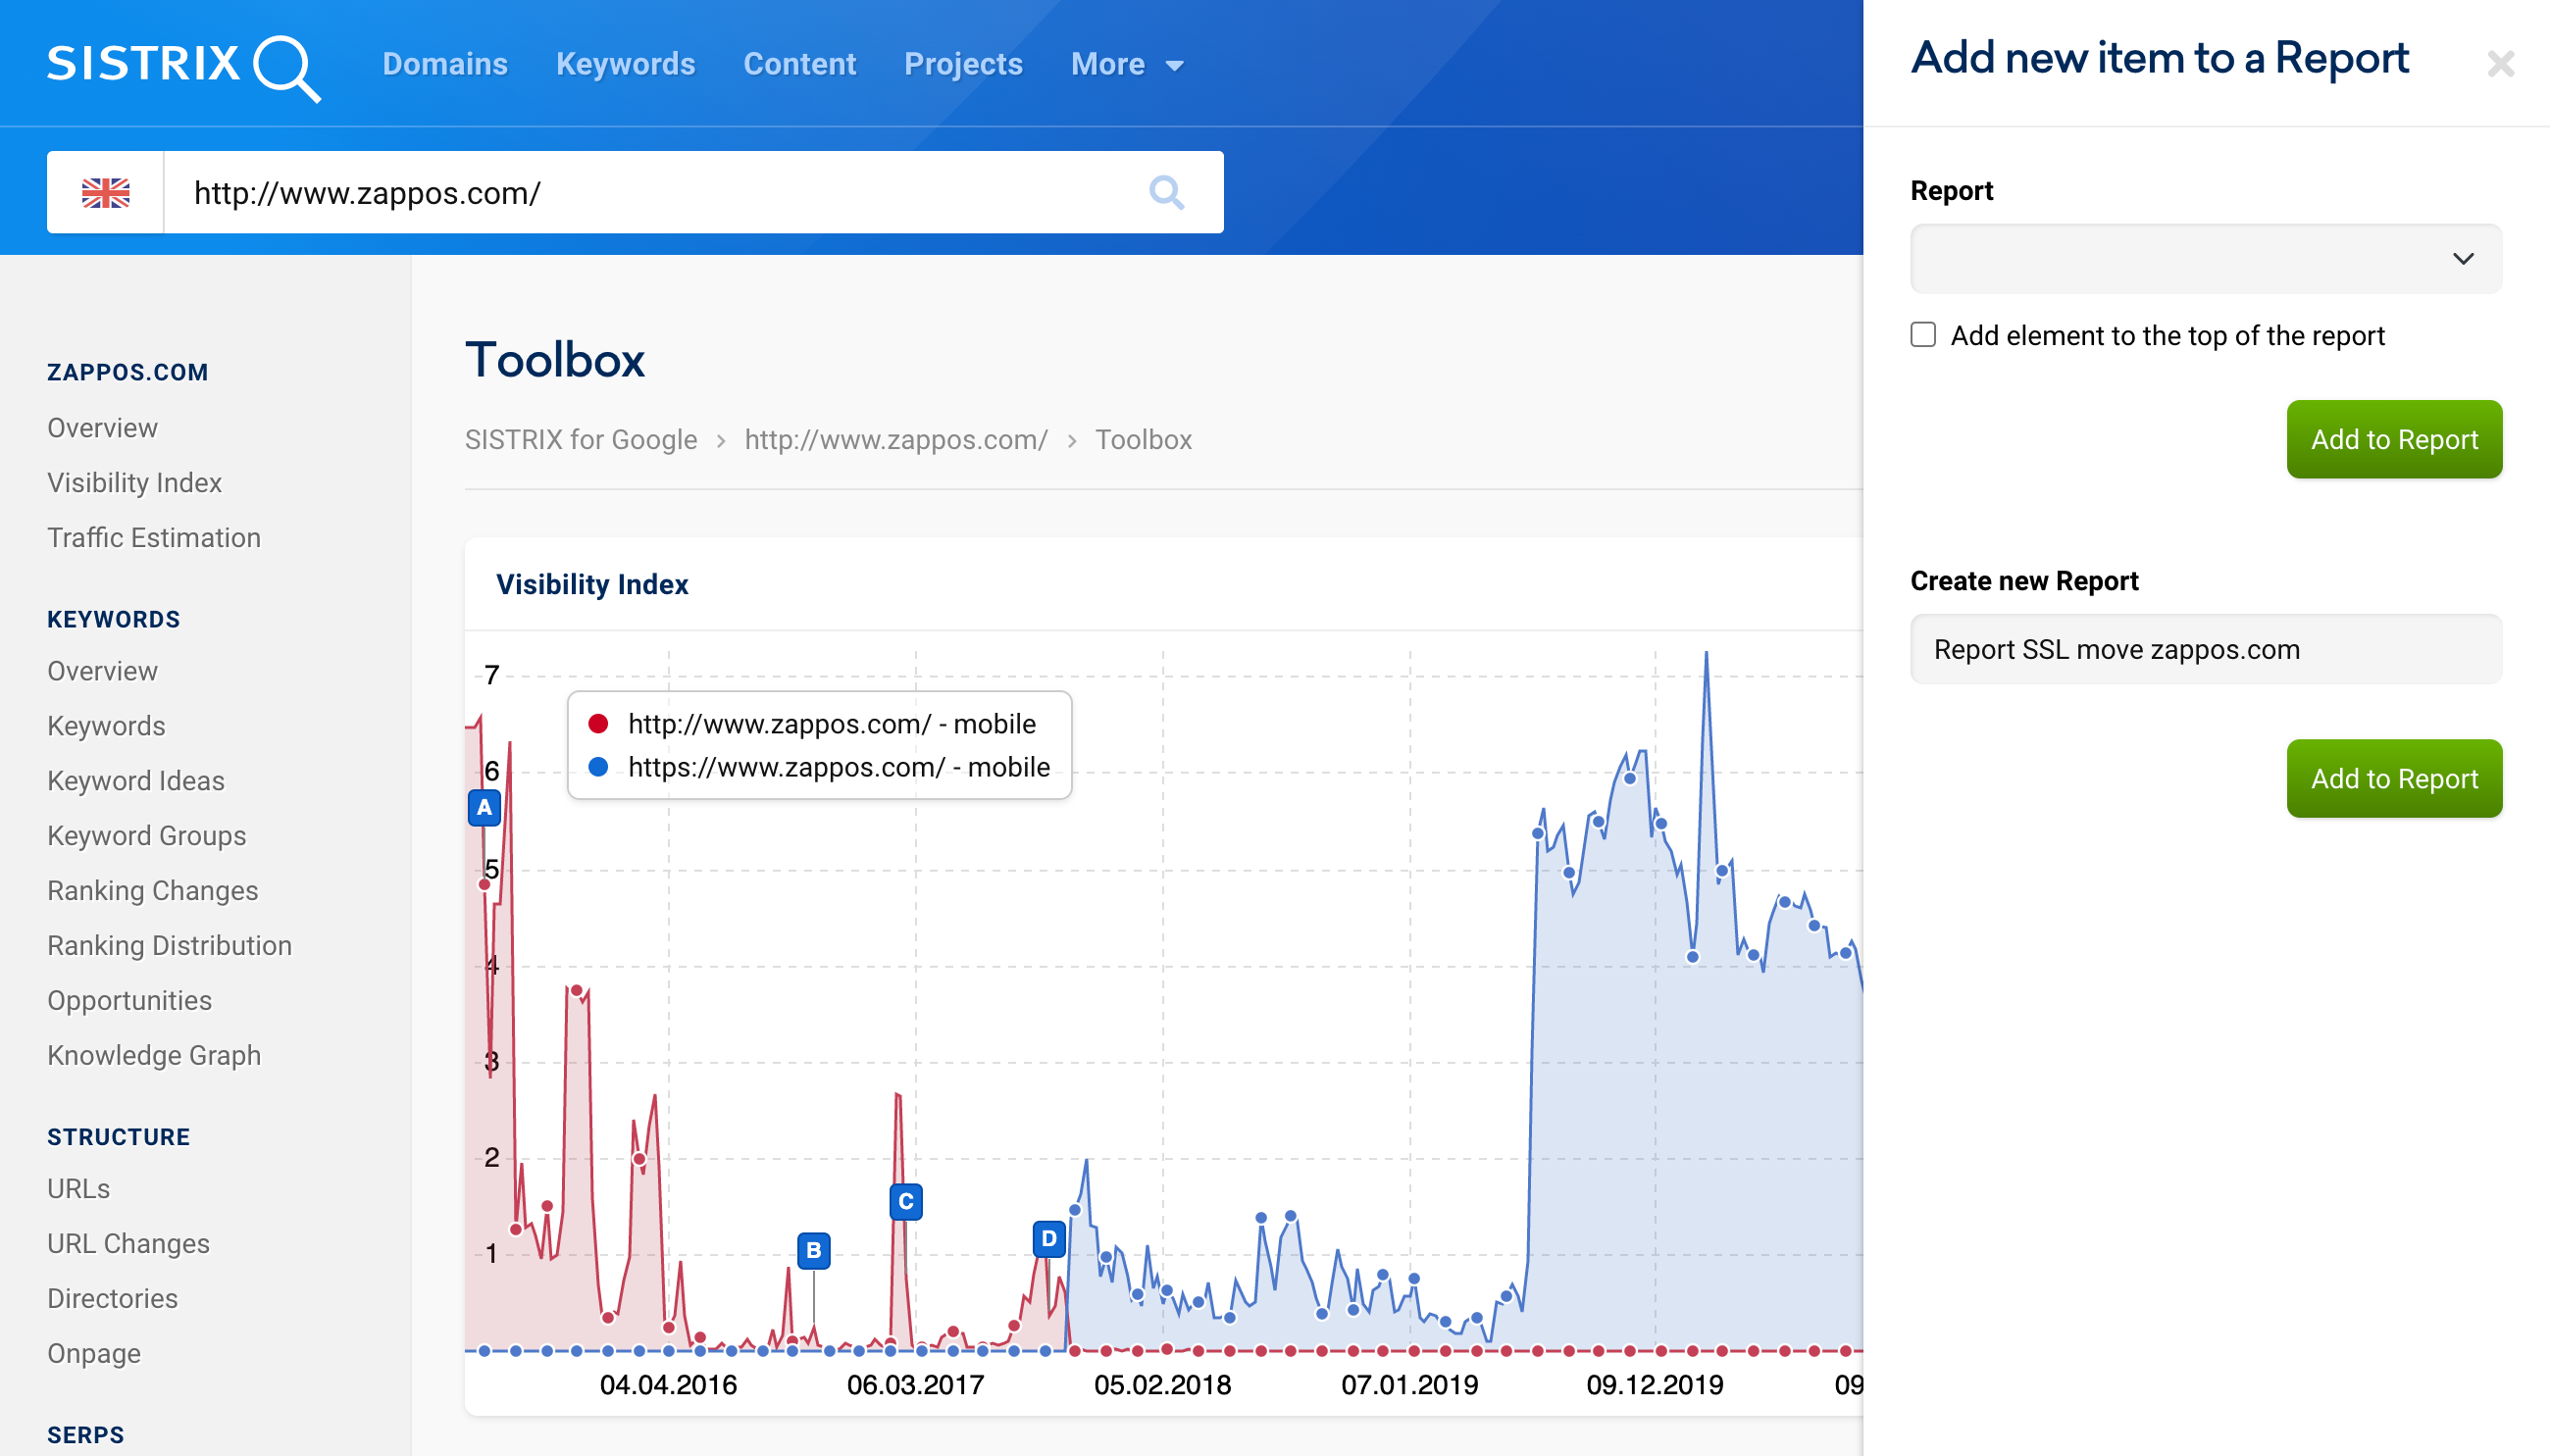
As the report, we choose “Create new Report” and then give it a meaningful title. You can find all information on working with reports in the tutorial How to Create and Configure Reports in SISTRIX.
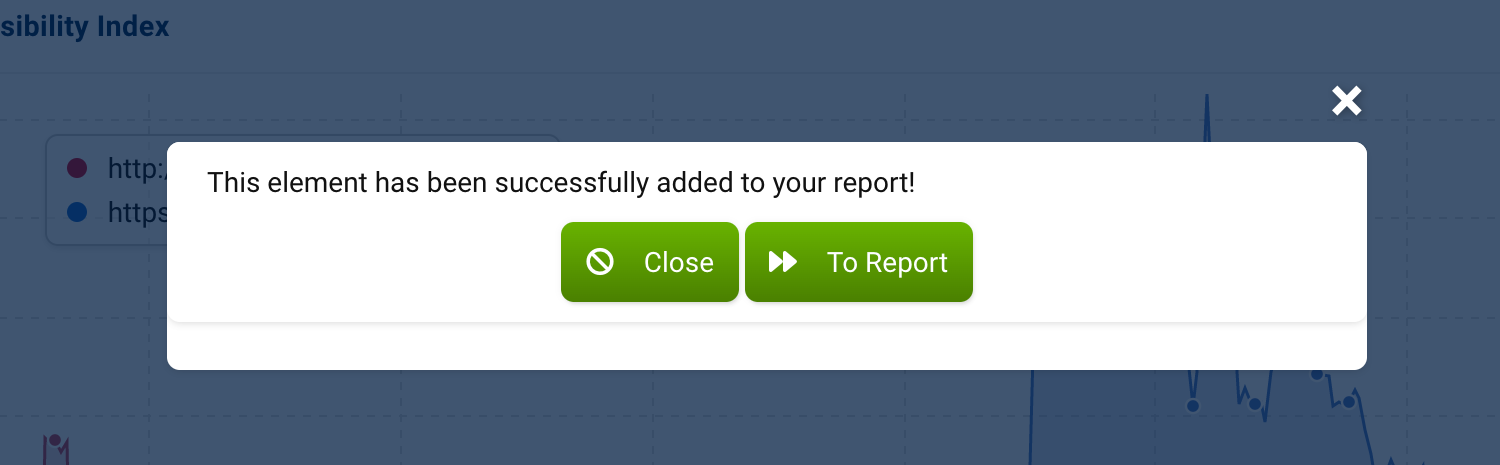
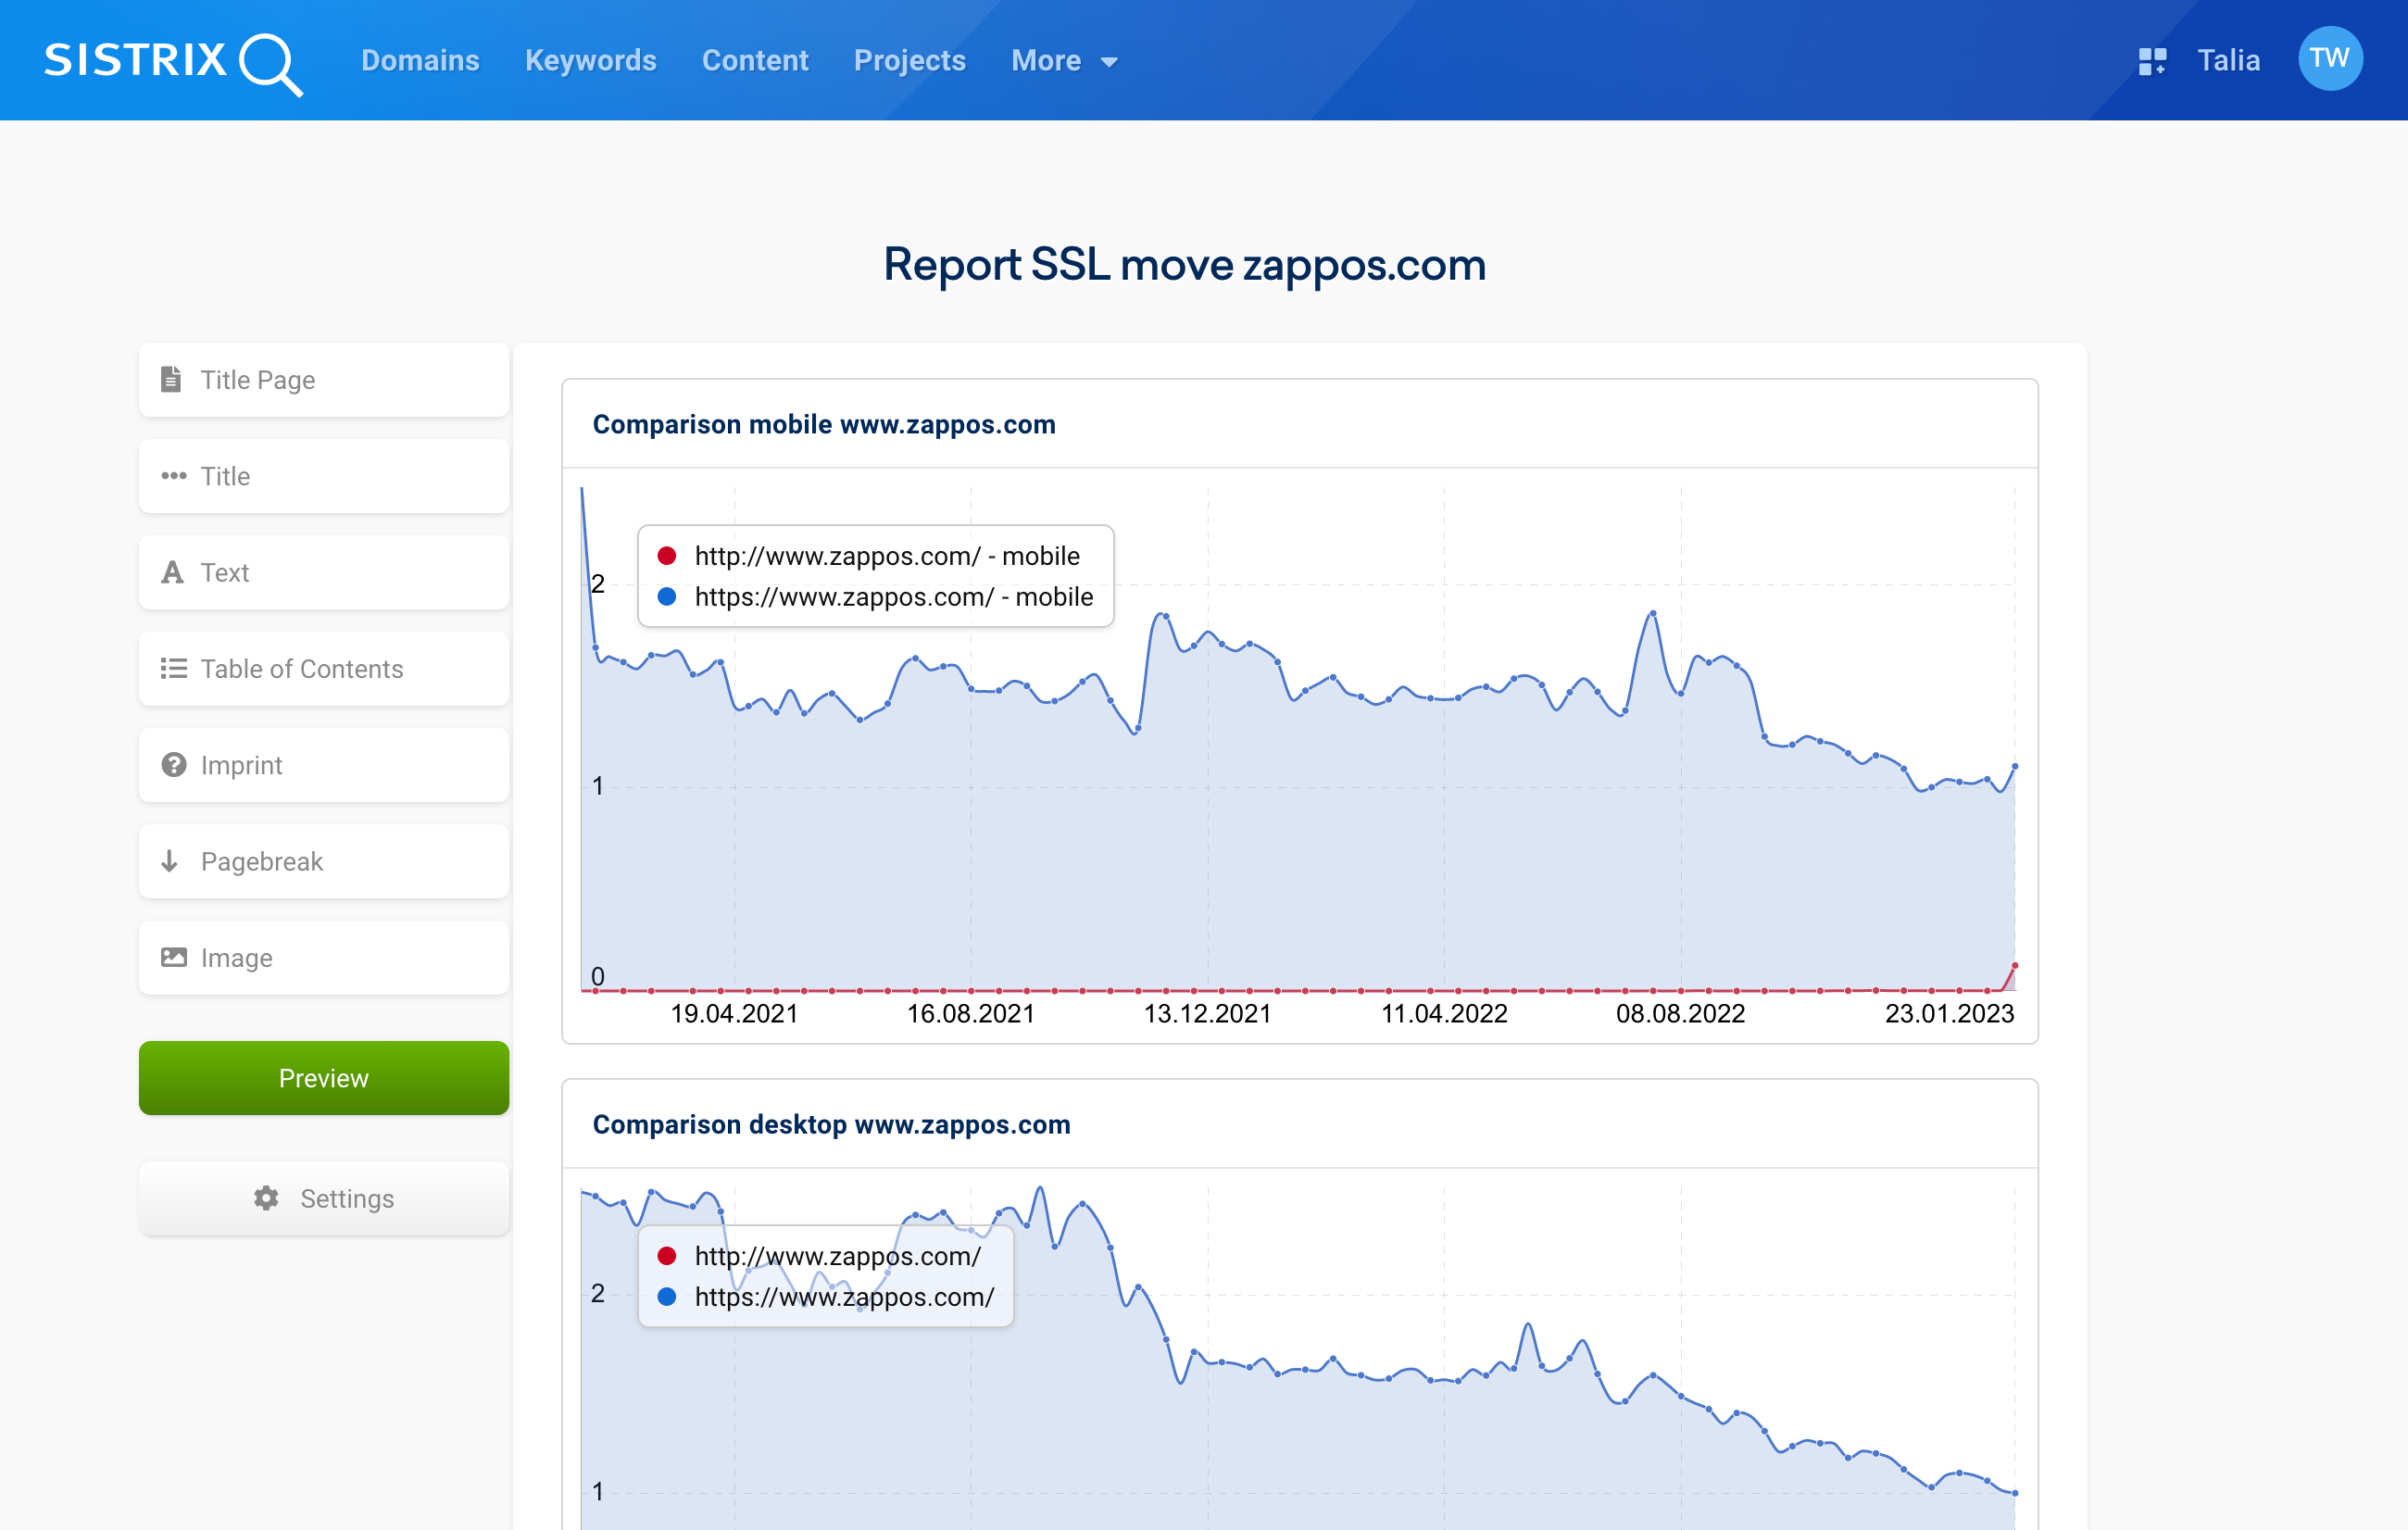
We can open the report directly via the pop-up window. We can also give a data box a concise title via the yellow button with the pencil icon at the top right of the box, as further hosts and directories are to be added to the report later.
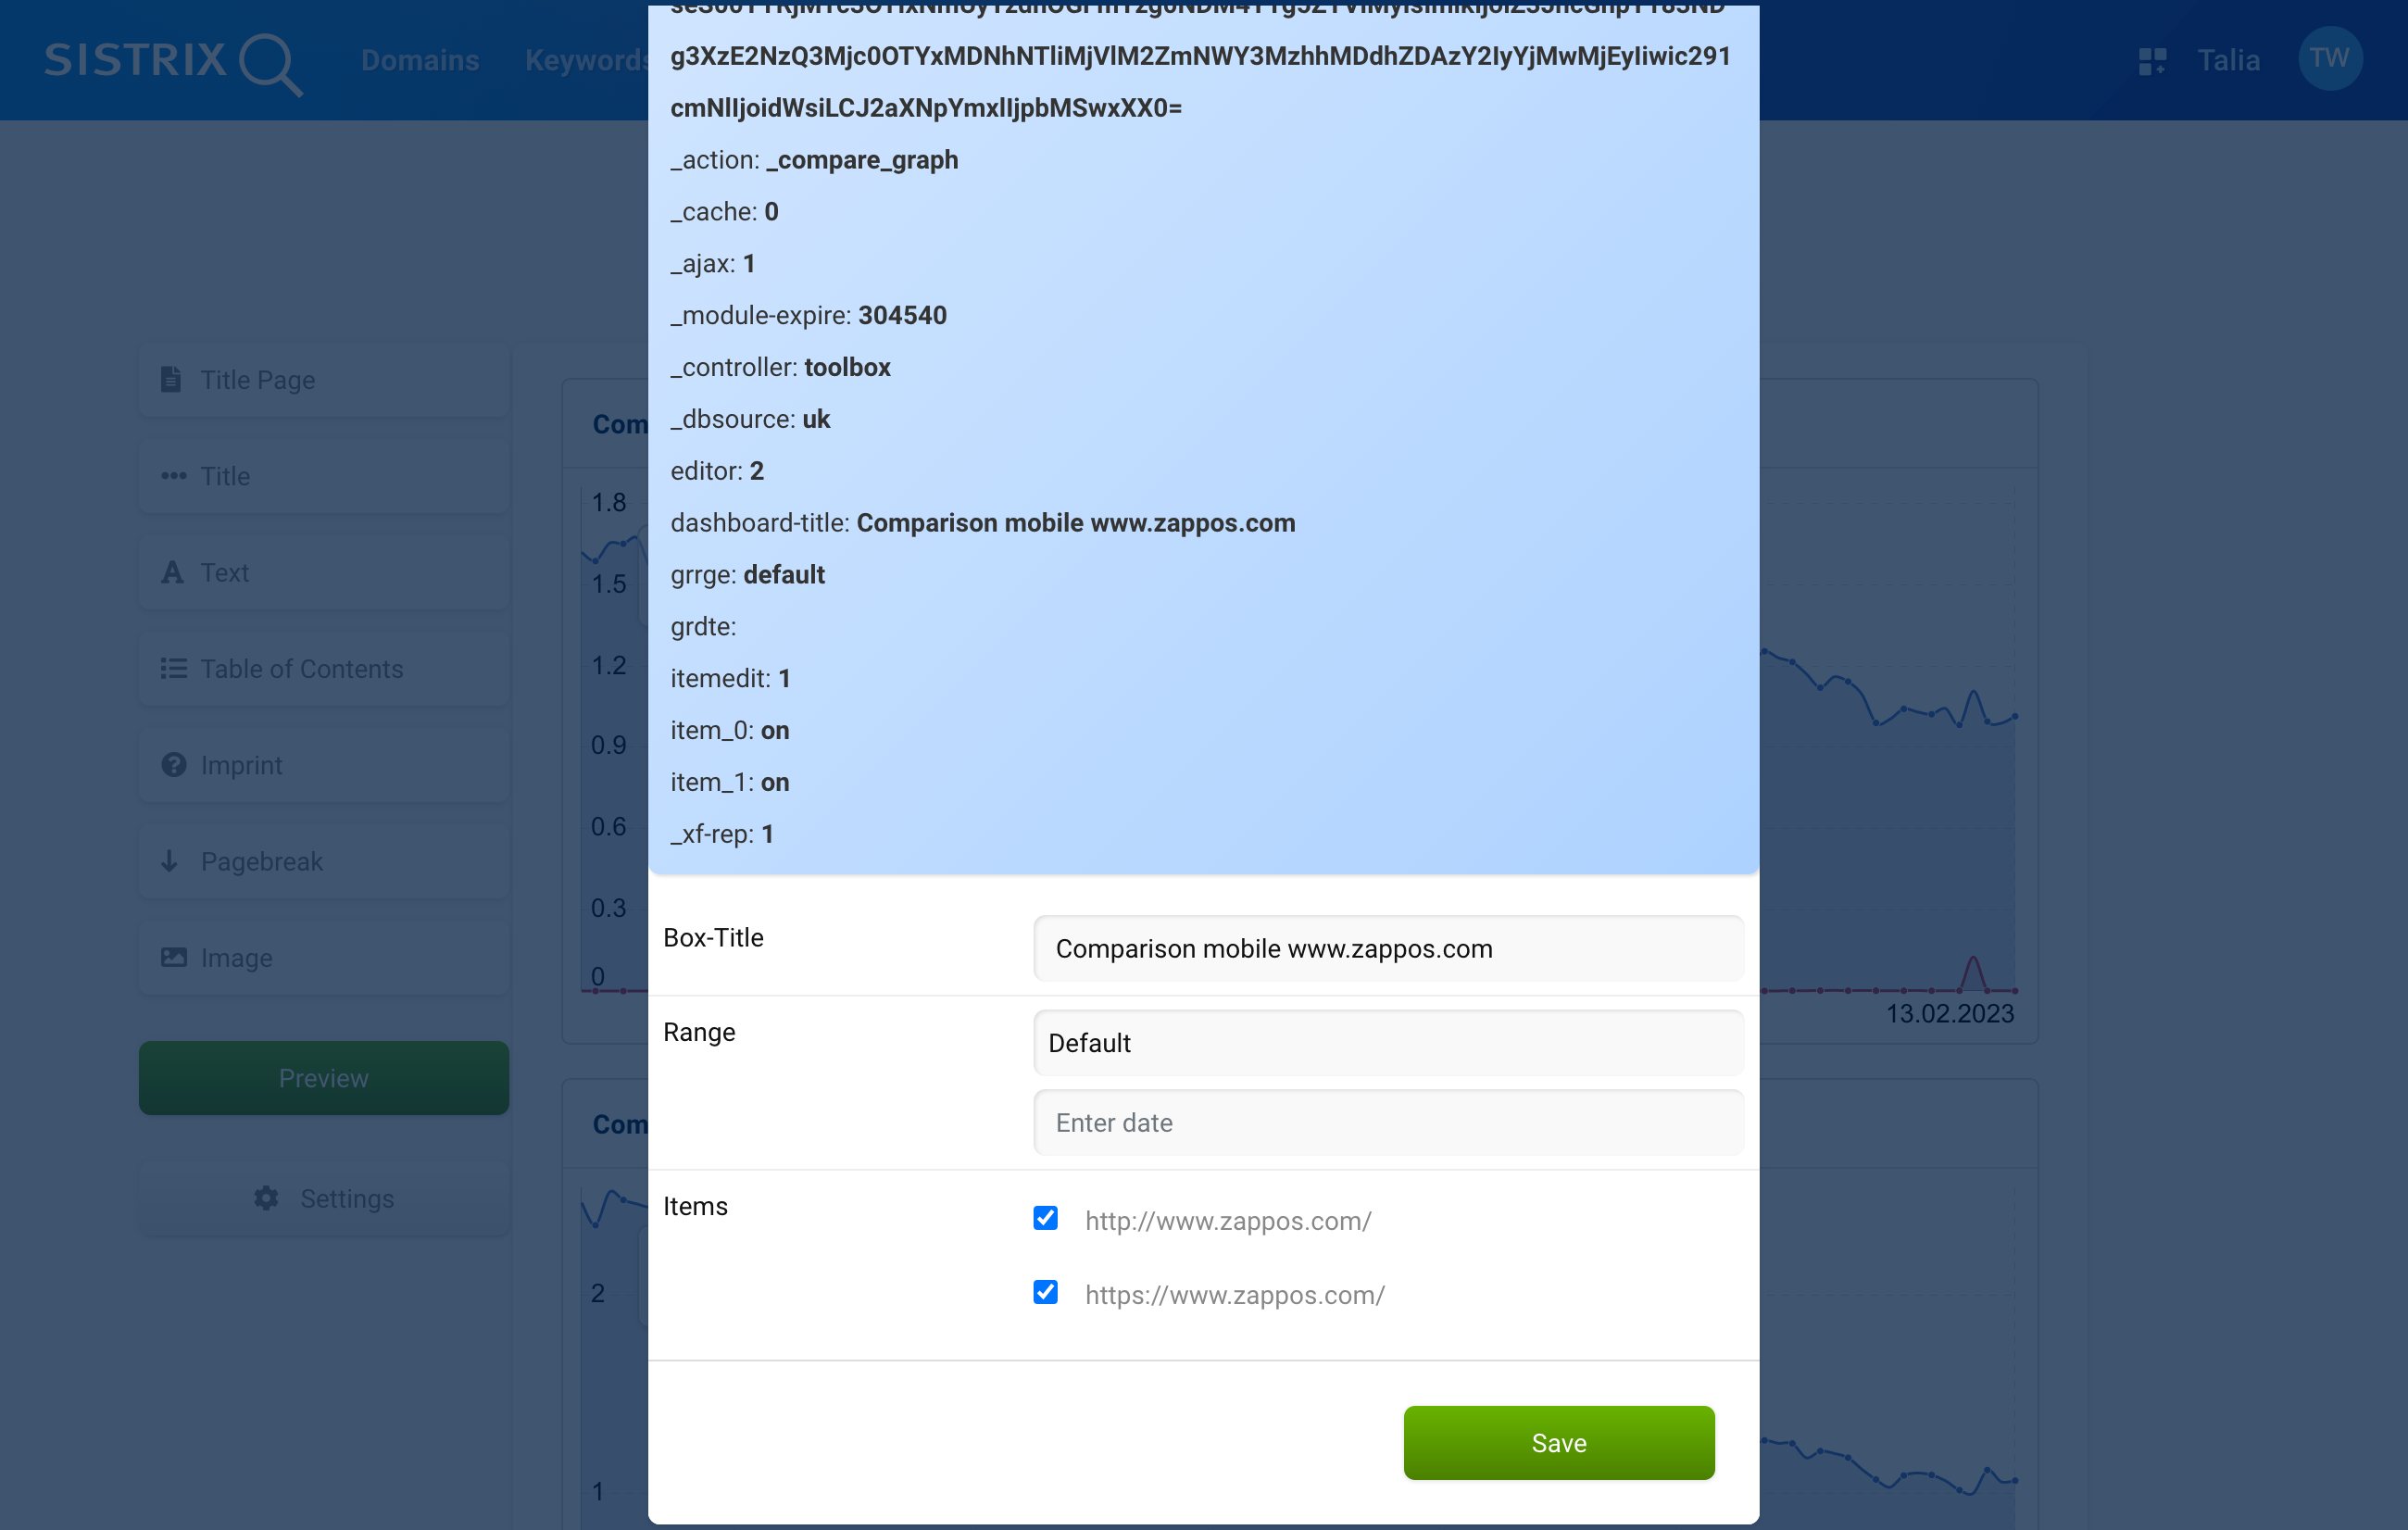
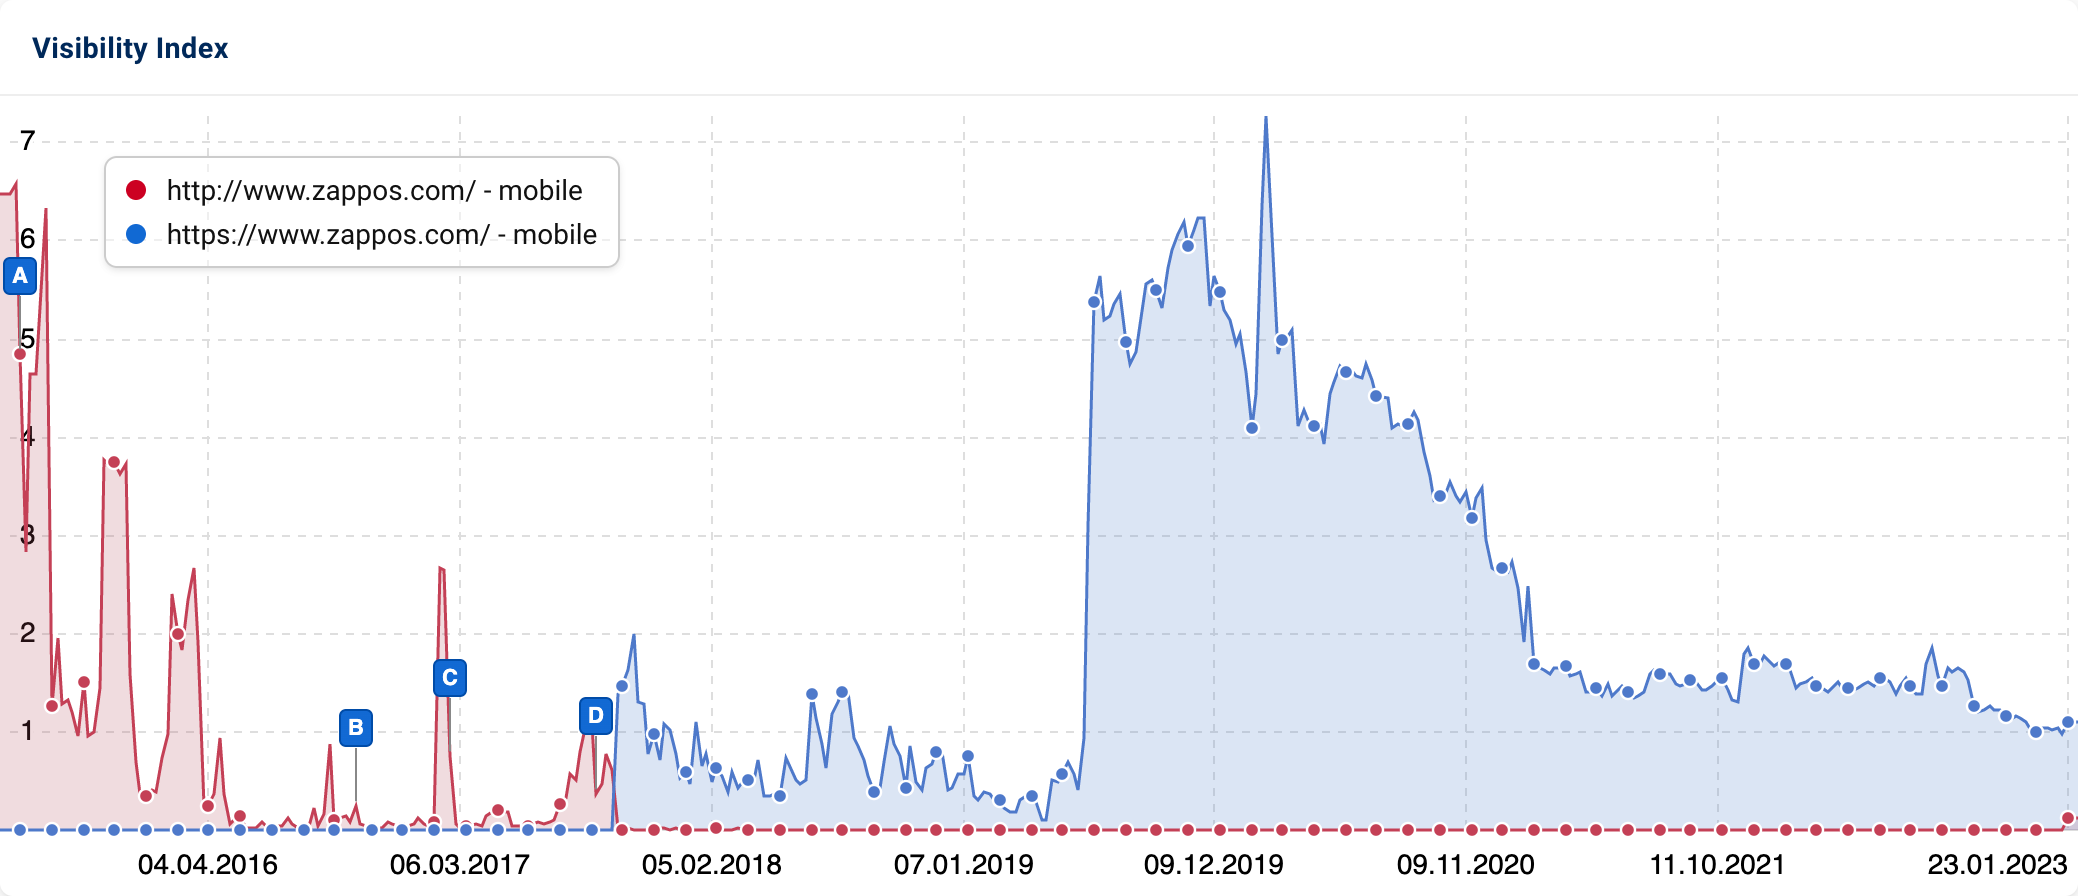
If the switch to SSL of your domain is only just approaching, you can also choose to limit the graph to the last 2 months, for better clarity, by entering a date in the options.
As the search behaviour has been shifting further and further towards mobile devices over the past few years, SISTRIX displays the Visibility history based on mobile data by default. Thus, we have now created an overview of the overall health of the domain in the mobile search.
You can now proceed in the same way with other hosts relevant to your domain.
Overview on Desktop Data Basis
However, we also want to observe the Visibility trend with desktop data and therefore recreate the same evaluation, this time based on desktop data. To do so, we open the Visibility graph in the overview of our domain zappos.com again, click on the cogwheel icon in the top right corner and select “Overlay Data” again.
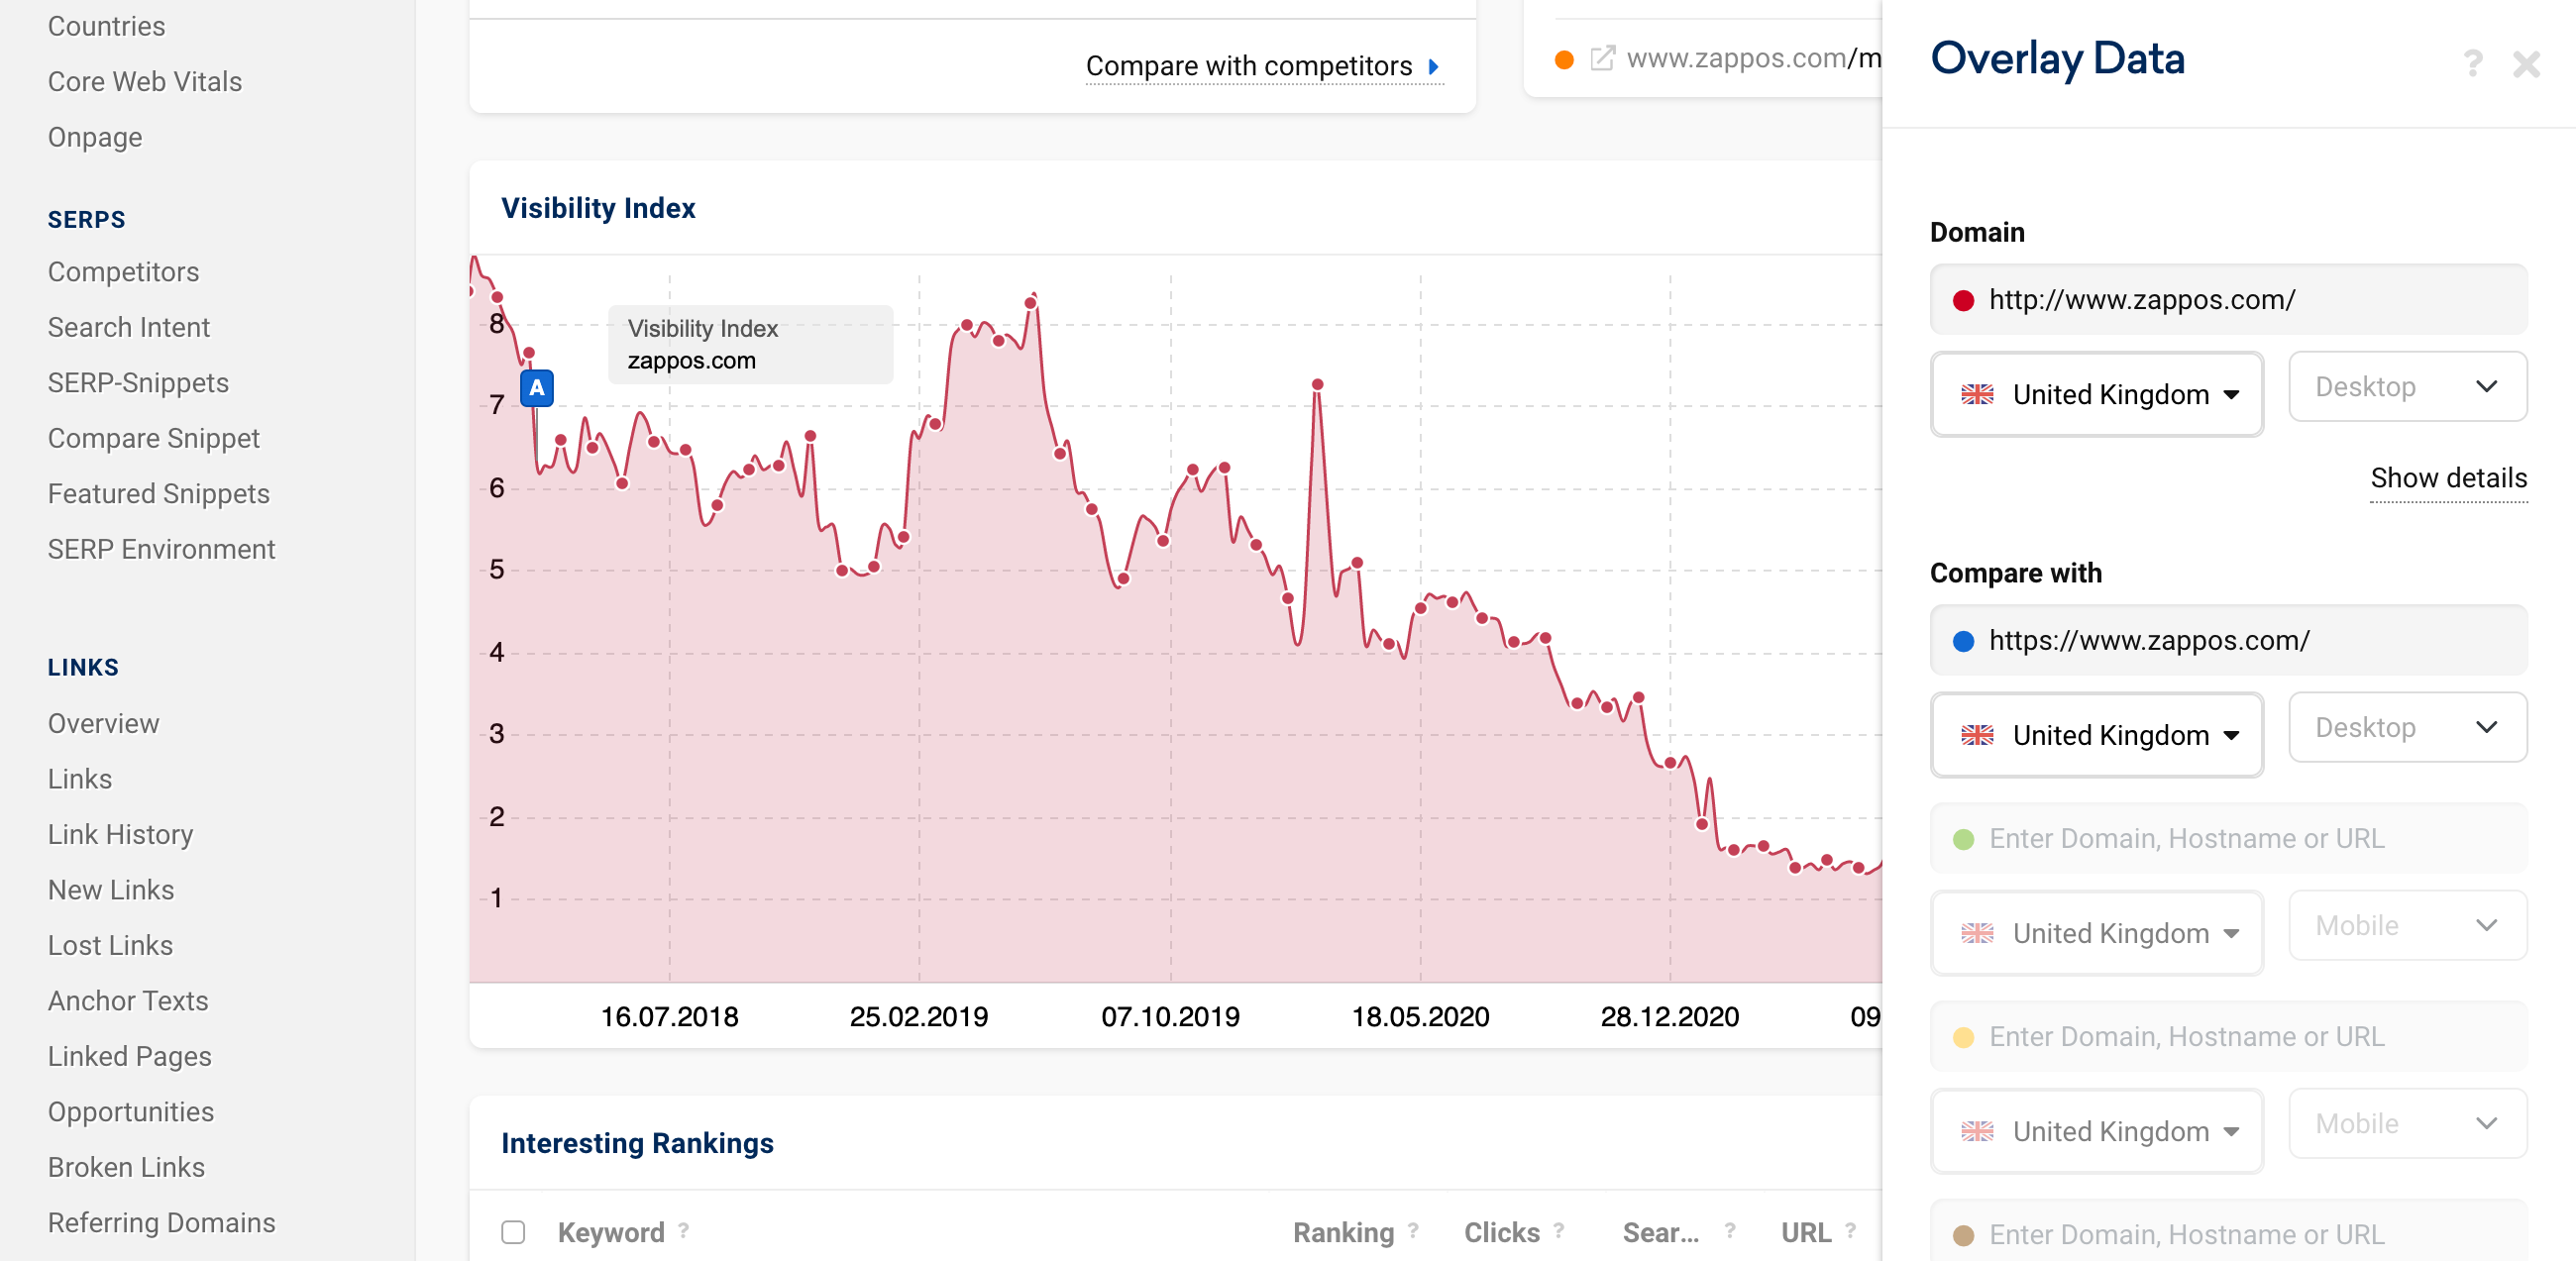
Via the button “Show details” 1 we can now select the desktop data. Just as before, we enter the HTTP and HTTPS URLs and click on “Compare”. We then add the created graph to our report.
We can then adjust the time axis accordingly and give the box an appropriate title (via the yellow button with the pencil icon at the top right of the data box).
Detail View
Our next step is to find the most important directories of the domain and add them to our report. You can either check your Google Analytics data or use SISTRIX for this. To do this, click on the menu item “Directories” in the left navigation.
If the switch to SSL has already taken place, you can also display the directory evaluation for an earlier time. To do this, open the box options via the cogwheel icon and select “Select different date”.
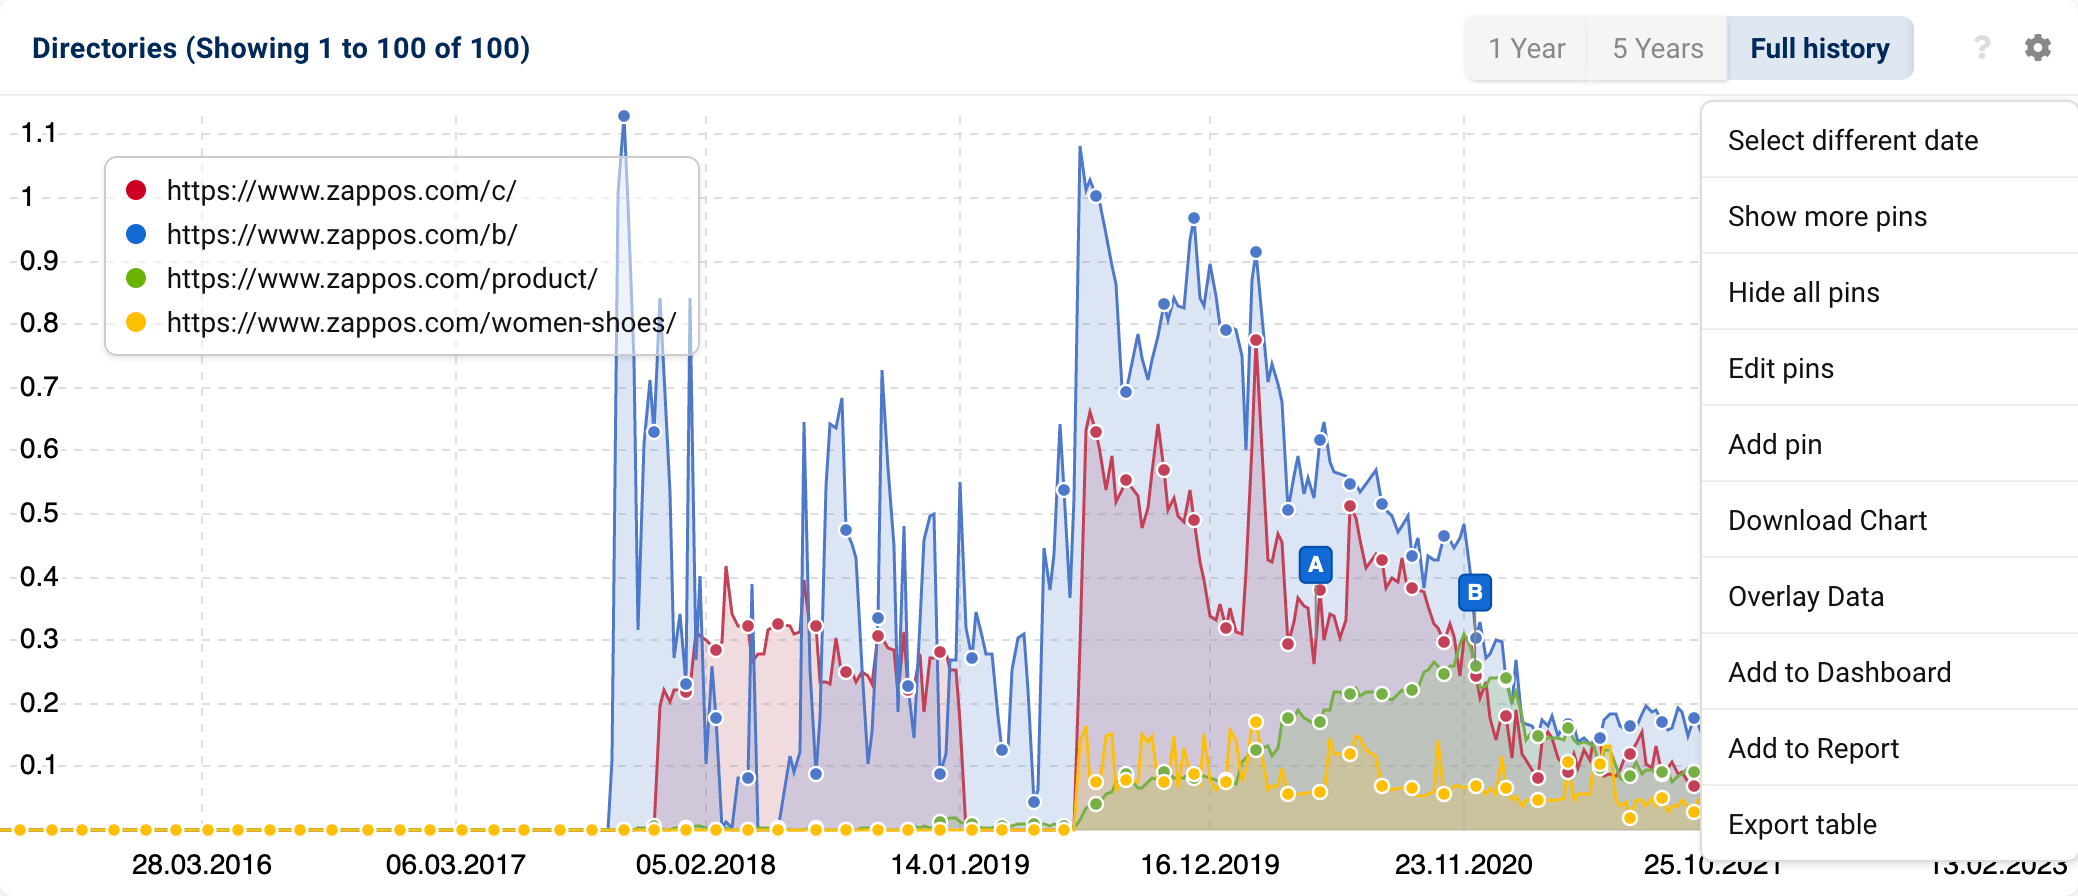
In our example, we will choose to keep track of the development of the three directories /c/, /b/ and /product/.
We proceed exactly as we did for the overall view and create a comparison graph for each directory for desktop…
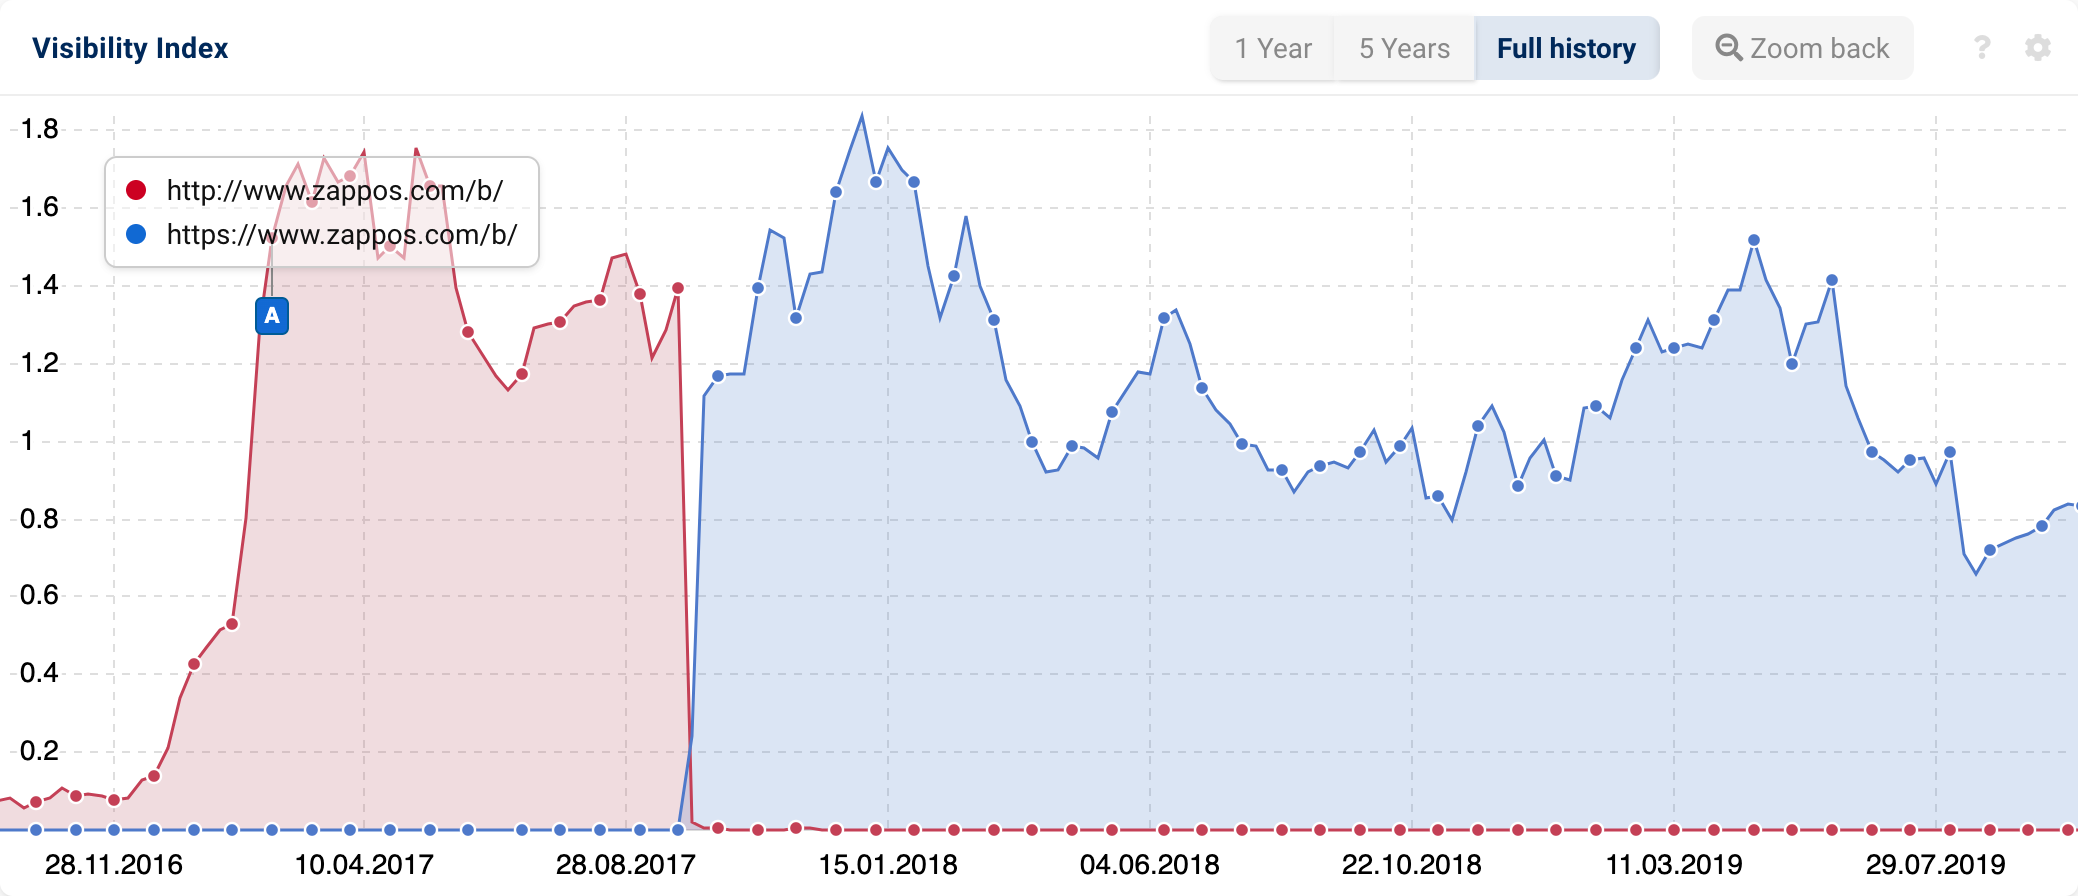
… and mobile.
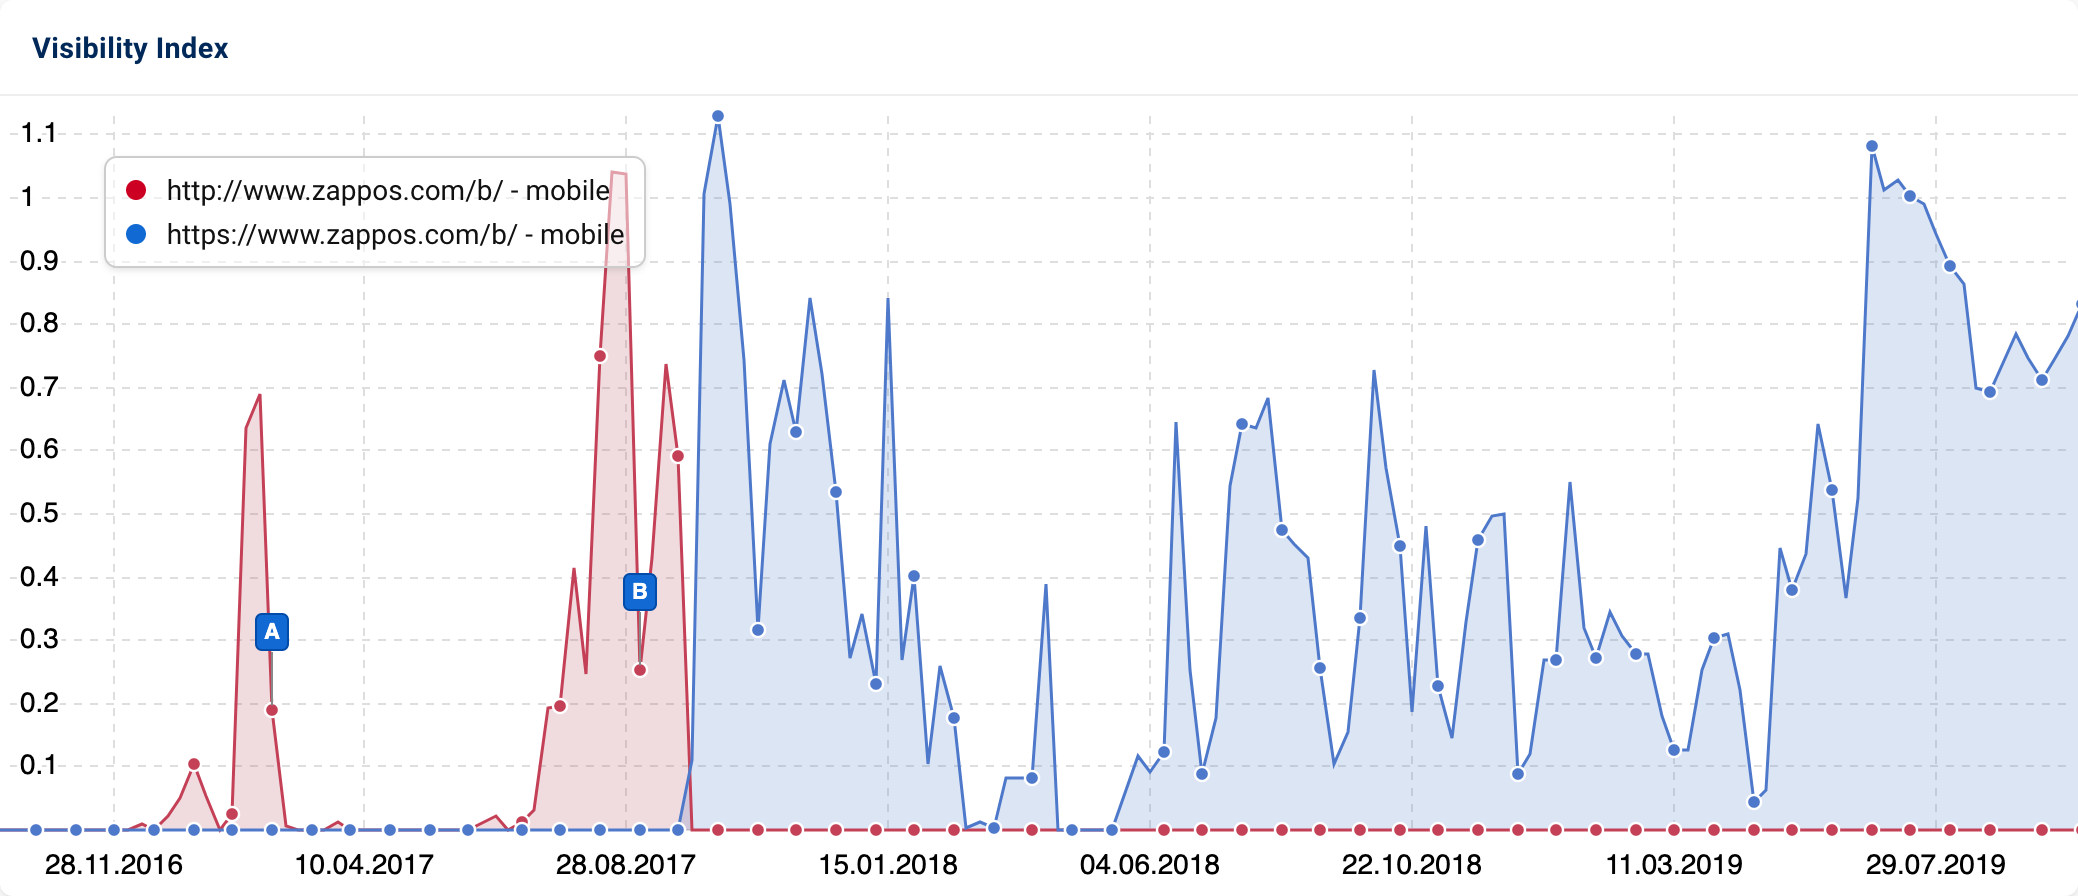
If there are many directories that you want to monitor, you can collect all the desktop and mobile evaluations together in one single graph.
Explanatory text elements can also be added to the report now. This makes sense if several parties are supposed to access the report. You can use free-text fields to explain what information the report contains and how it is to be interpreted. You can find further information on the design options of reports in SISTRIX in our tutorial “How to Create and Configure Reports in SISTRIX“.
Automatic Dispatch of the Report
Once you have customised the report according to your wishes, you can conveniently have it automatically sent to you and other people once a week. The automatic dispatch also saves the reports in the archive so that you can easily track changes for a specific week at any time.
The Technical Check in the Optimizer
Immediately after the SSL move of your domain, you should check whether all pages can still be found via redirects. If you have not yet created an Optimizer project for the domain you want to monitor, look at our tutorial on how to create an Optimizer project and create one.
In the project itself, you can use the available filters to check two important technical conditions: Are there still HTTP pages without redirects and are there internal links with redirects?
HTTP Pages Without Redirects
Ideally, after switching to HTTPS, there should be no HTTP pages on your domain which return a status code 200 (OK). All HTTP pages should refer to their HTTPS counterpart by using a 301 redirect.
To verify this, open your project and select the item “URLs” under “Expert Mode” in the left-hand navigation. Use the green button “Filter Now” to create a URL filter “Contains the text” “http://” and an “HTTP status code” filter for “Does not contain the text” “301”.
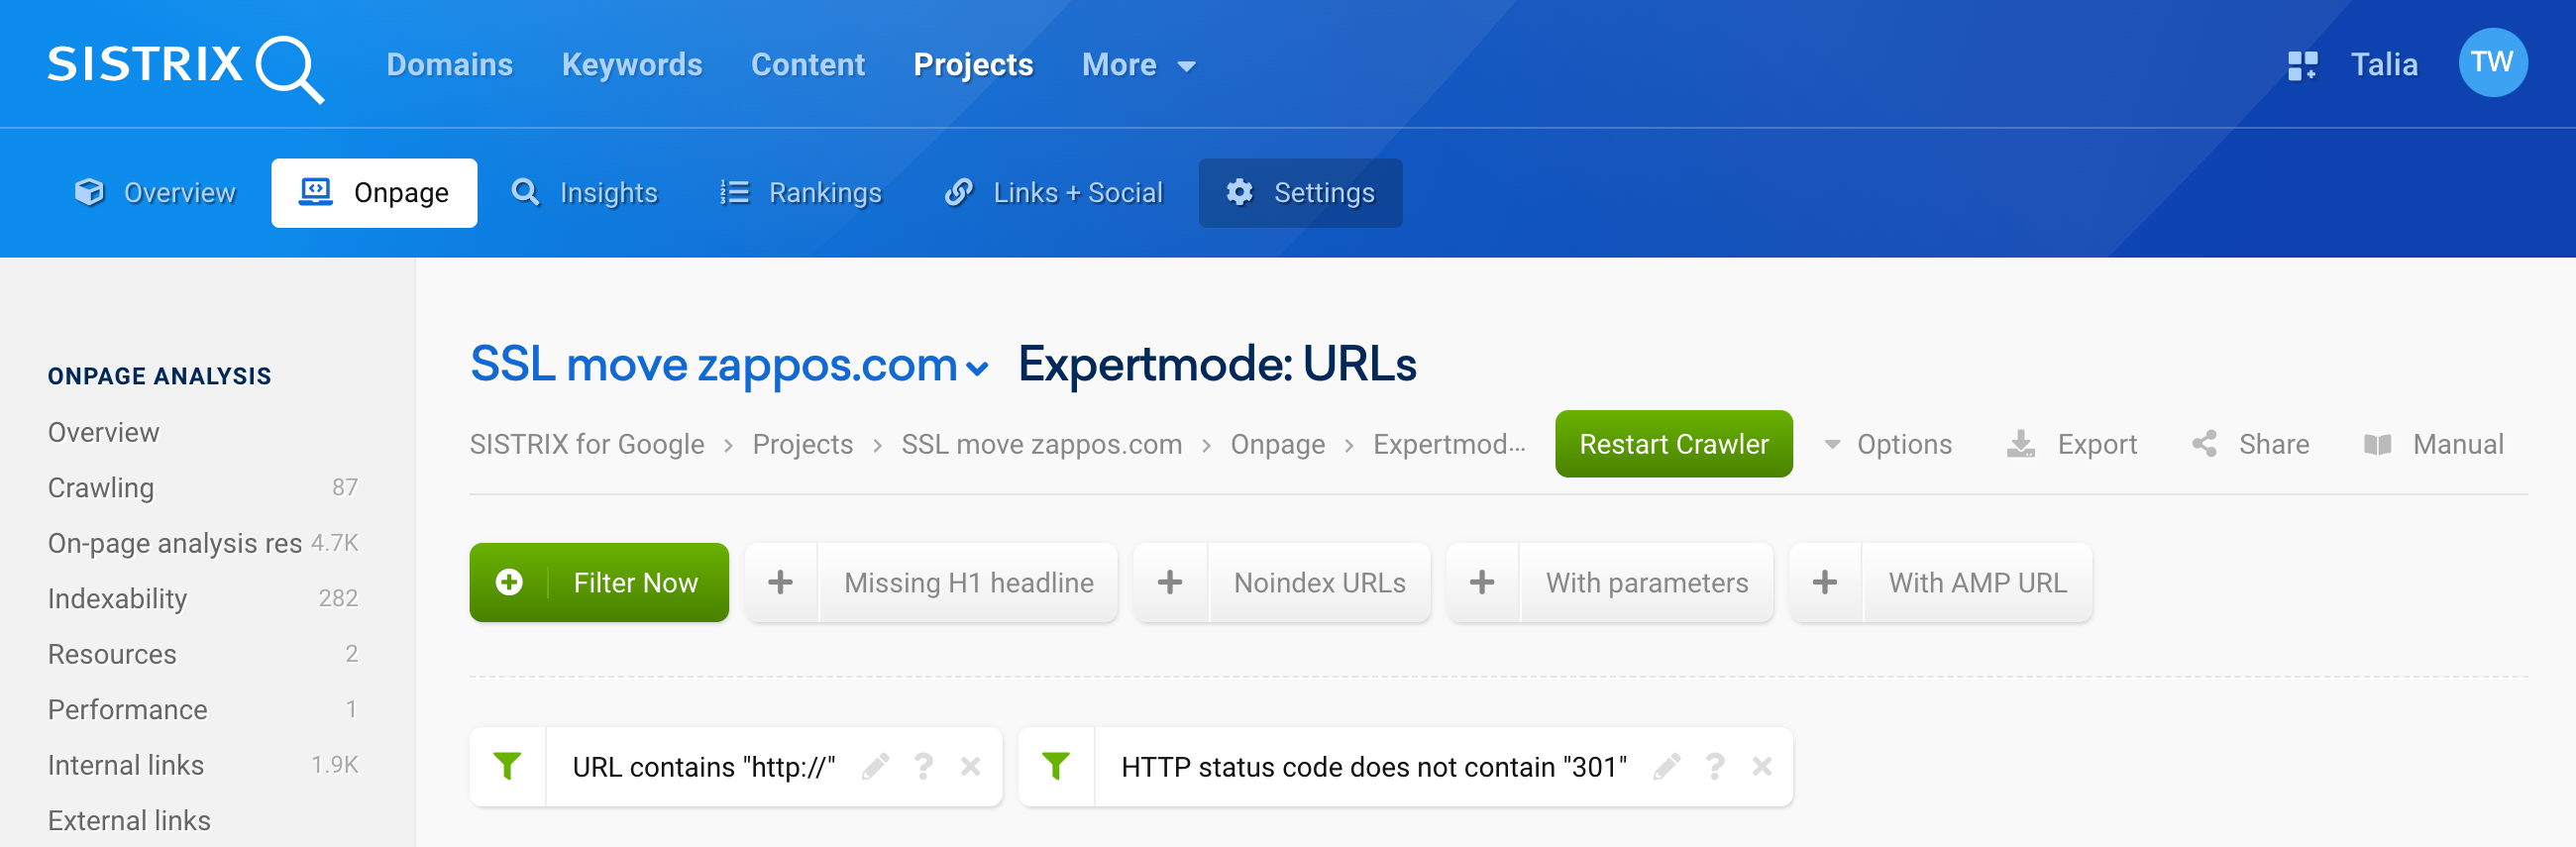
This will return a list of all URLs of the domain found during the crawl which use http:// in the URL, and output a status code other than 301. In this list, you will now find all URLs which have not been redirected correctly (or not at all in the case of a 404 or 200 status code) and need to be checked.
Internal Links With Redirects
When it comes to the internal links on your domain, there is no justifiable reason for one or more redirects to exist, at all. You have full control over your internal links and can save both the user and Google the time a redirect takes.
To check this, switch to “Links” in the navigation on the left side. There you will find a table with all internal and external links found during the crawl. Here, select the filter “Internal links” and again via the green button the “HTTP status code” filter, then “Does not contain the text” and “200”:
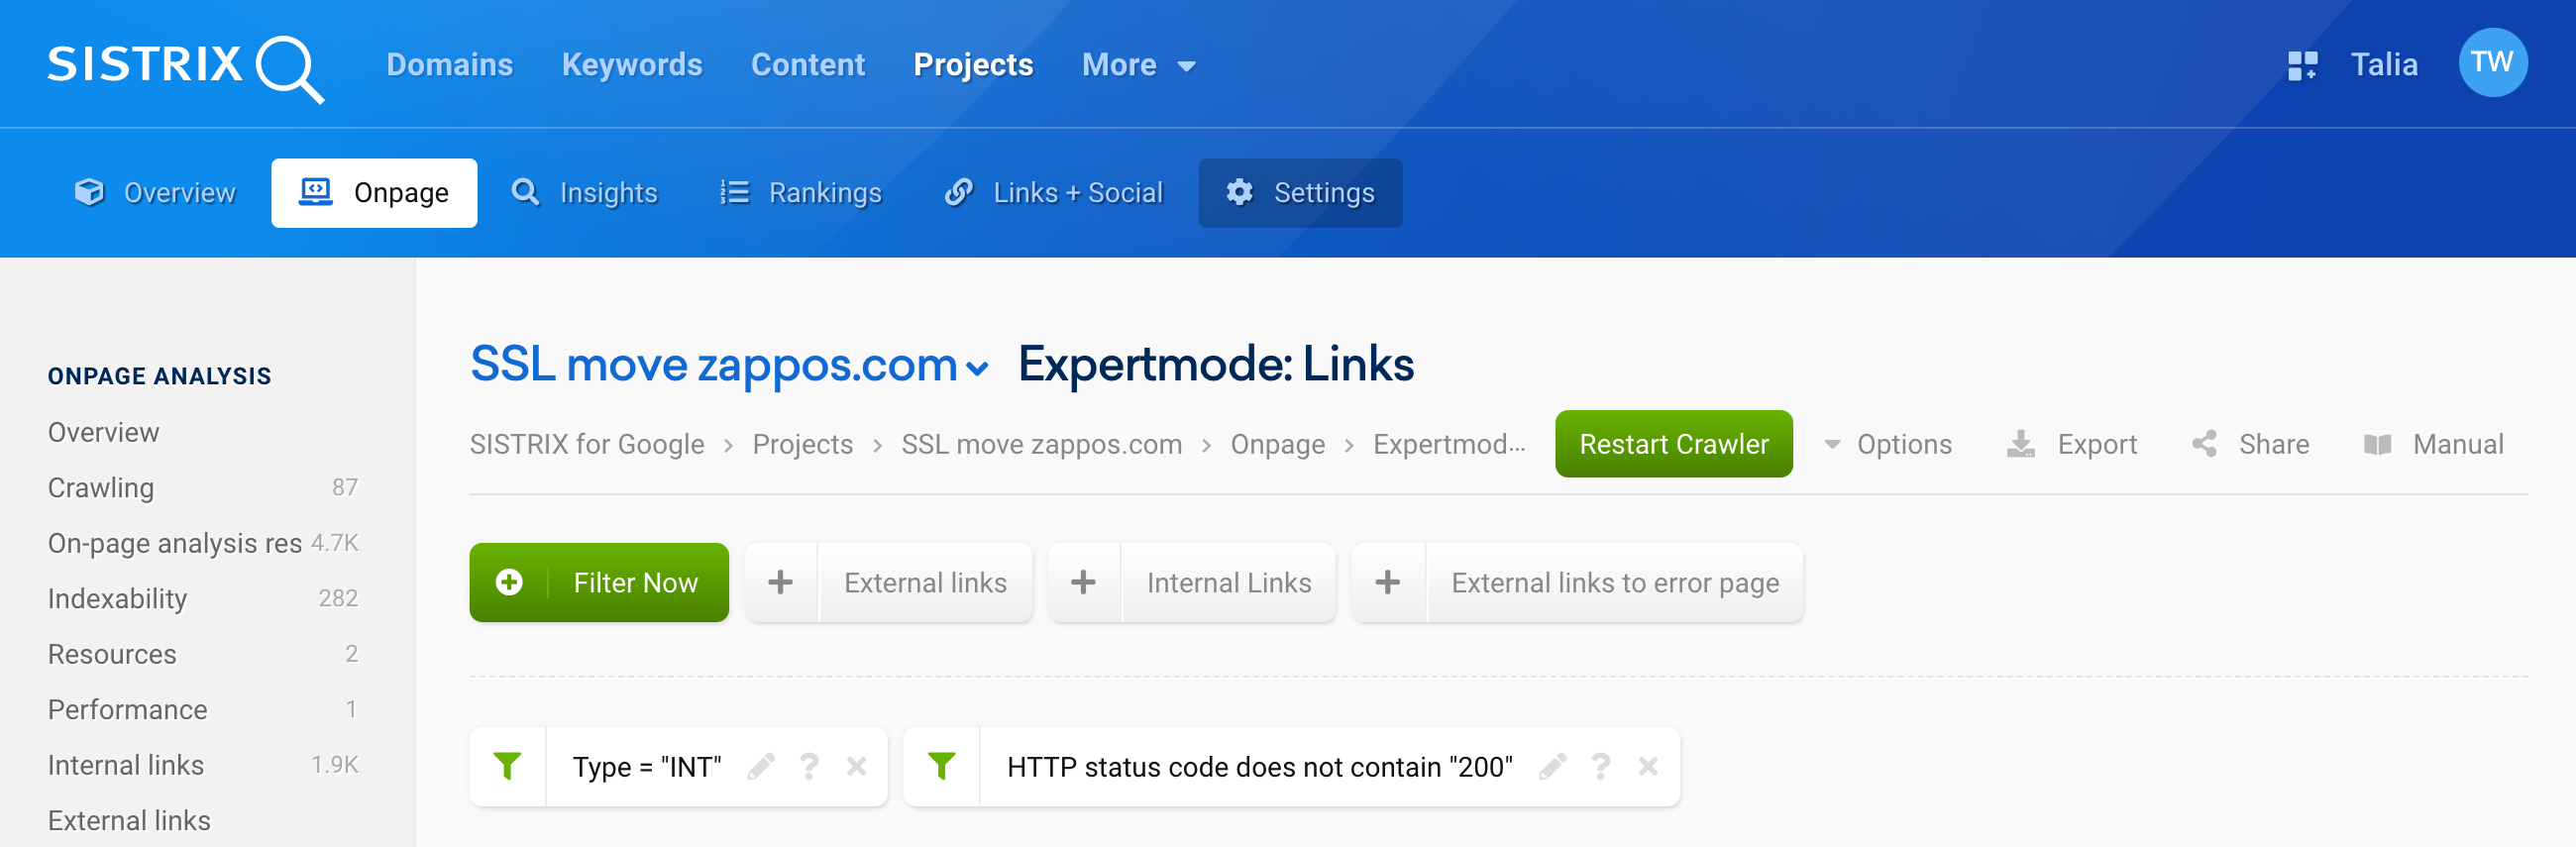
By using the type filter you define that you only want to see INTernal links and the “not 200” status code filter ensures that you get all the other possible status codes – like 301, 302, 307, 404, 410 or even 418.
The Ranking URL Check
After your switch to HTTPS, Google will have to crawl the respective HTTP pages once again in order to find the 301 redirects to the HTTPS version of each page. A simple way to check how far Google is with this, is to look at which protocol version Google returns in the search results.
After a certain transition phase, which may take up to half a year depending on the size of the page, Google should only deliver HTTPS pages in the search results.
We can check this by entering the domain into the SISTRIX search slot and then selecting “URLs” in the navigation on the left. By clicking on the predefined filter “Without SSL”, we receive a list of all URLs that are displayed by Google on the search results page but do not use the HTTPS protocol.
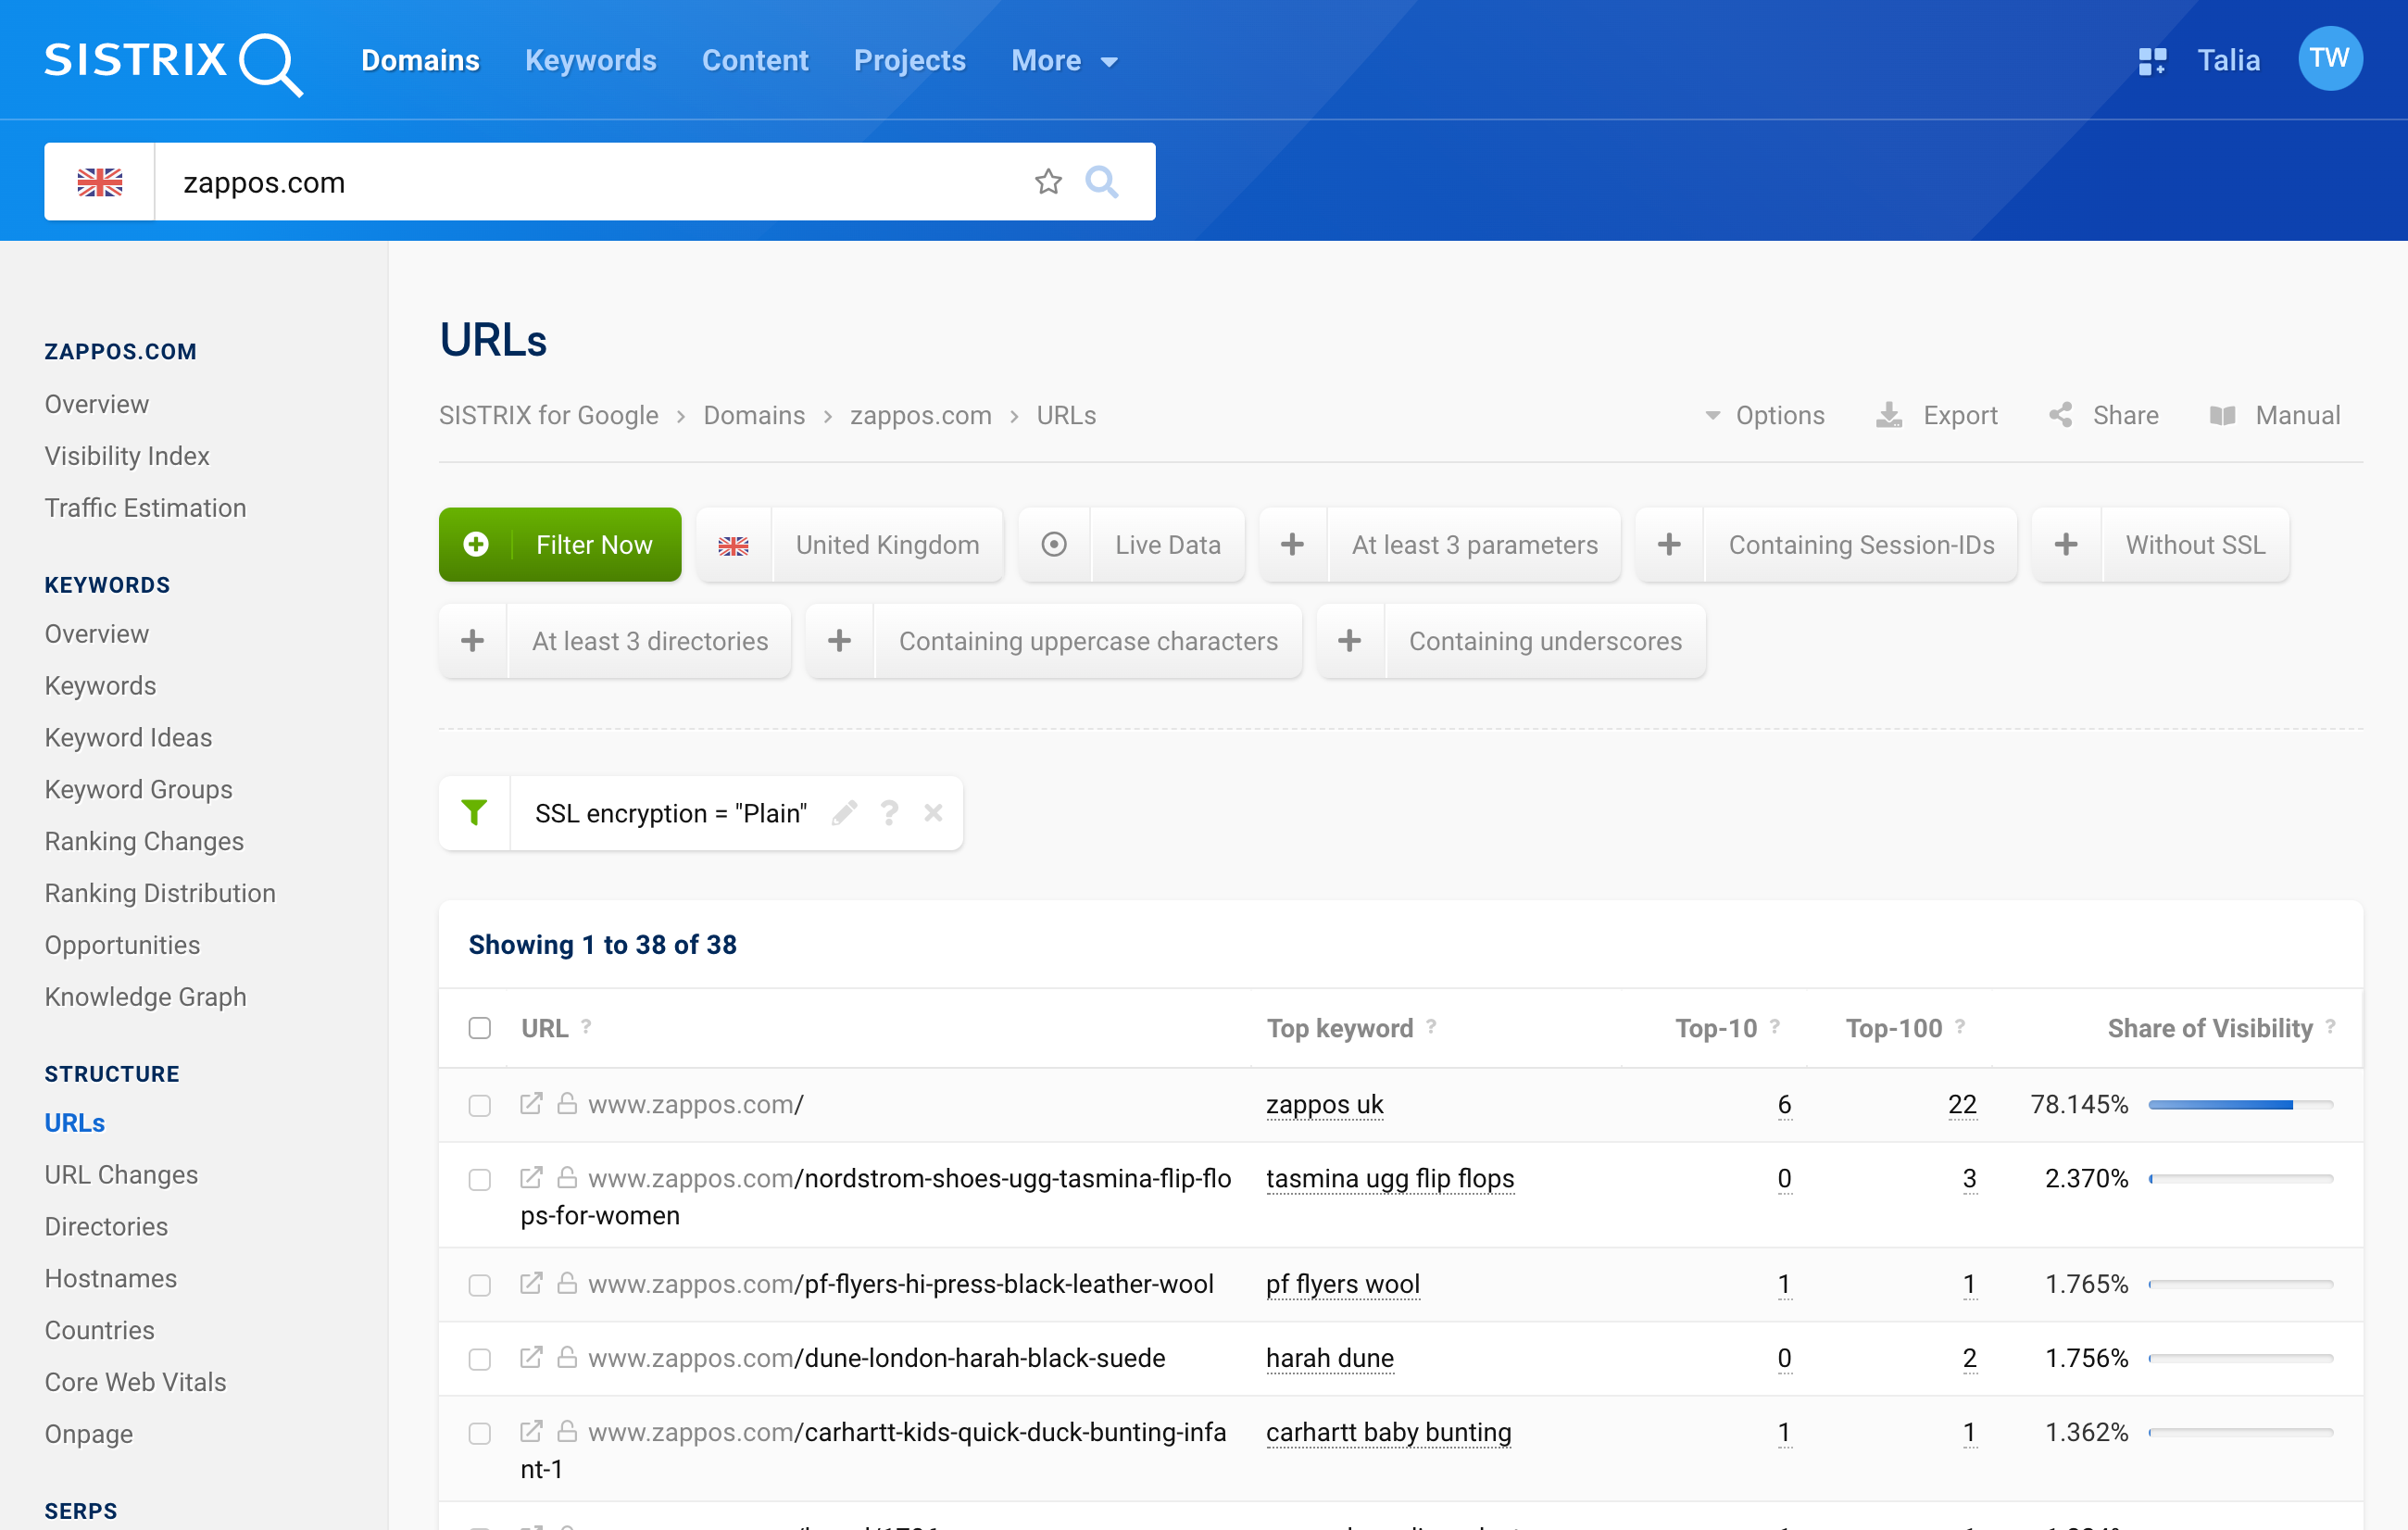
At the start of the switch, this list will likely be quite long. Over time, it should become shorter and ideally, after no more than 6 months, it should not show any results at all.
Conclusion
You can use SISTRIX and reports as well as the Optimizer to monitor and follow your domain’s move from HTTP to HTTPS. The automatic reporting allows for a weekly overview of the domain’s Visibility on Google. With the Optimizer you can ensure the correct redirects of your pages, and finally you can also check whether Google has already found all HTTPS pages.