
Since 2021, the speed of websites and the so-called “Page Experience” have been Google ranking factors. Learn how to use SISTRIX to properly measure the Core Web Vitals in this tutorial.
In 2021, Google announced that loading speed and user experience were to become ranking factors. Summarised under the term Core Web Vitals, Google measures three central key figures:
What are the Core Web Vitals?
The Core Web Vitals consist of three key figures. A brief summary:
- Largest Contentful Paint (LCP) – How long does it take (in milliseconds) for the main content of the website to load?
- First Input Delay (FID) – How quickly (in milliseconds) can the user interact with the page?
- Cumulative Layout Shift (CLS) – Does the layout change after loading and if so, how much?
Unfortunately, the names of the metrics are not yet the most complex part of the Core Web Vitals, even the measurement is complicated.
How do I measure the Google Core Web Vitals?
Generally, there are two different methods of measuring the Core Web Vitals. For a reliable observation of the Web Vitals of your website, you need to use both methods.
In SISTRIX, you have access to both measuring methods: You can draw on both lab data and field or user data.
Martin Splitt from Google explained the background in more detail on Twitter. In short: Both ways of data measurement are relevant, however, poor user data results weigh more heavily for the ranking factor “Page Experience”.
In detail, this is how it looks like in SISTRIX:
Lab Data
The lab data are named as such because they are actively measured under fixed and reproducible conditions. So if you measure lab data twice in quick succession, you will get the same or at least very similar values.
In SISTRIX, lab data are determined in the Onpage projects. The Performance measurement there has been based on Google Lighthouse since July 2020. These Lighthouse measurements are automatically conducted once a day. The results are also automatically and permanently saved. Aside from many other interesting key figures, Google Lighthouse also determines the Core Web Vitals.
When creating an Onpage project, a Lighthouse measurement is also automatically carried out.
You can find an overview of the last measurements on the Overview page of your project.
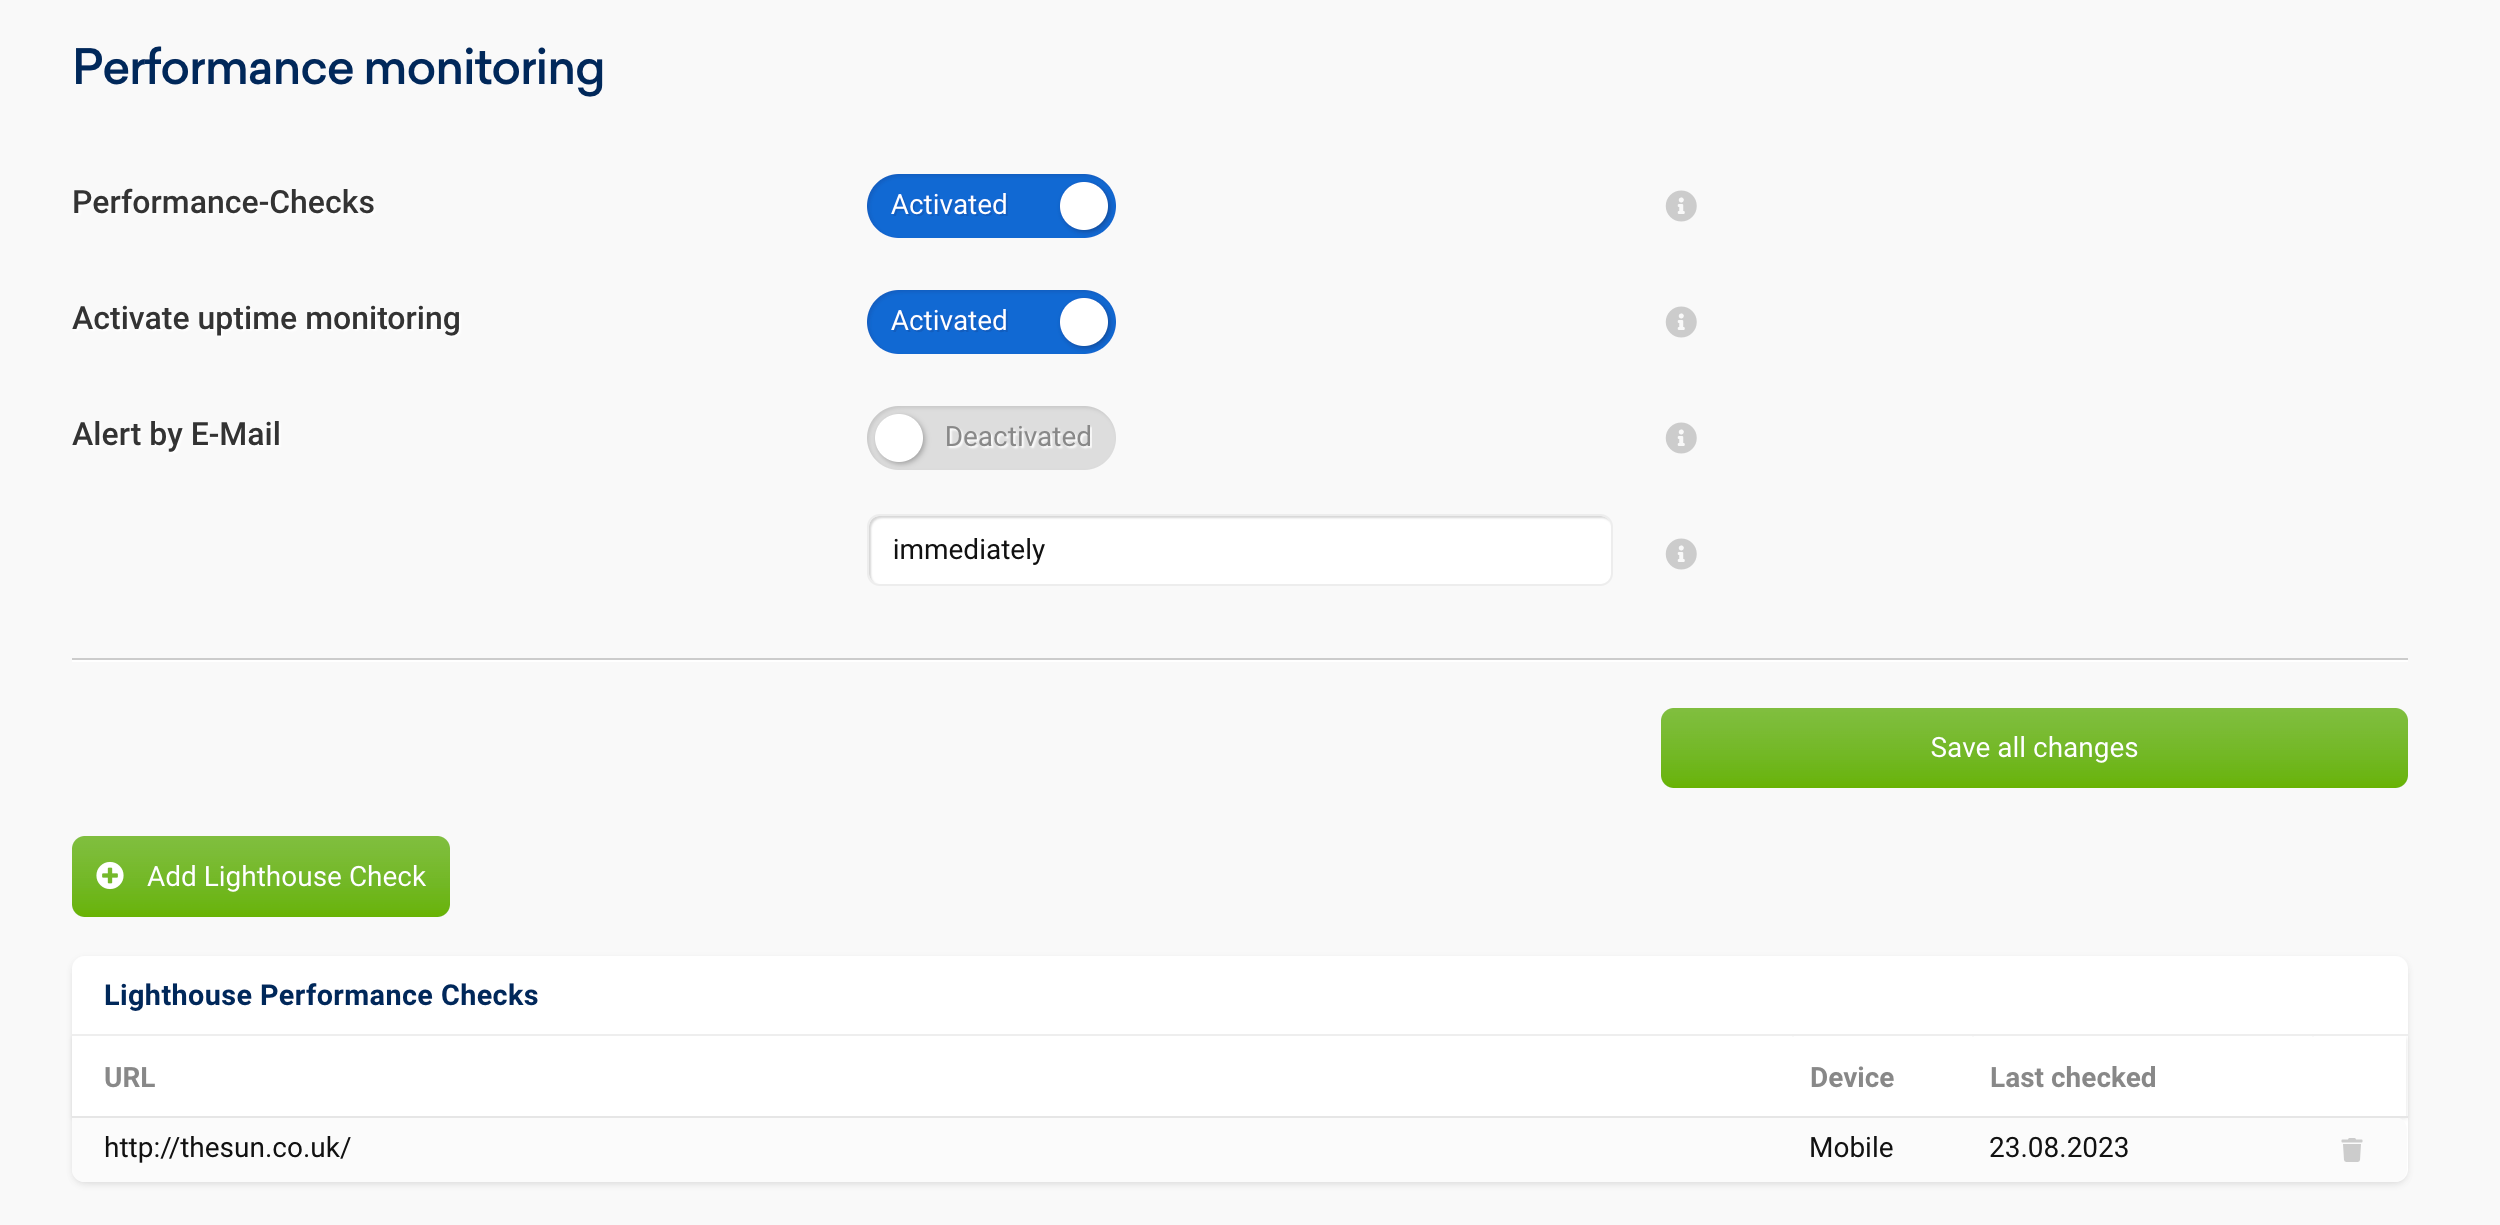
You can add additional URLs in the project settings. This way you can also measure sub-pages regularly and automatically.
It is recommended to measure typical representatives of page types. For example, an article, a product detail page, a category page and so on.
You can also set whether the measurement should be carried out with a desktop or mobile client. It is best to orientate yourself on your own users and select the option that surfs most frequently on your website. The profiles for desktop and mobile use different default settings for the available bandwidth and computing power.
You can find the results in an Onpage project under the tab “Insights”.
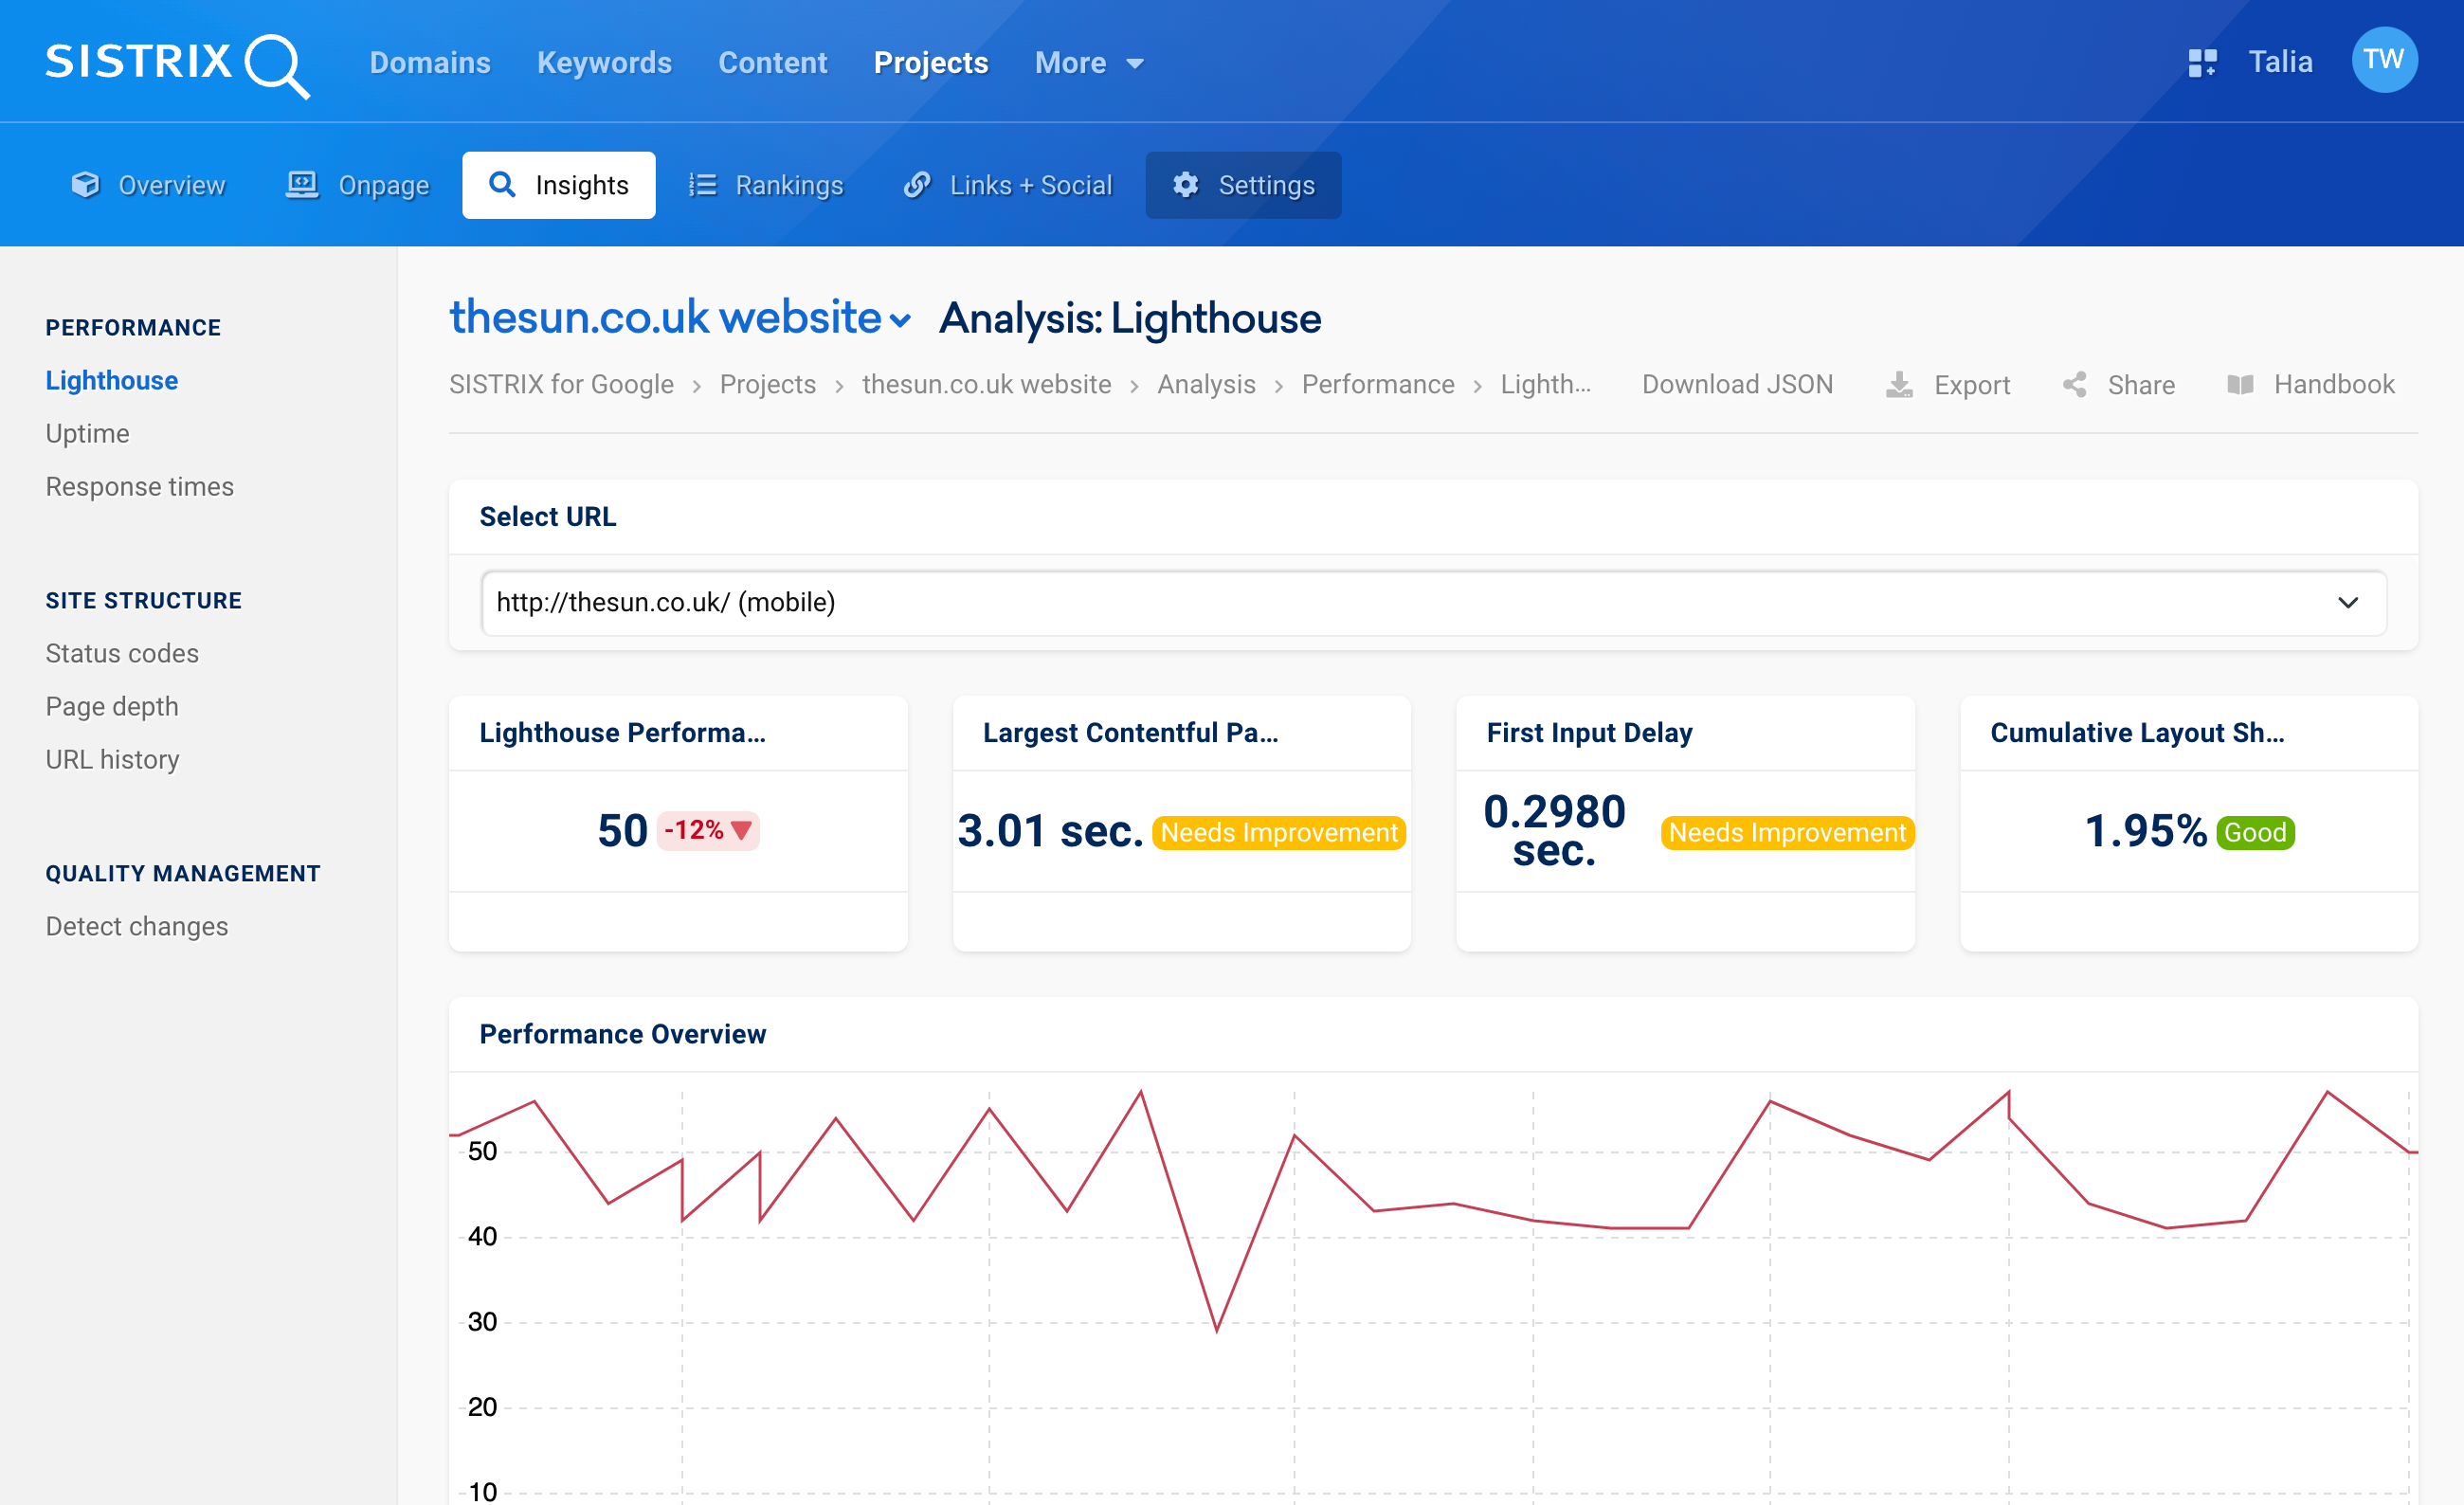
Above 1 you can choose between the URLs for which you have created Lighthouse evaluations.
In the next row, you will see the currently measured key figures in four boxes. First, the Lighthouse Performance score, a combined Lighthouse indicator for all measured data. The goal here is to achieve more than 90.
This is followed by three boxes with the Core Web Vitals: Largest Contentful Paint, First Input Delay and Cumulative Layout Shift. Next to the values you will see whether the measurement lies within Google’s recommendations (green), needs improvement (yellow) or is completely outside Google’s expectations (red).
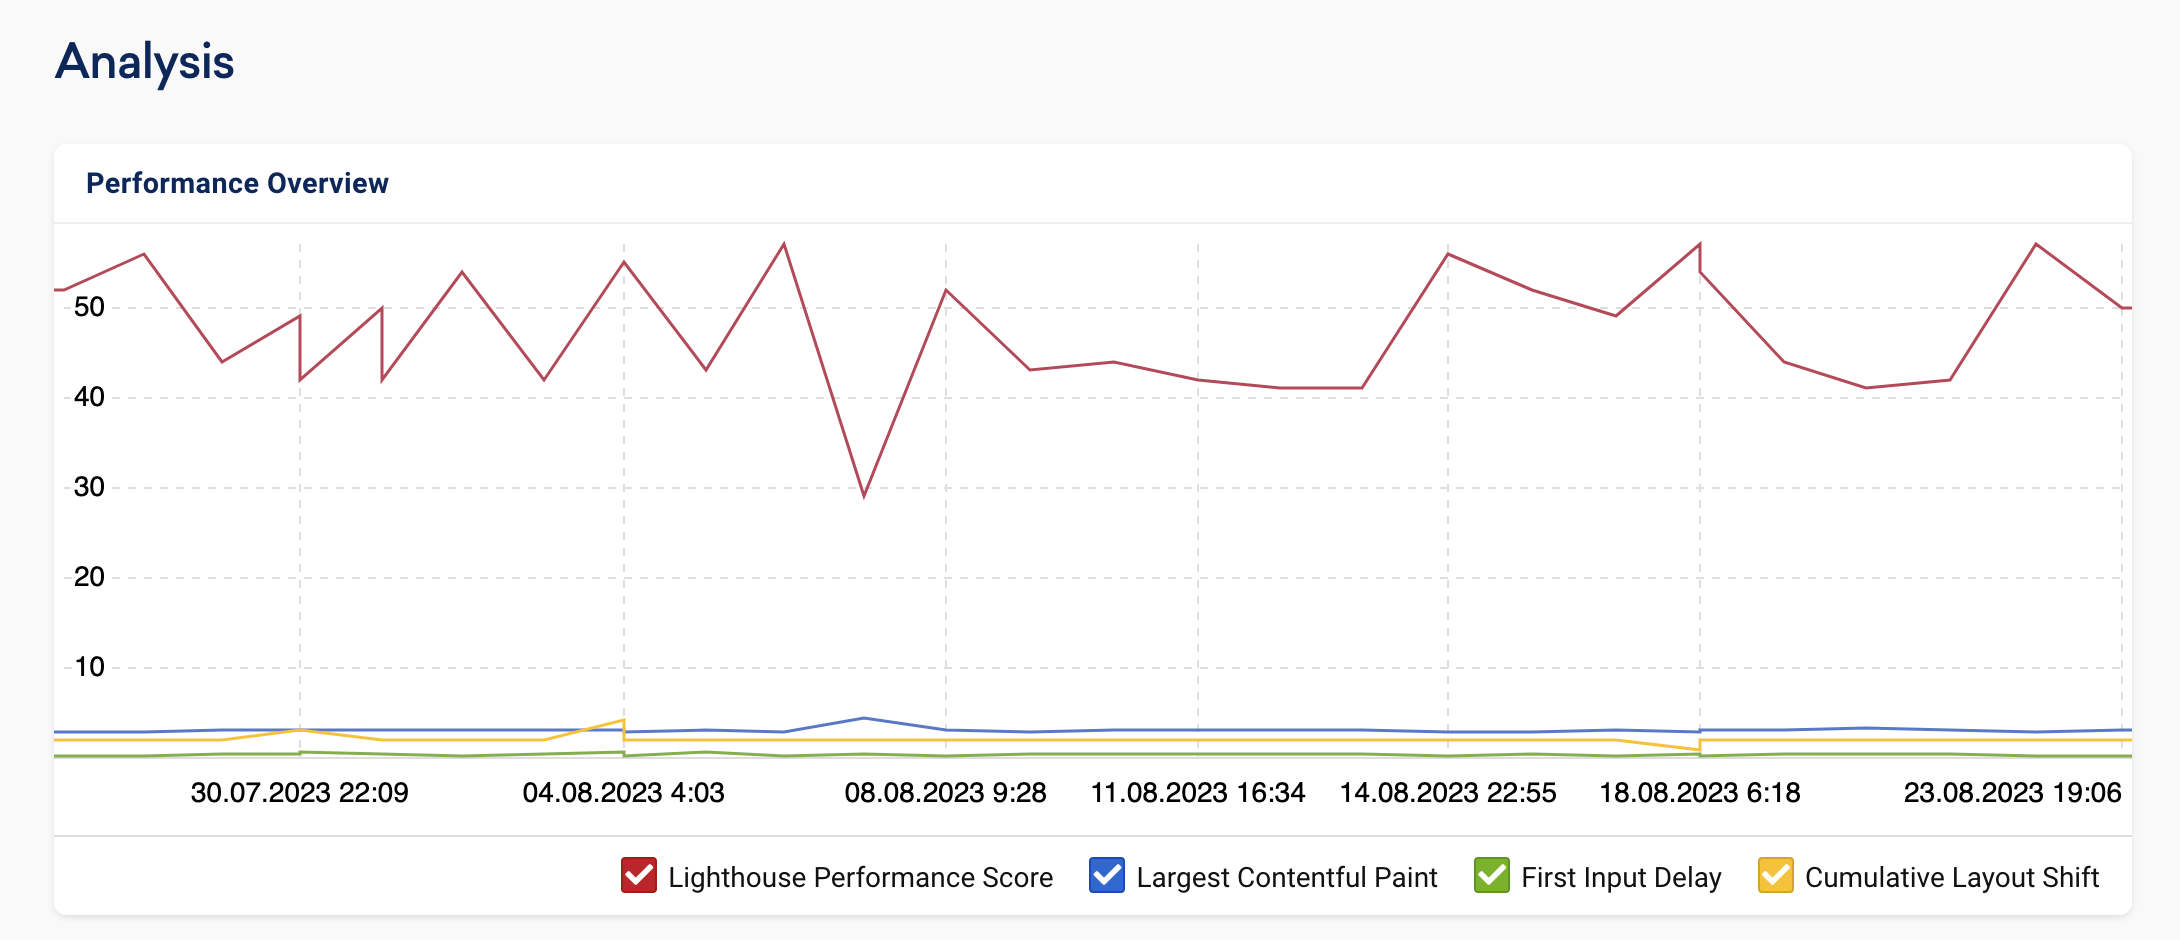
In the diagram below that, you can see the chronological development of these four key figures. Below the diagram, you can select the desired values with the checkboxes. At the end of the page, we also show a waterfall diagram.
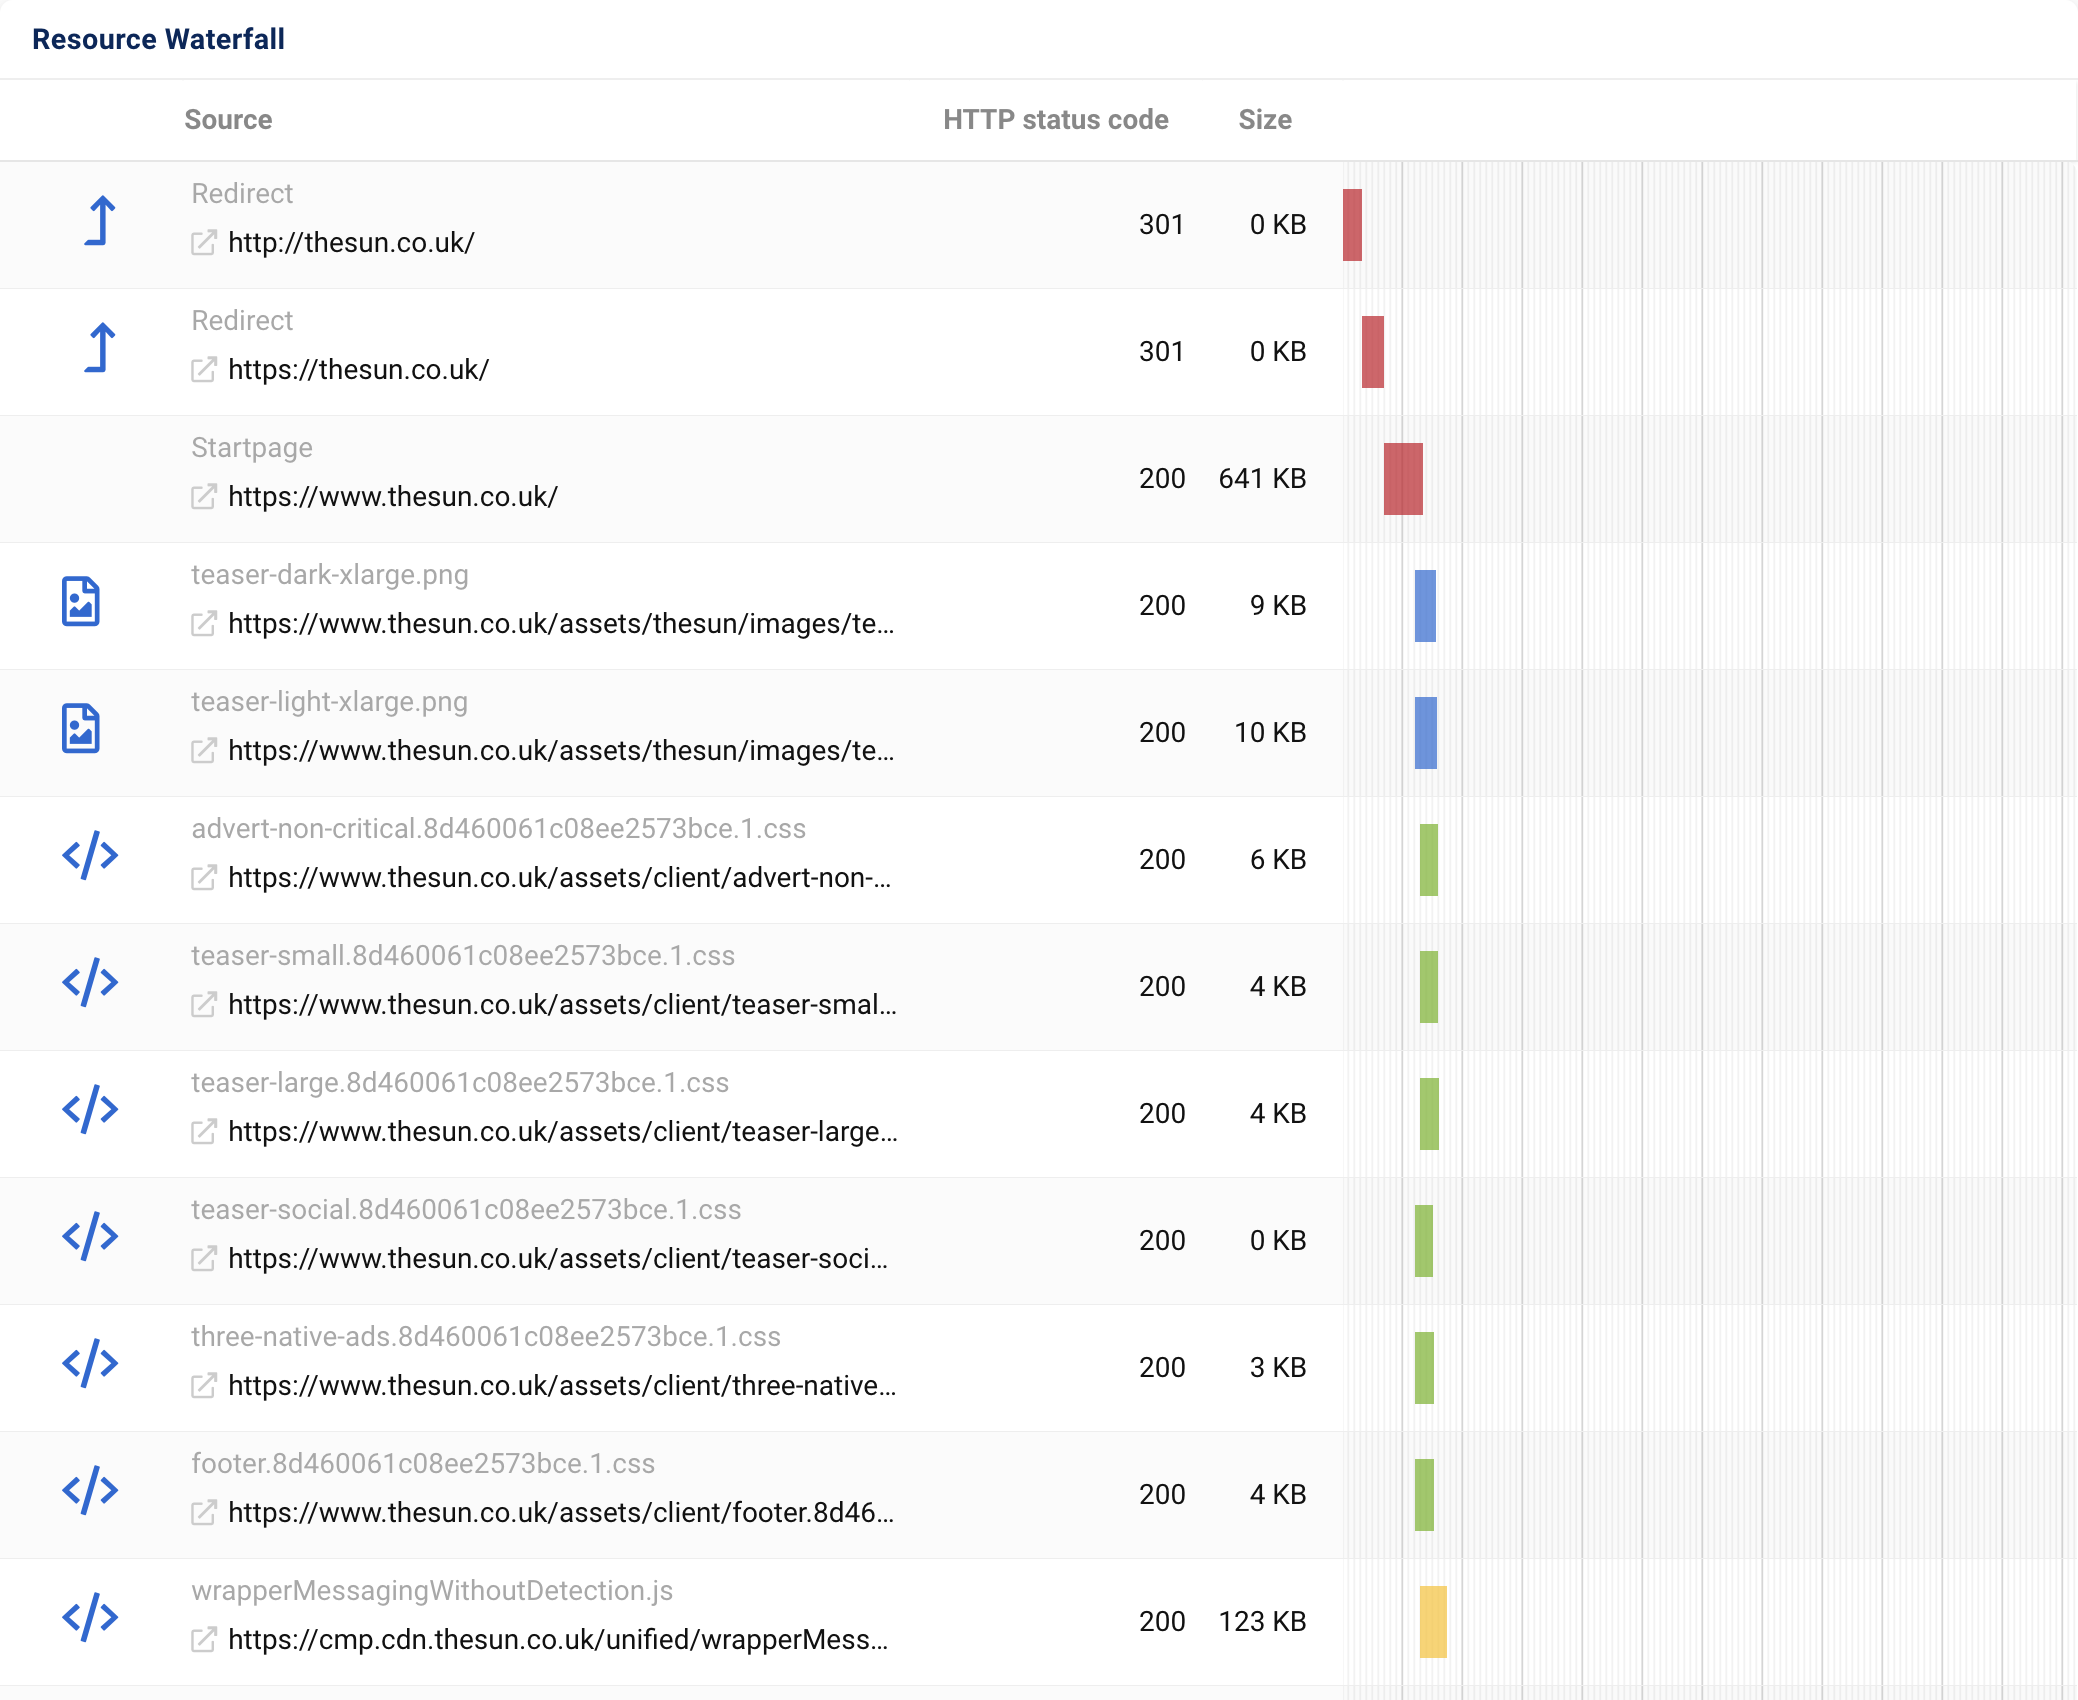
With this, professionals can see at a glance which elements of a page affect the loading speed.
An interesting highlight for pros: Google Lighthouse offers to save all collected data in a standardised JSON file. This allows you to load the respective analysis into a Lighthouse Report Viewer and investigate the causes more thoroughly. We also save these JSON files for you.
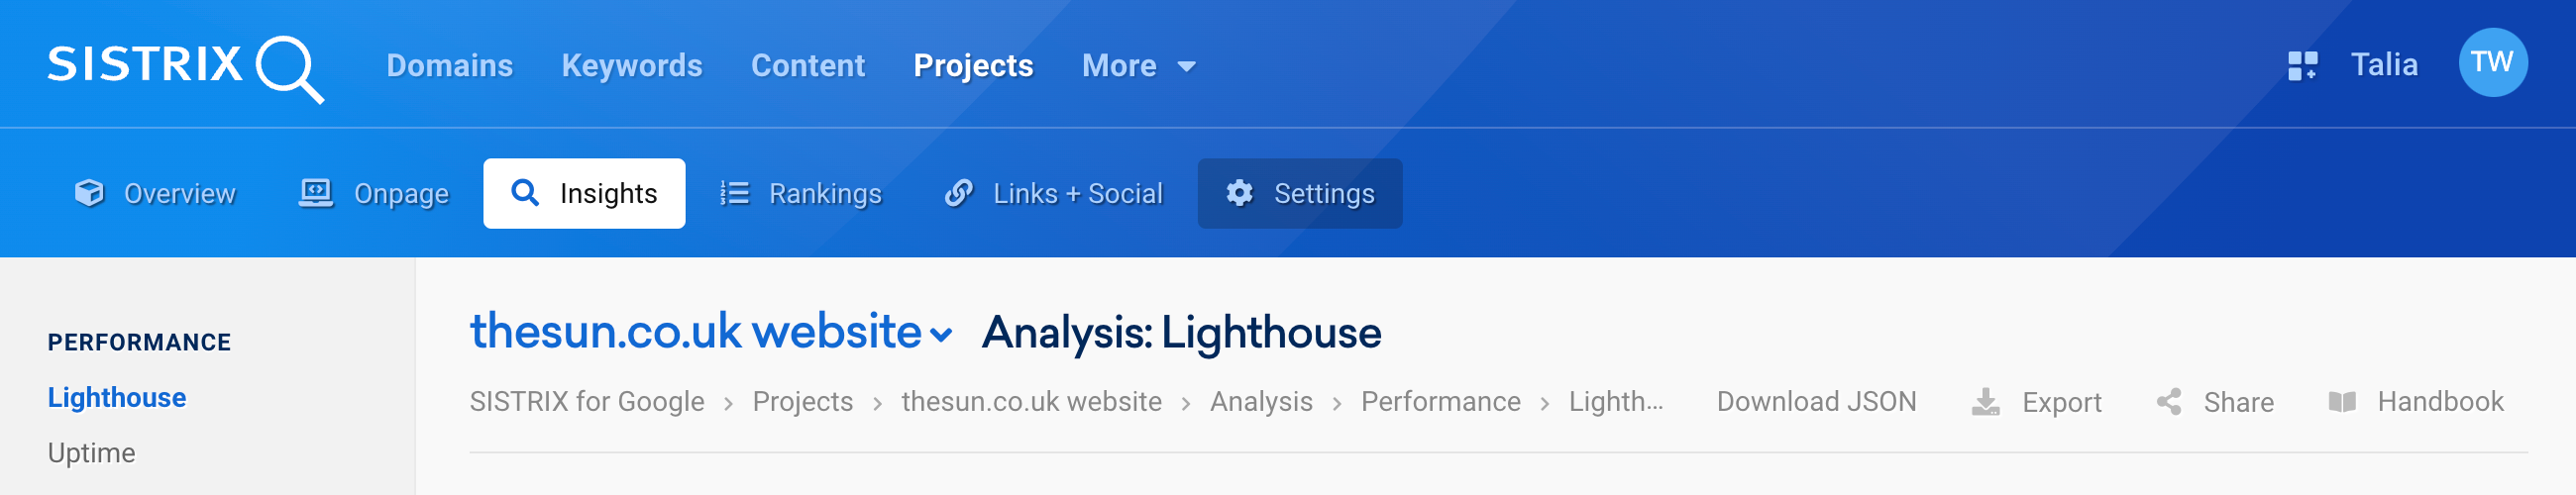
You can download it with the button “Download JSON” 1 at the top of the page.
Field & User Data
The second method of measuring the Core Web Vitals are field or user data. This involves measuring the performance indicators of real users in the Chrome browser (which Google also owns, as if by chance), collecting them centrally and making them available anonymously.
We also provide these data in SISTRIX.
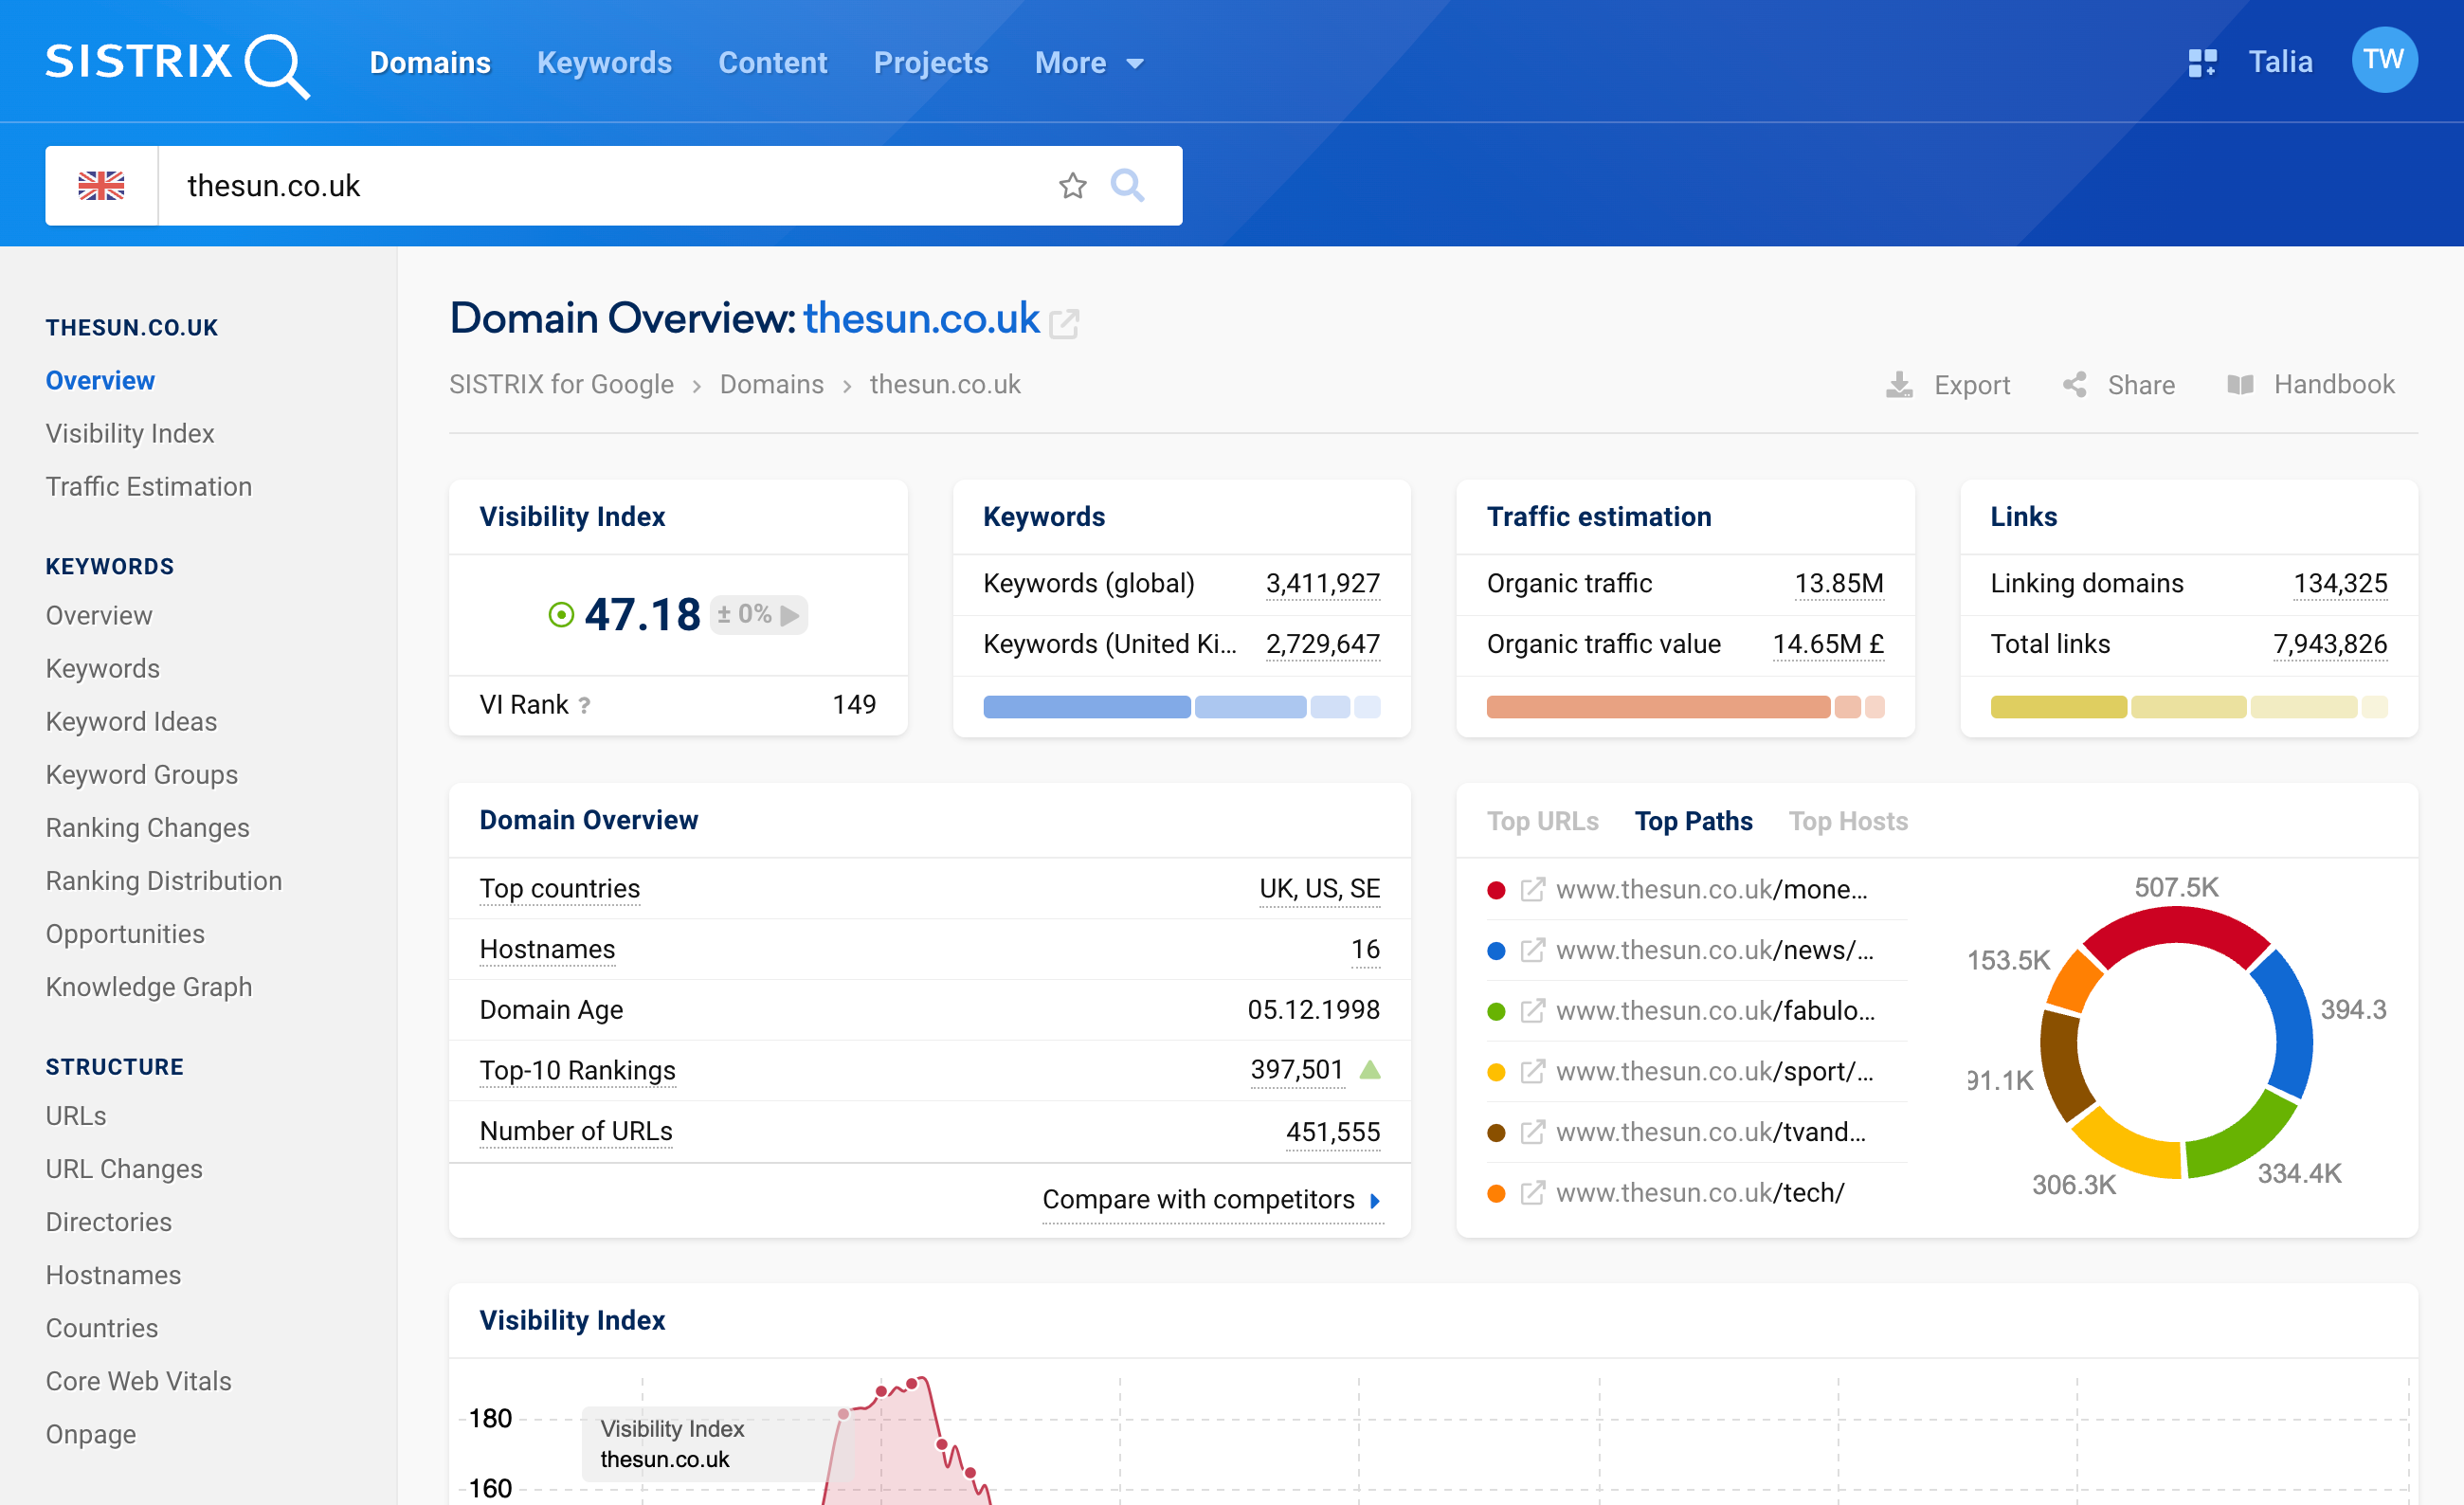
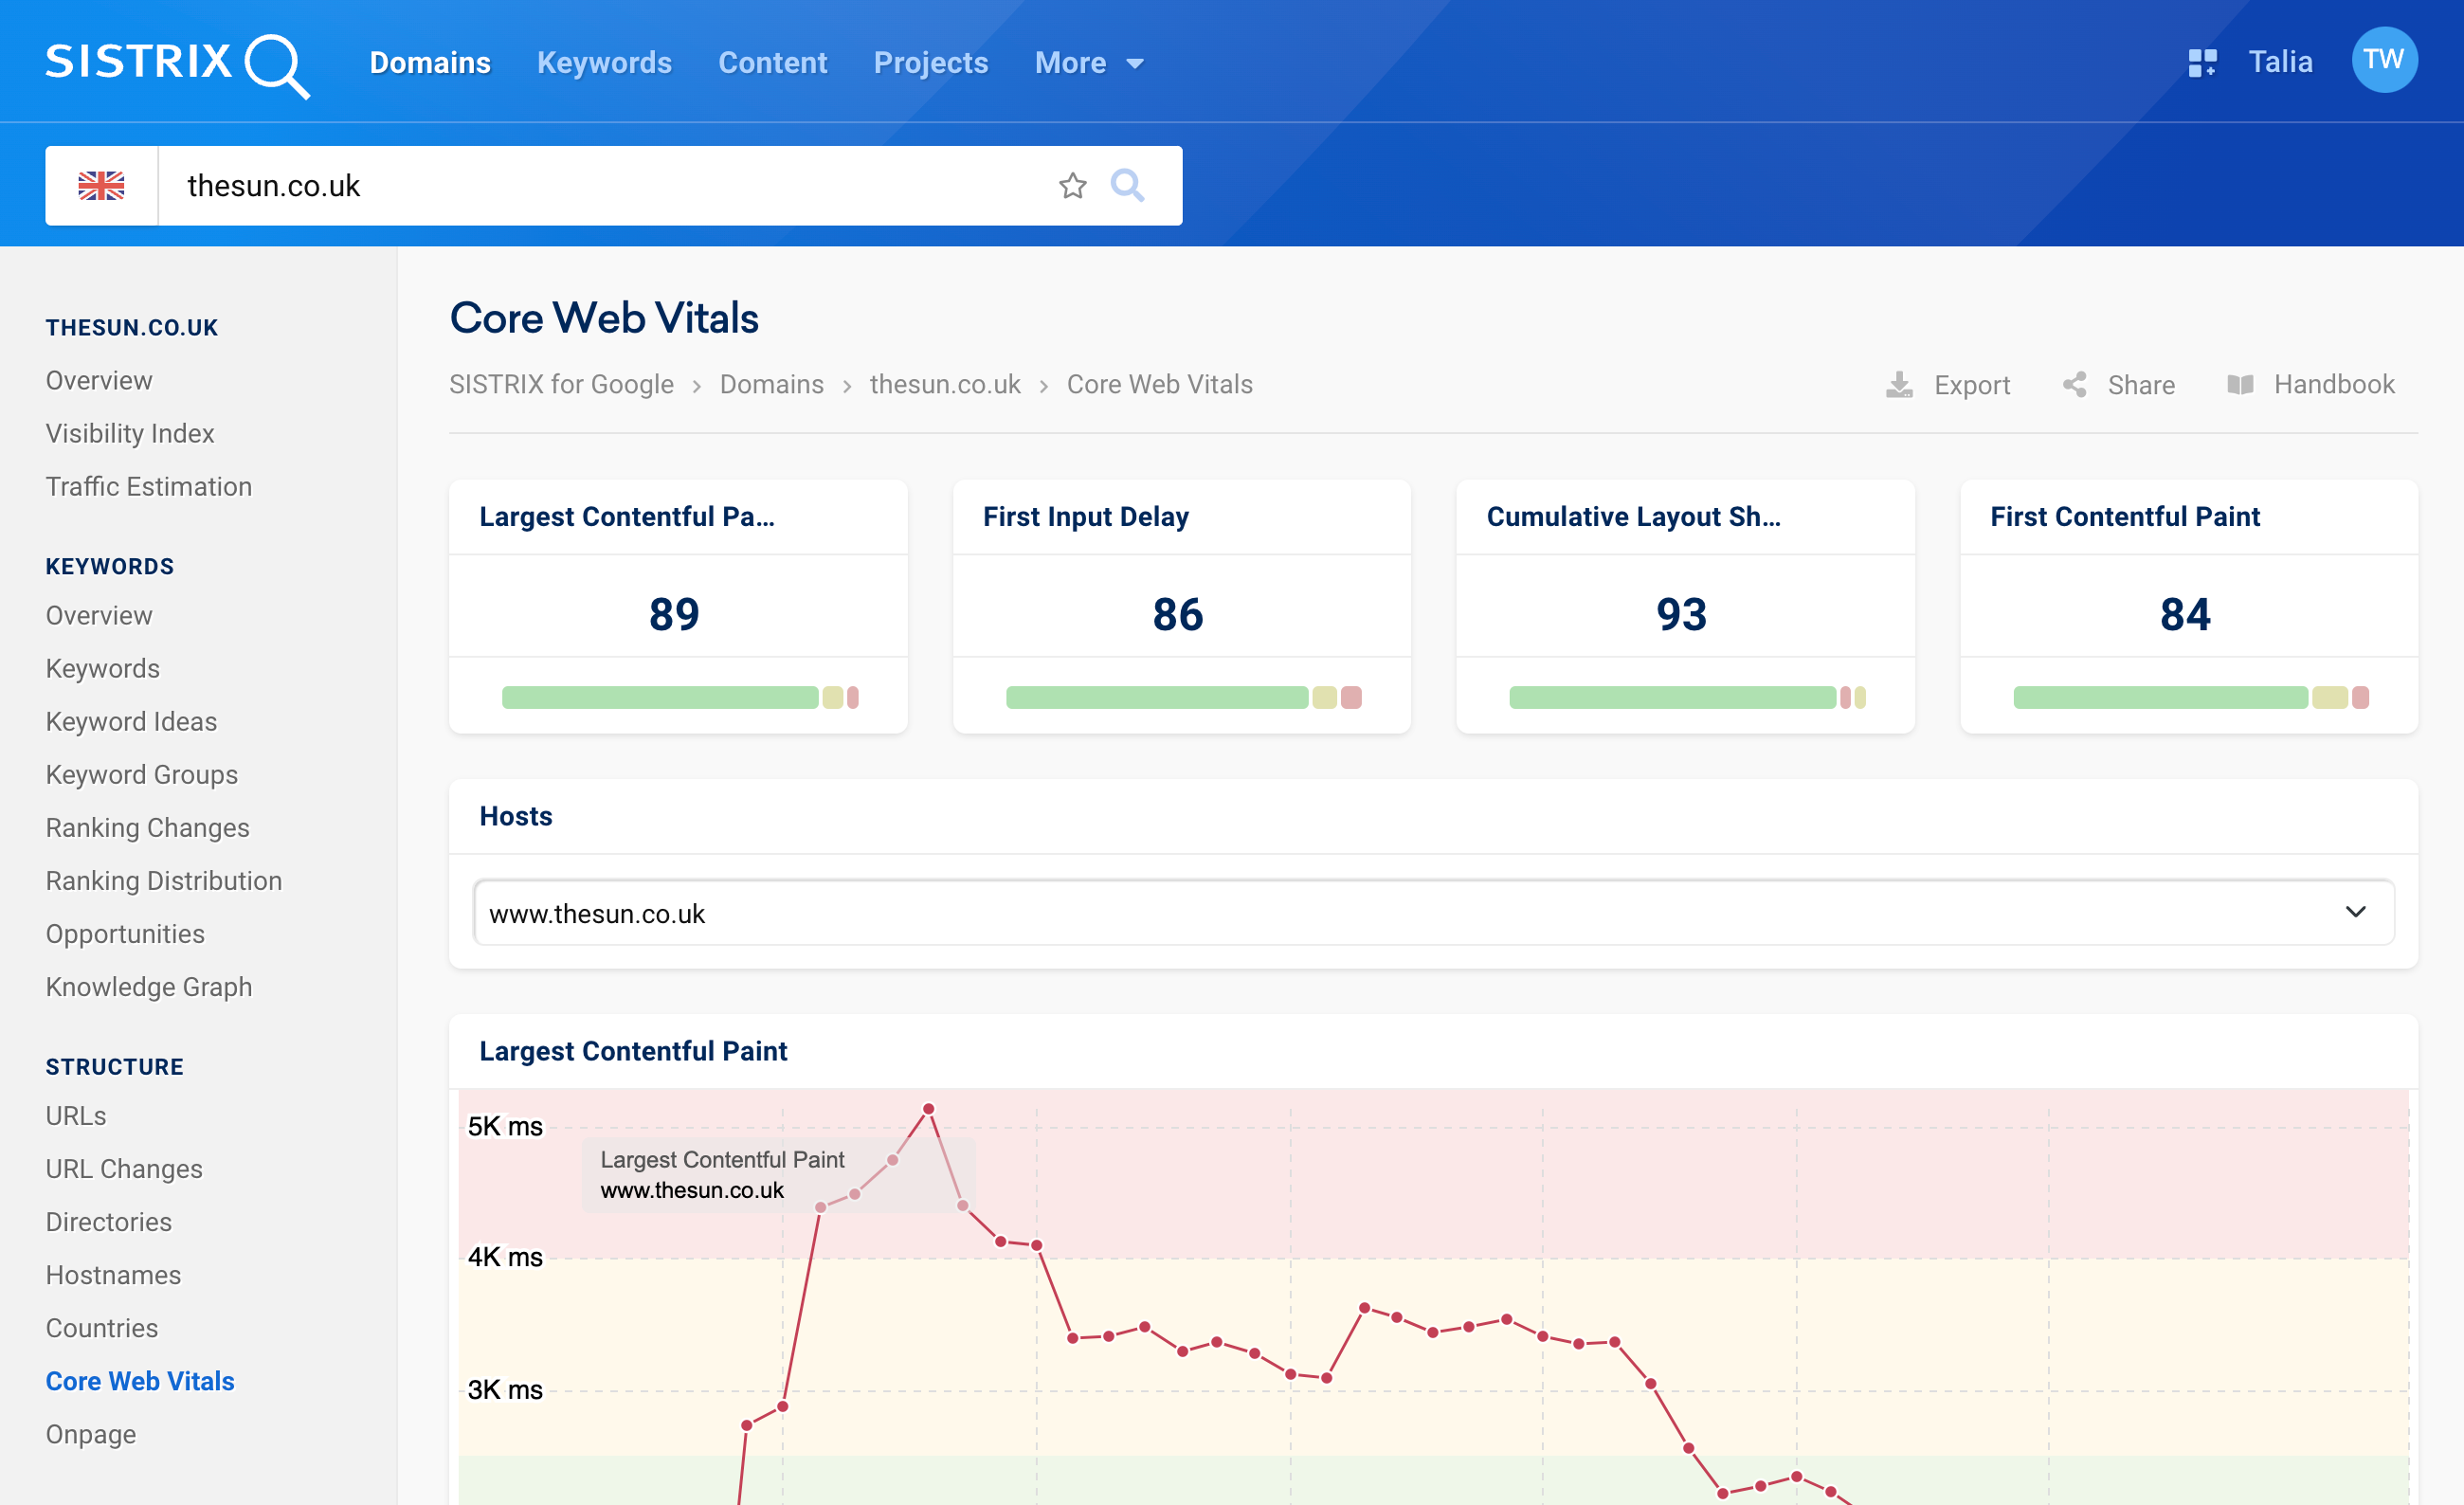
Simply enter a domain into the SISTRIX search field. In the navigation on the left-hand side, you will find the “Core Web Vitals” 2 under the navigation item Structure. There you can analyse the measured user data for any domain.
The data displayed refer to the selected country in the interface. So if you have the Union Jack in front of the domain, you are viewing UK data.
This is followed by four boxes: There you can see the current values for the three Core Web Vitals (LCP, FID, and CLS) as well as the measured values for First Contentful Paint, i.e., the point at which content is first displayed in the user’s browser. This point in time is usually slightly before the point of the Largest Contentful Paint.
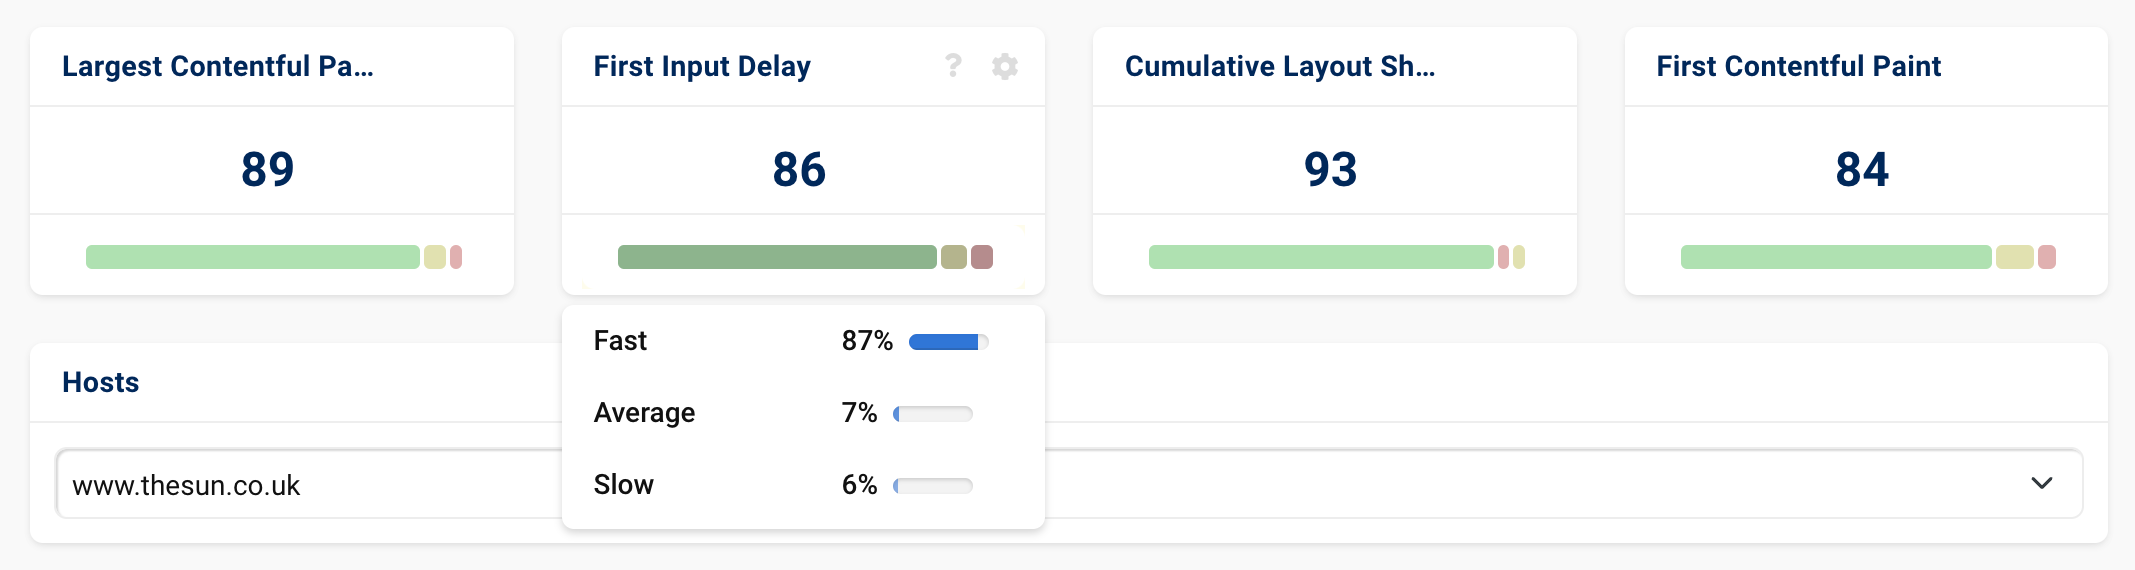
In addition to the concrete measured values (in milliseconds or, in the case of CLS, as a number) you will also see the distribution of the measured values in relation to Google’s expectations: The bars below the numbers show the percentage of users for whom this metric was good in green, the users with a measurement that needs improvement in yellow and those with a poor measurement in red.
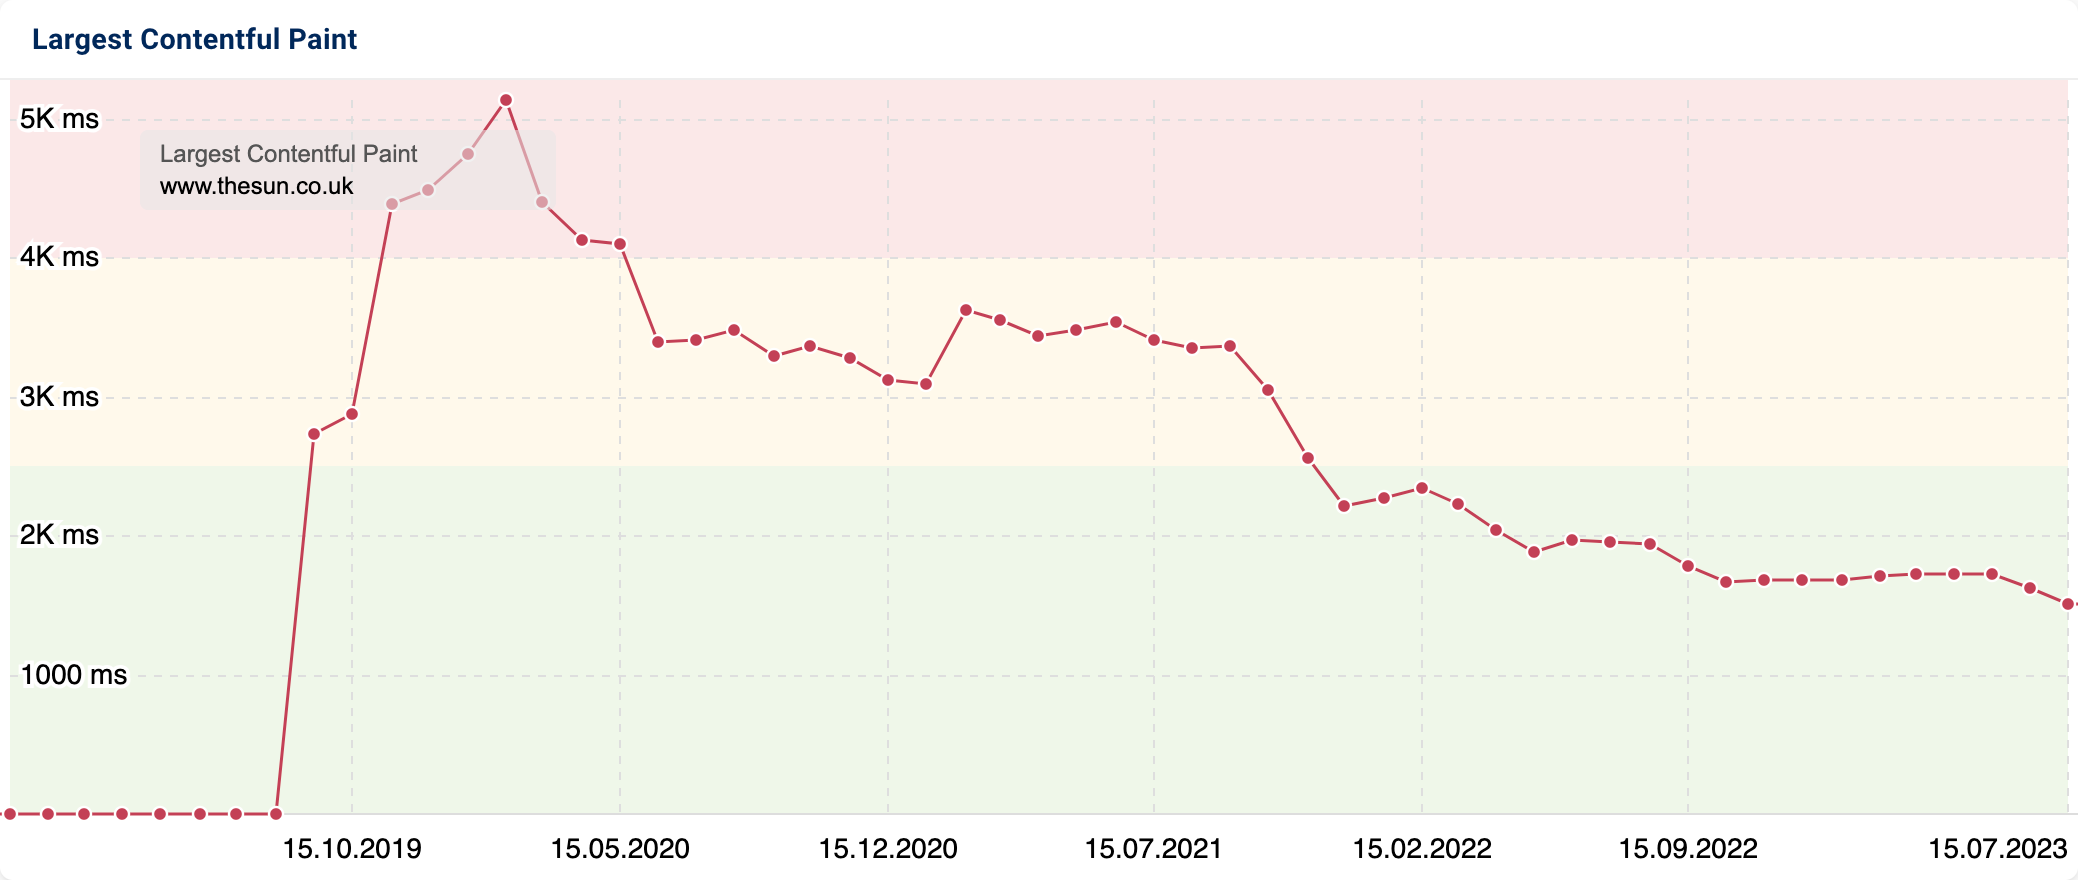
This is then followed by three diagrams showing the development of the Core Web Vitals over time. There you can see the trend of the metrics on a monthly basis (the key figures are not measured more frequently).
For a better classification of the measured values, we have coloured the background of the diagram in green, yellow and red according to Google’s recommendations.
Lab or field data, which is better?
Both lab data and field data have their uses. You will have to work with both types of data to successfully keep track of and improve the Core Web Vitals over time.
Lab data have the advantage that they are measured under controlled conditions. If there are strong changes in the measured values, this will not be due to the environment, but to your page. They also have the advantage that you can immediately make measurements and as often as you like after making changes to your page. Therefore, they are perfect for testing and directly evaluating improvements.
The disadvantage of lab data is that they do not capture the real user experience: Lab data are always synthetic data and only as good as the settings under which you measure them.
The advantage of user data is that they measure the real experience of your users on your website. Do you have a lot of users with slow internet connections and old mobile phones? Then this will be reflected in your user data, as this is your user’s experience.
The disadvantage of user data is that they only ever show a sample: Only a small fraction of Chrome users are in the panel for data collection. Especially for small, unfrequented websites, there is therefore no sufficient data basis for evaluations. The evaluations also lag behind reality: They are only released monthly, so they are always outdated. Changes and adjustments to your website are therefore only visible in the user data with a delay of several weeks.
Which target values should I optimise for?
Google has defined threshold values for each of the three Core Web Vitals. These are divided into good (green), in need of improvement (yellow) and poor (red). In SISTRIX, we use the threshold values defined by Google and show you at a glance how the performance is to be evaluated. The values are:
Largest Contentful Paint (LCP)
- Good (green): less than 2,500 milliseconds
- In need of improvement (yellow): up to 4,000 milliseconds
- Poor (red): more than 4,000 milliseconds
First Input Delay (FID)
- Good (green): less than 100 milliseconds
- In need of improvement (yellow): up to 300 milliseconds
- Poor (red): more than 300 milliseconds
Cumulative Layout Shift (CLS)
- Good (green): less than 0.1
- In need of improvement (yellow): up to 0.25
- Poor (red): more than 0.25
Conclusion
With the Core Web Vitals, Google enables the performance measurement of websites on a uniform basis. This does not make the complex topic any less complex, but it does make it easier to measure and evaluate. In SISTRIX, you have access to lab and field data and can therefore optimally assess and improve websites.