
Next year, Google will use page experience as a ranking factor. The performance of the page is an important part of that page experience. Now, in the SISTRIX Optimizer, you can automatically measure the Core Web Vitals metric with Google Lighthouse.
Google has announced that it will combine a number of key figures on user experience under the banner “Page Experience” and make it a ranking factor next year (2021). In addition to already known factors such as HTTPS or mobile friendliness, you will now find references to Core Web Vitals.
The new key metrics: Core Web Vitals
With the three key metrics in the Core Web Vitals, Google wants to comprehensibly measure how user-friendly and fast a page loads. Google has expressly reserved the right to change the composition of the Core Web Vitals but they currently consist of these three key figures:
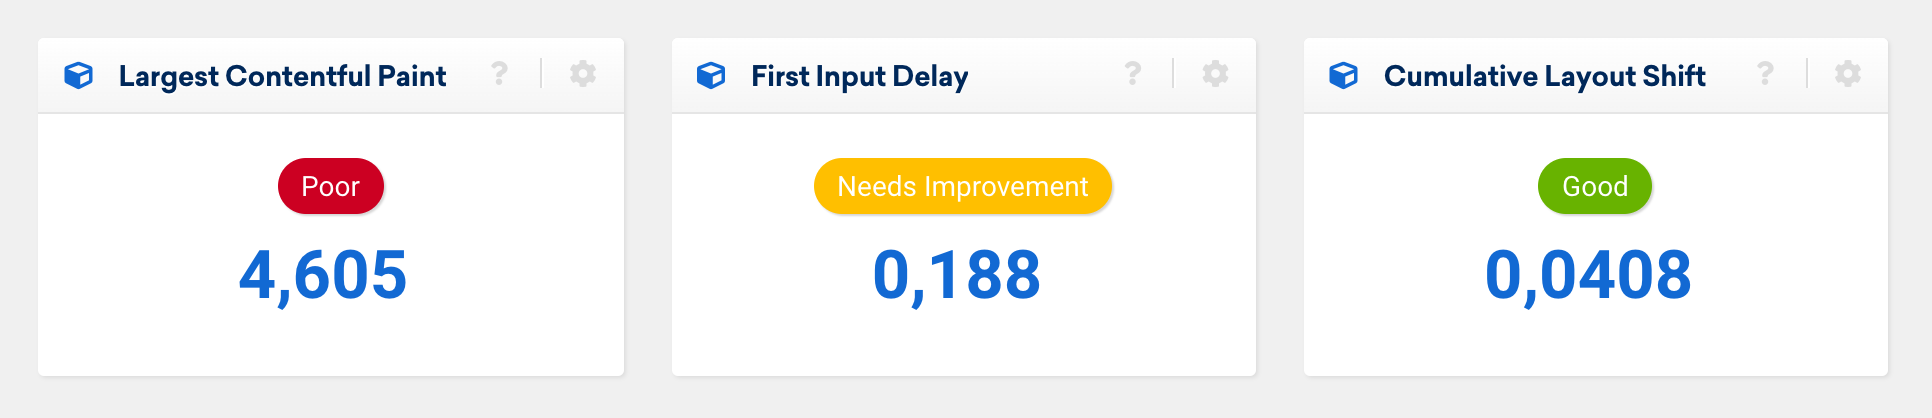
- Largest Contentful Paint (LCP) – this is related to the loading speed. It measures how long it takes for the largest block of content to become visible to the user.
- First Input Delay (FID) – this measures the time it takes between a user interaction and a response on the page. i.e. input latency.
- Cumulative Layout Shift (CLS) – finally, Google measures whether the layout of the half-loaded page is stable or whether there are significant layout shifts during the loading process.
To determine this data, one can either use user data from a website (field data) or carry out measurements (lab data). Both methods have advantages and disadvantages. In the SISTRIX Optimizer we use lab data derived ourselves from Google Lighthouse.
Google Lighthouse 6.0
With the release of Google Lighthouse 6.0 in May, the key figures of the Core Web Vitals are now supported. We are therefore replacing the current performance measurement in the SISTRIX Optimizer with Google Lighthouse. You can use this to prepare your website for algorithm changes at Google from today.
The Lighthouse reports are automatically executed once a day and their results are saved. We use the standard settings from Lighthouse (Mobile, Moto G4, Network and CPU throttling). The device can be changed in settings, from Mobile to Desktop.
In the optimizer, you can see the three values of the Core Web Vitals along with the Lighthouse Performance Score. In addition to the daily updated values, we’ll present the historical values as a graph, underneath.
We also display a waterfall diagram (as before) so that you can quickly see which resources and areas of the website are causing performance problems.
Exporting the Lighthouse JSON
Google Lighthouse determines numerous other values. These are saved in a standardised JSON file. In the Optimizer you can export these files and edit them yourself. You can load them into the Lighthouse Report Viewer, for example, and examine the extensive evaluations.
More details about this feature are now available in an informational article.