
Over the last couple of month, we have spend a lot of time improving the usability of Toolbox features. The important thing for us was to help newcomers quickly get good results but also to give SEO-pros a way to address all their different use-cases.
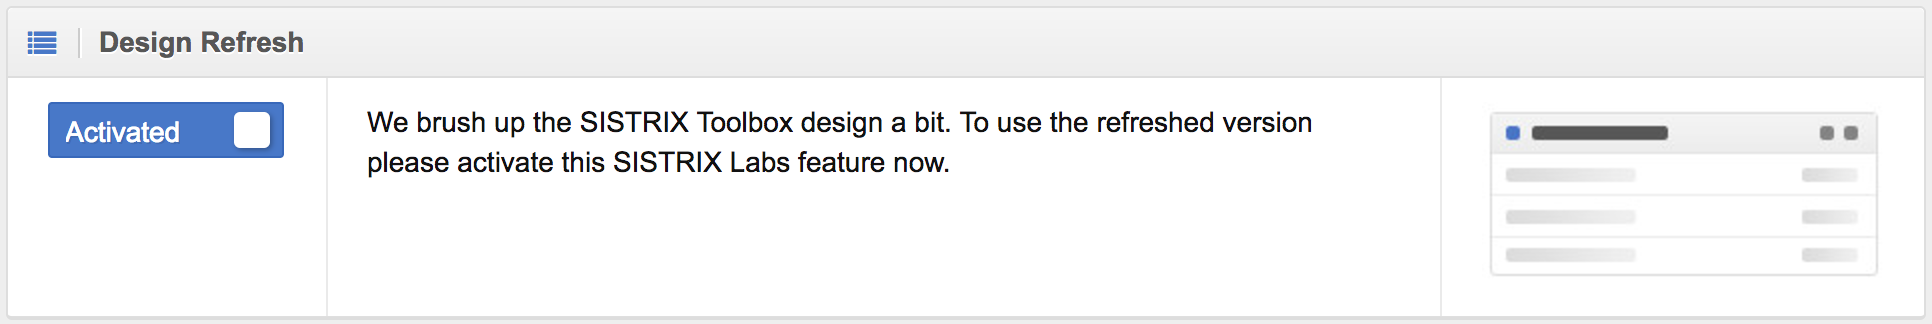
You can now take a look at the first fruits of our efforts by enabling the beta for our new features within the SISTRIX Labs. Simply click on the account-menu at the top right hand side of the Toolbox and choose “SISTRIX Labs”. There, you can activate the “Design-Refresh” for your profile. No worries, you can always turn it back off later.
You will likely notice the most notable change within the Toolbox tables. They now have a common theme across all modules. You also have quickfilters above the tables for fast results: here we chose commonly used filter and sort options so you quickly get results:
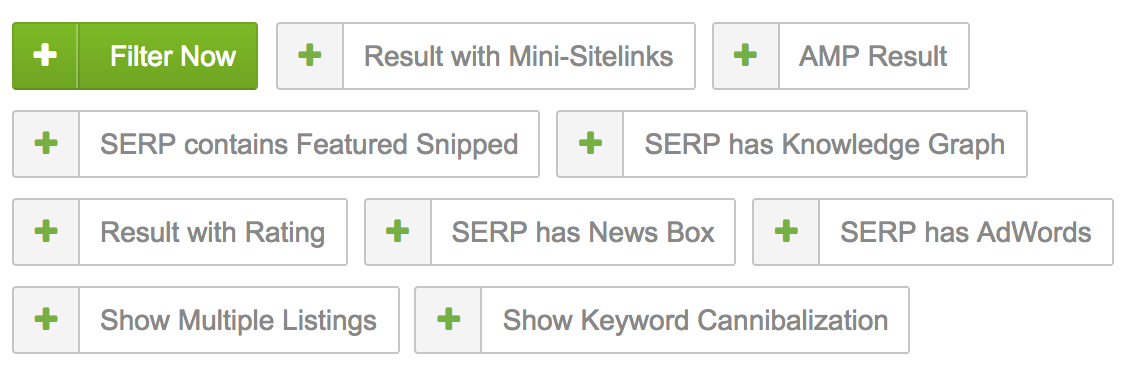
But please do not let the quickfilters stop you from using any combination of filters in any way you like. For professionals we also added our expert-filters: with these you can freely combine, nest and logically link your filters.
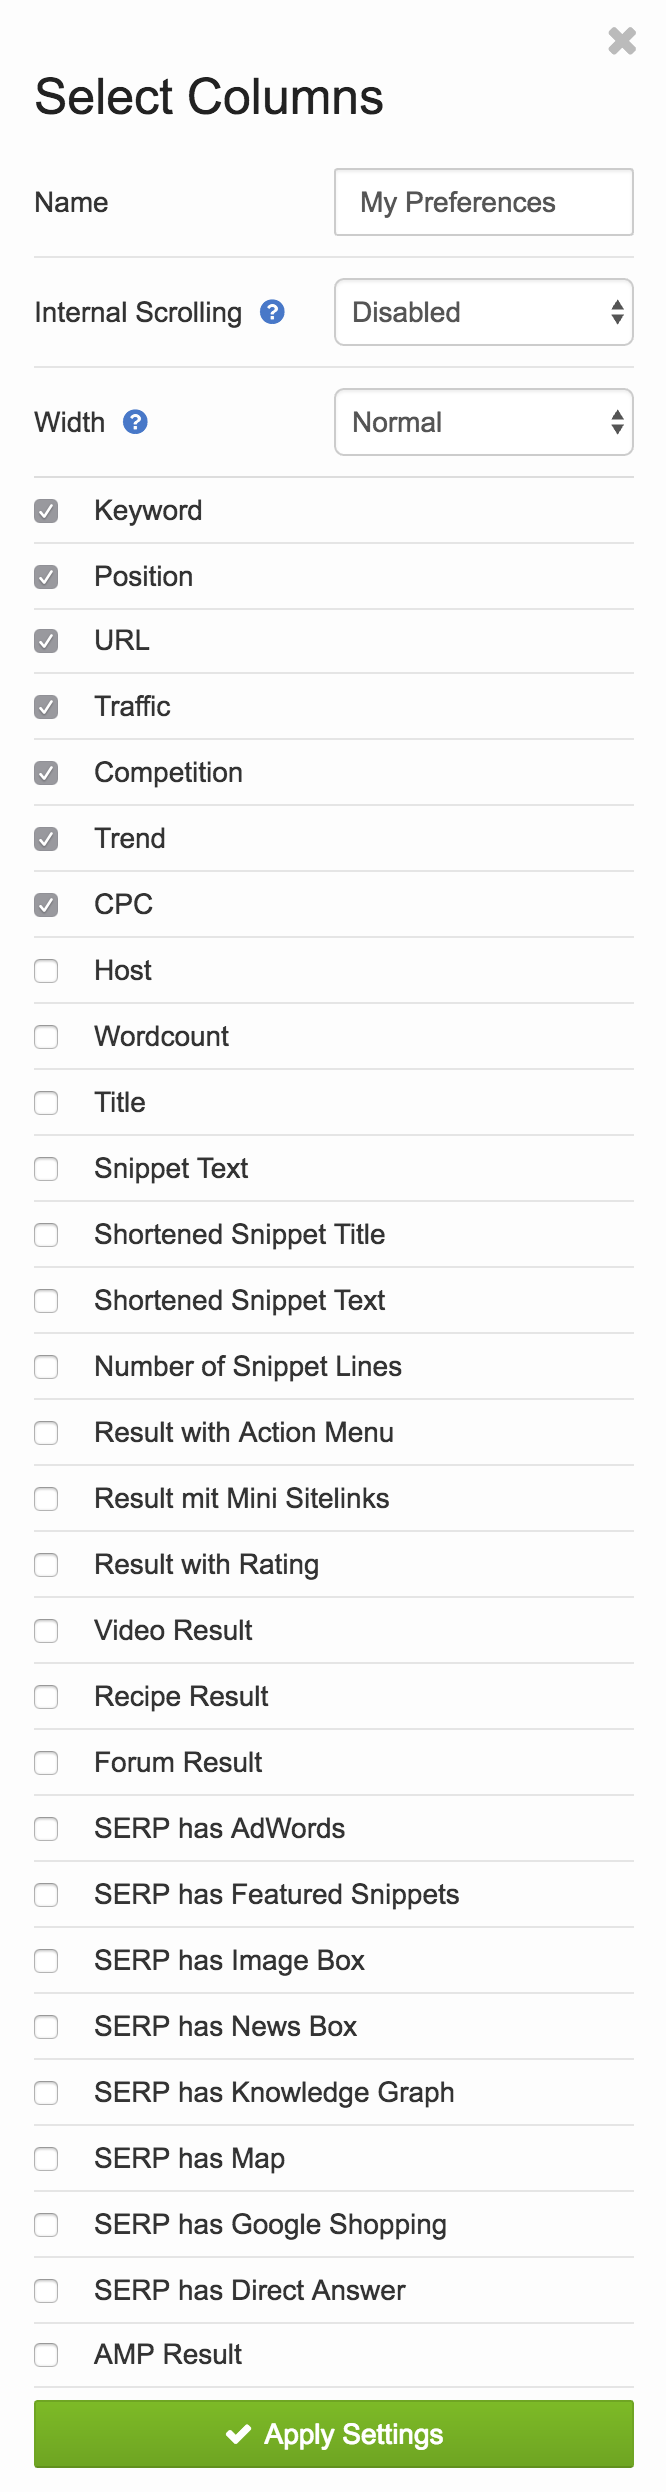
Maybe you have already noticed in some of our screenshots that there are now a vast number of additional columns available for the keyword data. Depending on the data source, you can now show and filter through up to 40 different informational sources for a keyword.
Besides such obvious and well known values as the rankings, you also have information on how the result looked in the SERPs. You can show the title for the result and the meta-description, right there in the ranking table. But that is not all, you can also show and filter things like results with video-preview pictures, recipe-markup, AMP notifications and many other pieces of information from the SERPs.
Aside from the specific traits a result may have, we also save more generic traits for each keyword/searchresult. You are now able to check if there is a Google Shopping result above the organic SERPs, for example. Additional boxes, like the Knowledge Graph, Featured Snippets and much more are also part of our data.
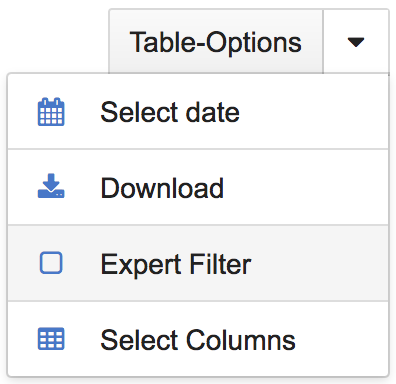
Seeing how most screens are less than 40 inches in diameter, you can now configure exactly which columns you want to see: click on “Table-Options” and “Select Columns” and you can decide on what we show. We will save your selection as a preset so you can switch between different settings whenever you want.
Having this improvement as part of our SISTRIX Labs already gives it away that the feature is currently in its beta-phase. That means we would be happy to hear your feedback and advice, if you want directly to j.beus@sistrix.com.