
In time for the peak of Christmas business we have significantly improved and expanded our methodology for determining the number of units of products sold on the Amazon sales platform.
It is now possible to view a history of products sold as well as the sales figures of retailers and brands. This allows, for example, seasonal fluctuations in sales and revenue figures to be seen at a glance.
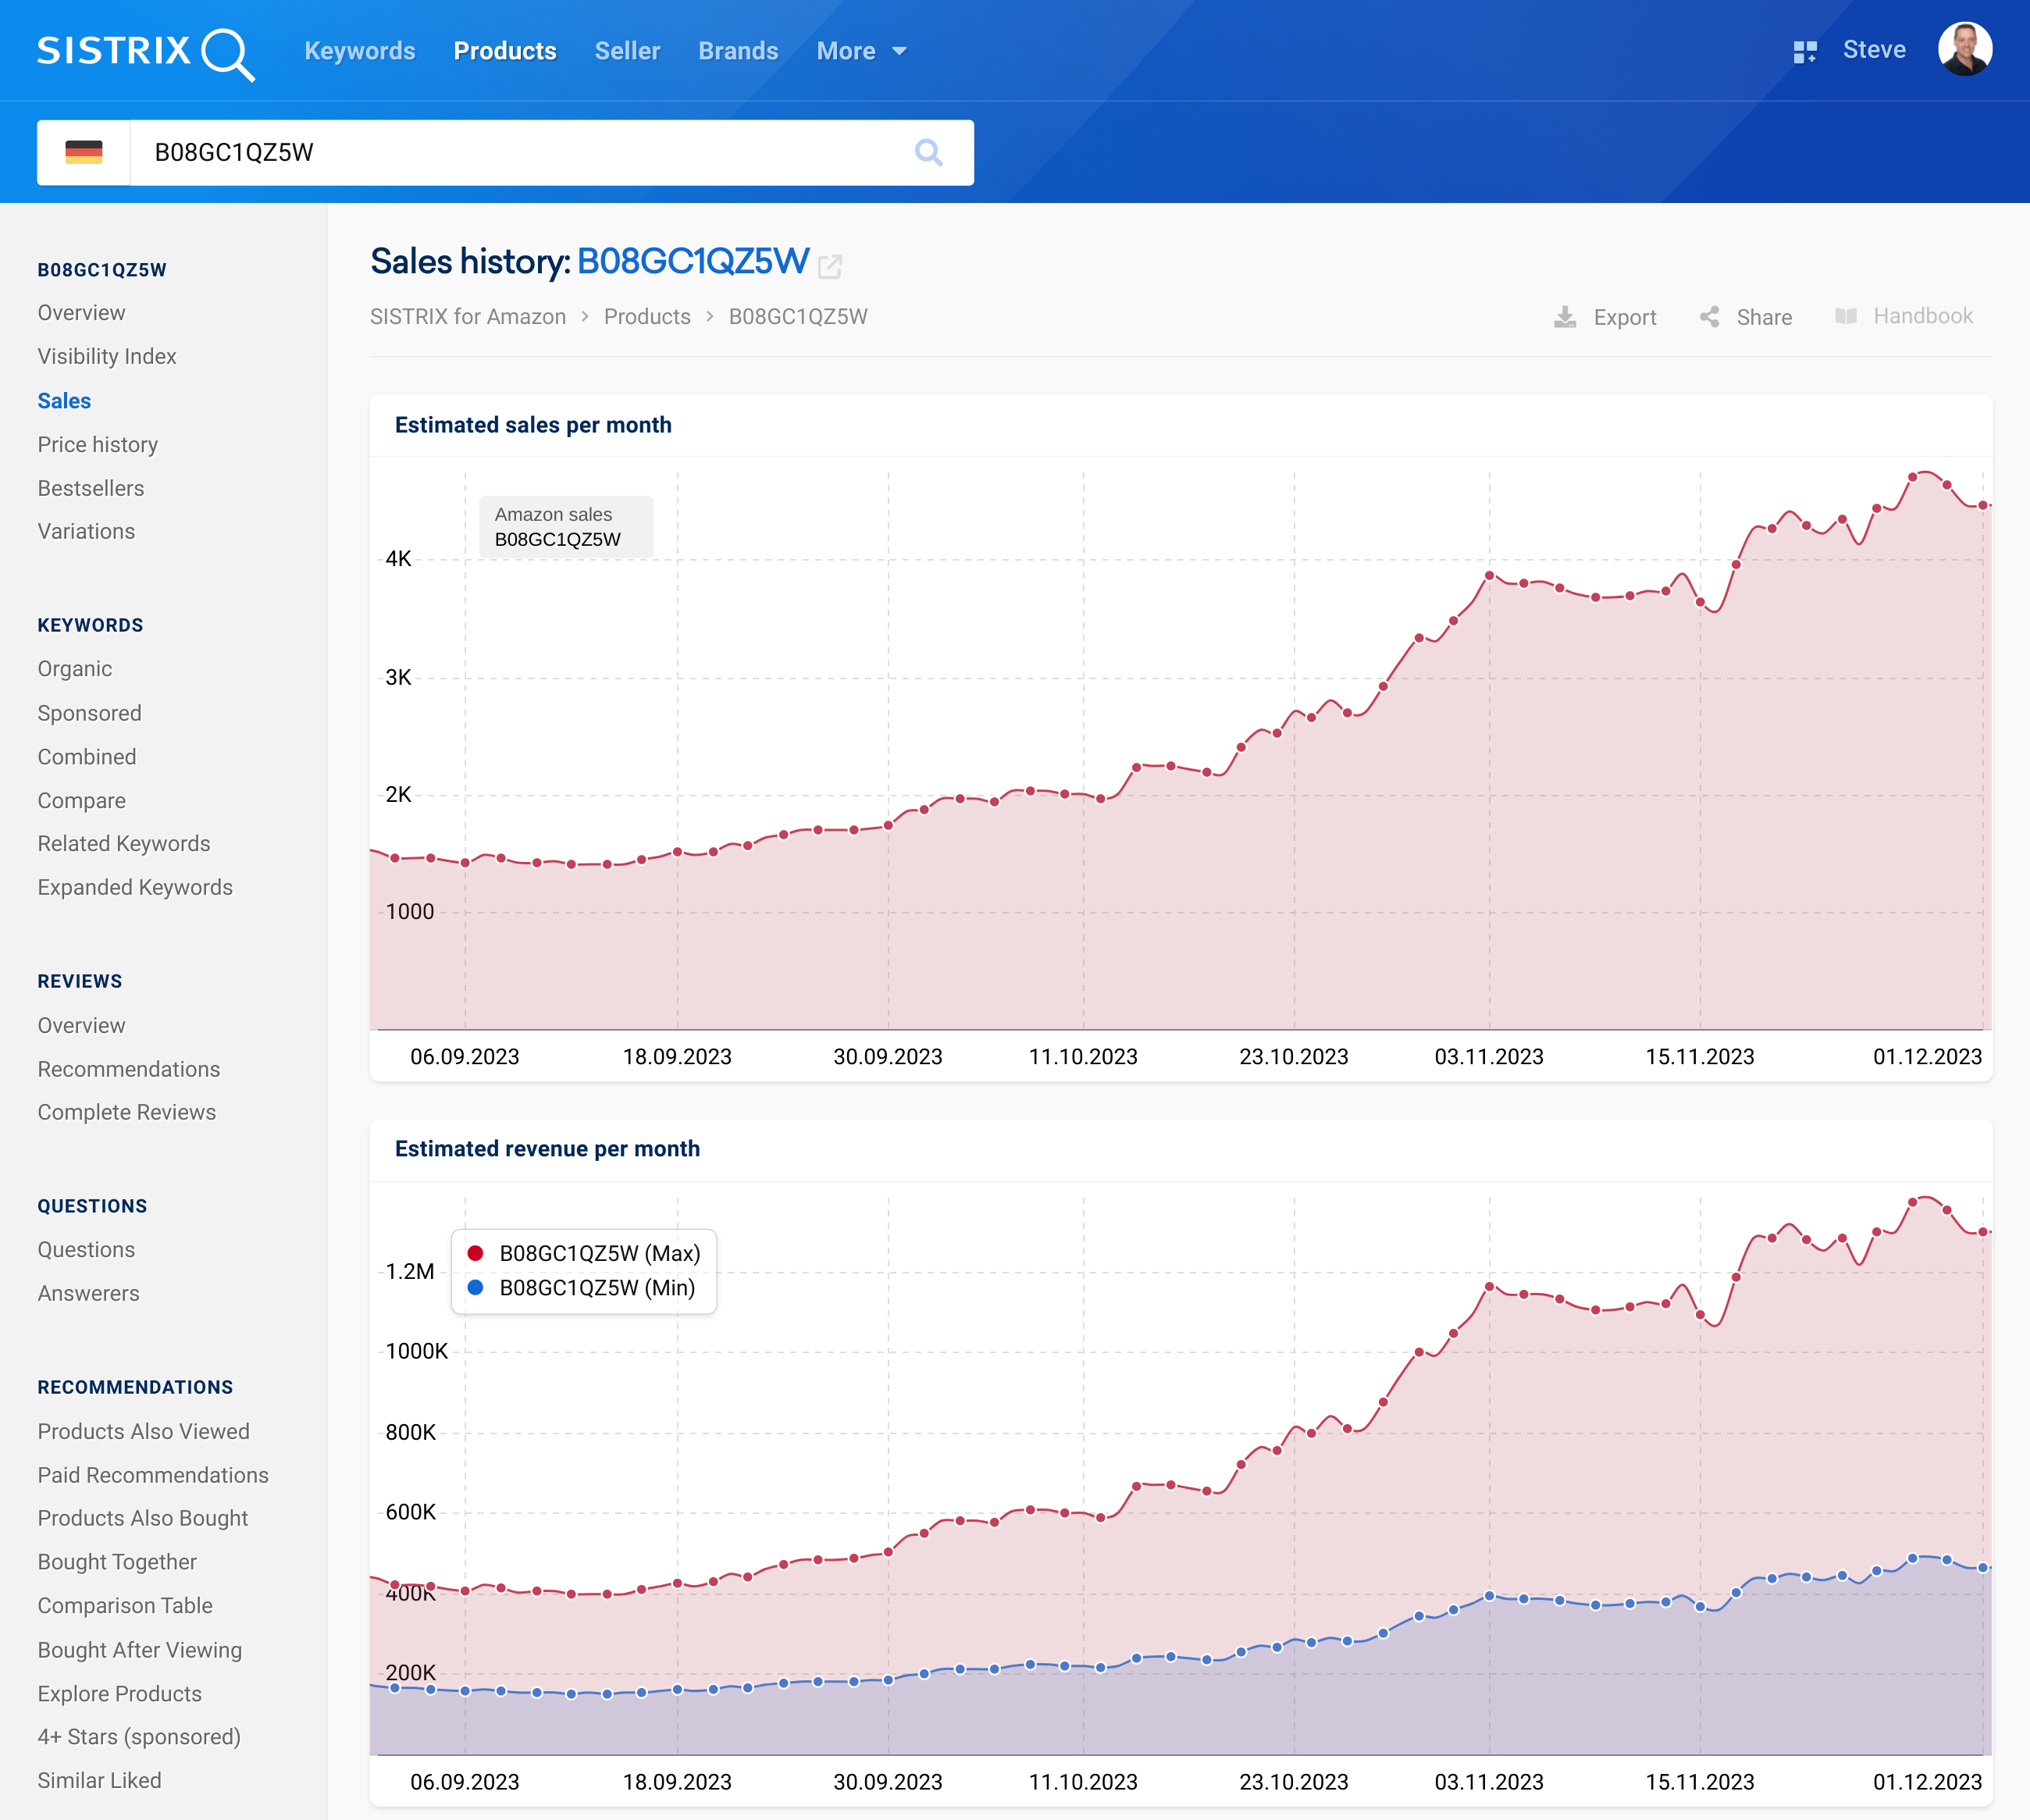
If you enter a specific product, the name of a retailer or a brand in the search slot , you will find the new view under “Sales” in the navigation on the left.
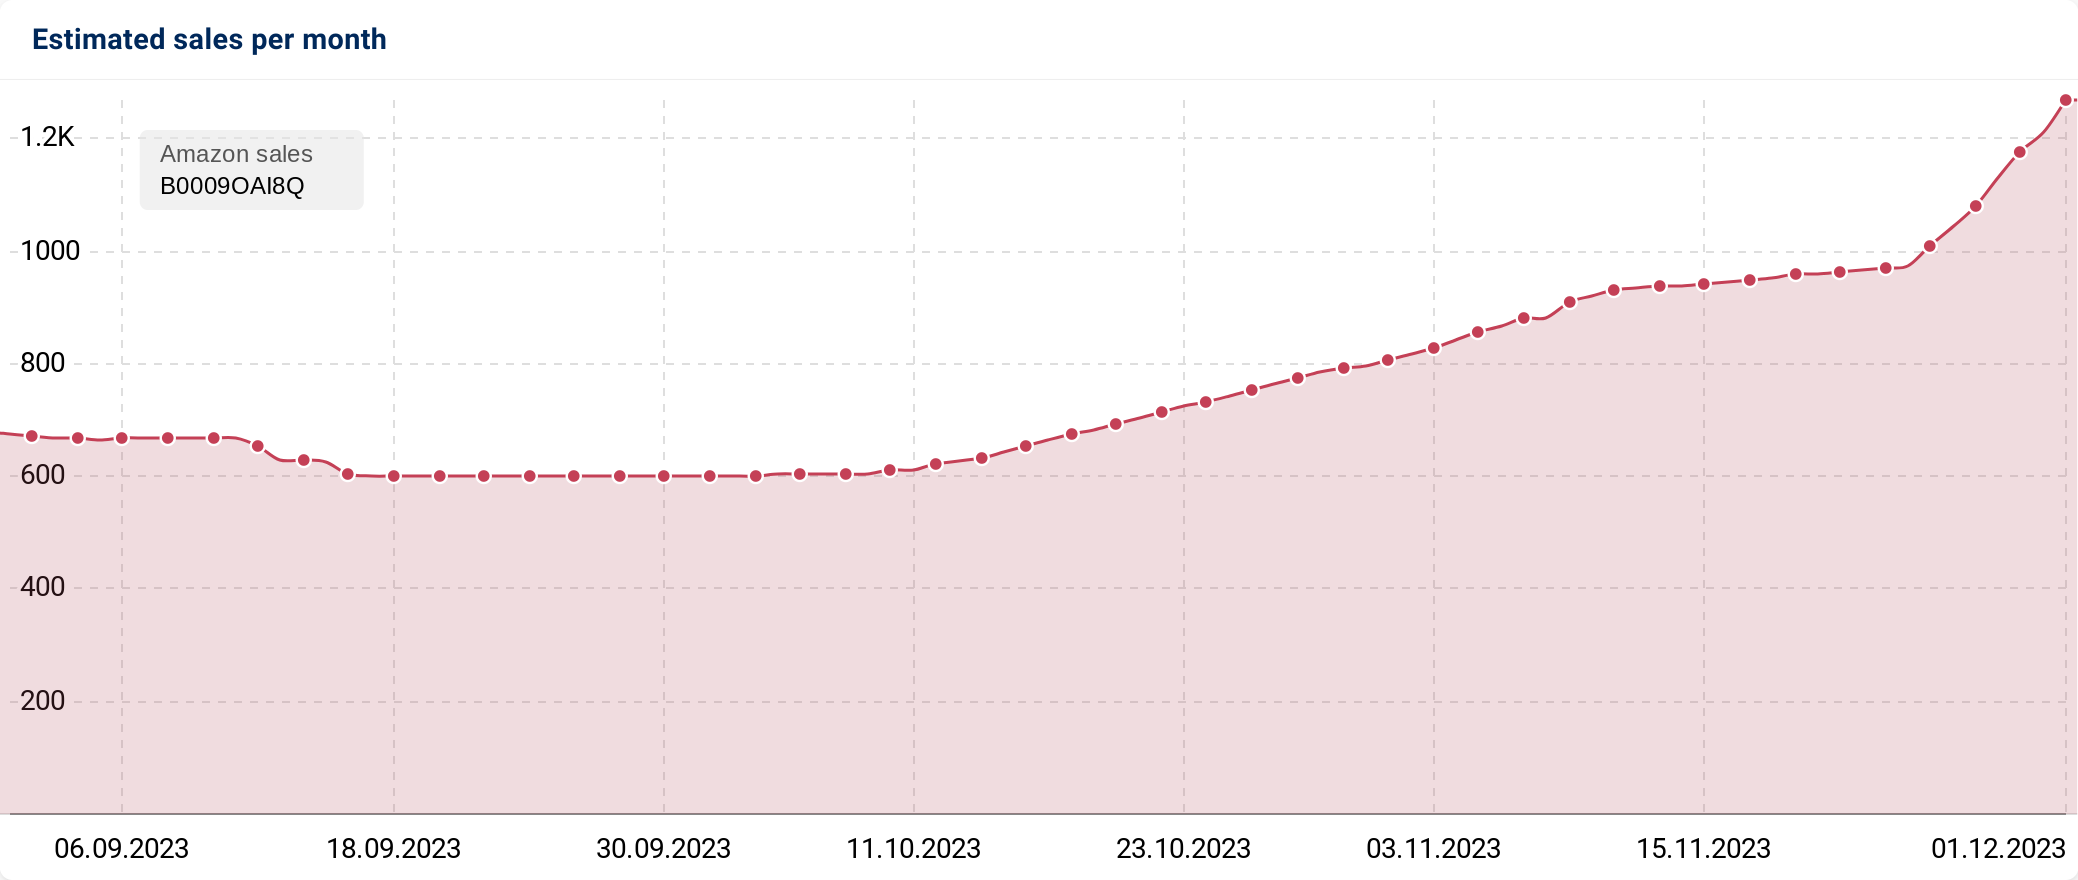
For a product like “Elizabeth Taylor White Diamonds Eau De Toilette, 100 ml” you can see, for example, that the sales figures went from just under 700 units at the end of September to over 2,000 units by December 1st. The Christmas business period is starting!
The numbers always refer to the previous month – a moving total. E.g. The number from December 1st, 2023 correspond to sales from November 1st, 2023.
In addition, the sales of all variants or versions of a product are always added together. For example, different color or size variants.
For the calculation, all estimated sales of the retailers who sell this product are summed up and presented together.
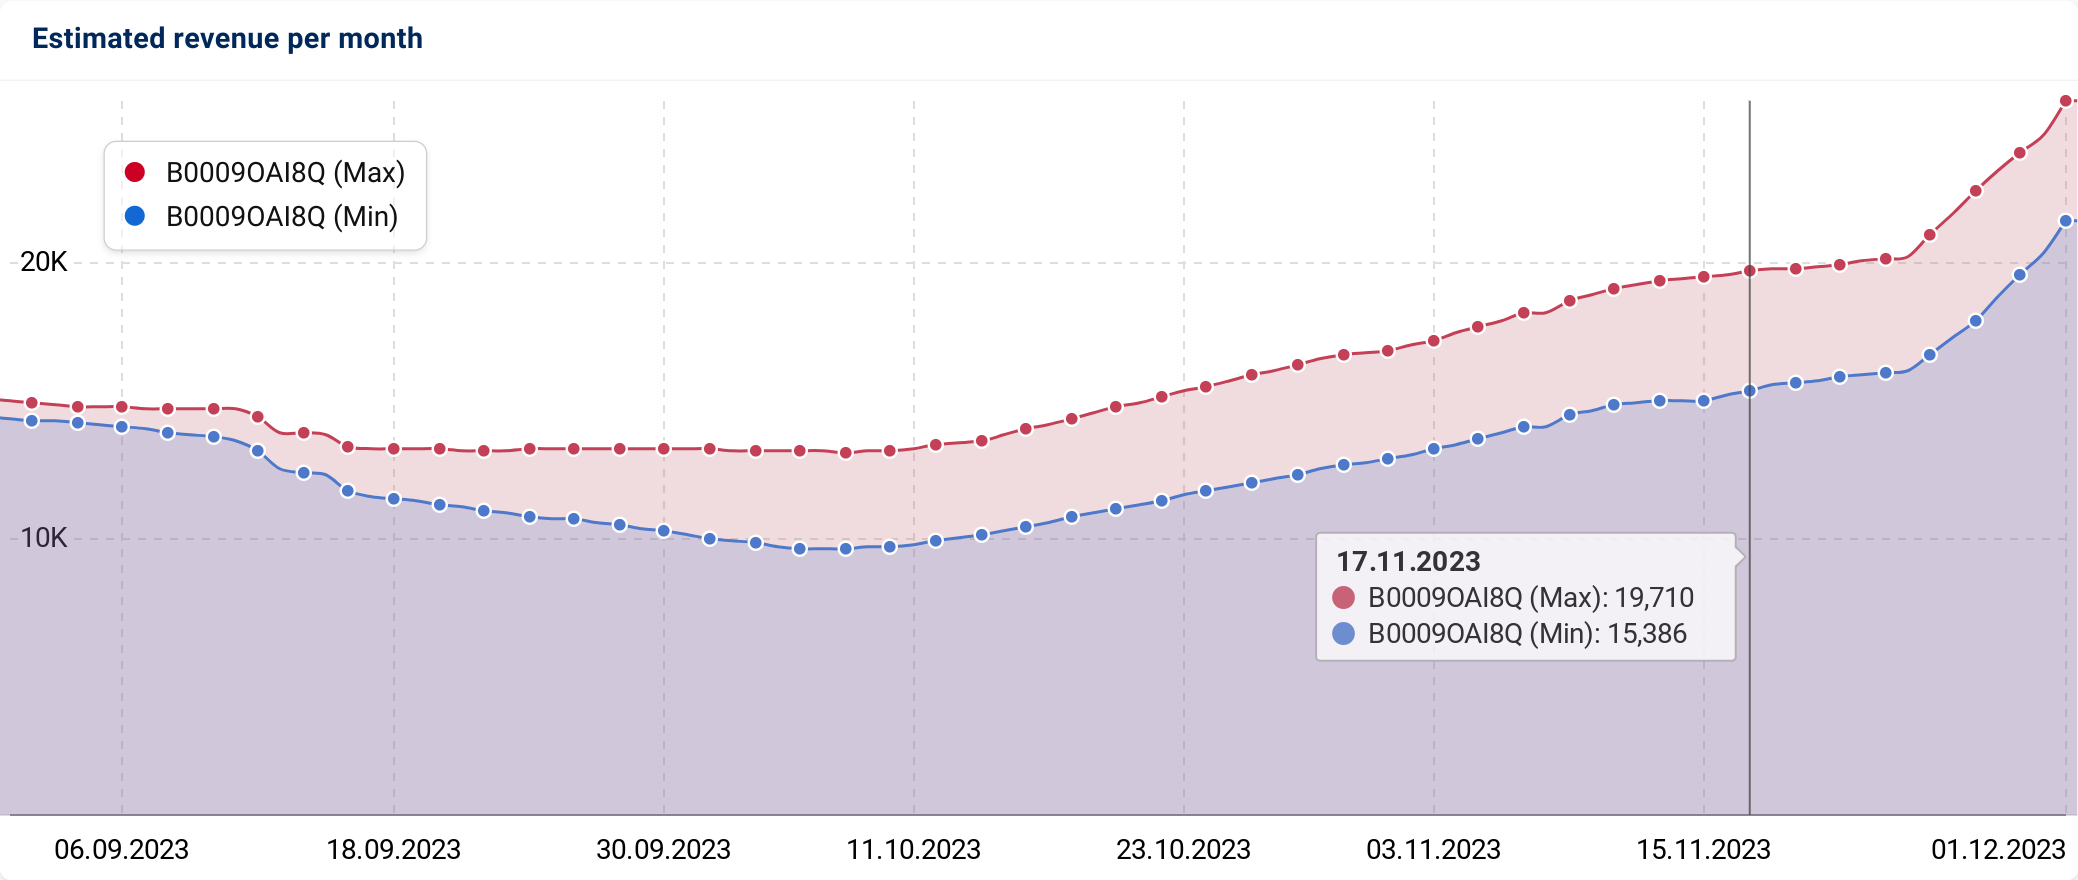
In the second graph you can also see directly what the total revenue (here in euros) the sale of this product brought in.
All sales values are estimates or projections, as the exact sales figures are not visible to us either.
For this reason and because of the combined variants of a product, we always indicate a minimum and a maximum value (red and blue graph) of the sales figures, whereby the values are sometimes more and sometimes less close to one another due to various factors. The truth probably lies somewhere in between.
We also determine a ranking for the sales and turnover figures. In the two graphs at the bottom of the page you can see what rank the product (or the retailer, the brand) had over time.
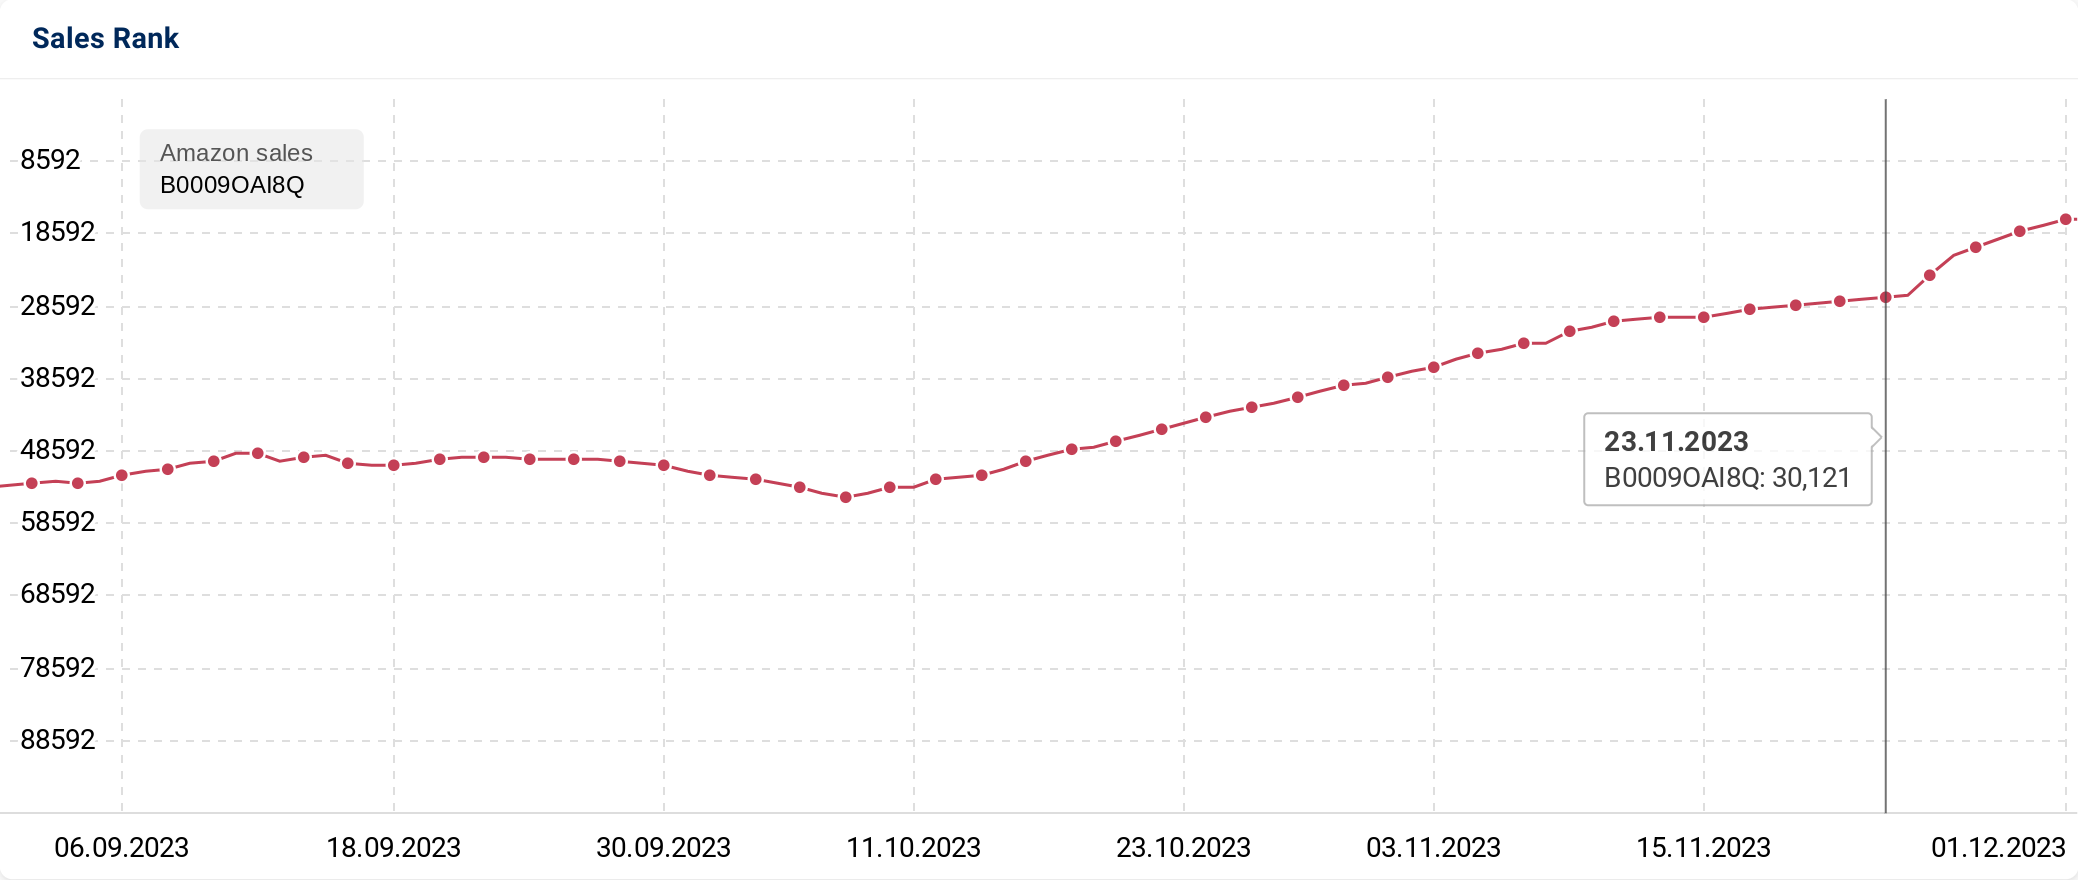
On December 1st For example, there were 30121 products that were sold more frequently than our perfume example.
Just as the histories can be analyzed for individual products, it is also possible for retailers and individual brands.
Examples for November:
- LEGO: 504000 sales per month
- Nike: 41000 sales per month
- Samsung: 89000 sales per month
- Morrisons: 2612000 sales per month