
You can compare up to seven domains in the Toolbox and thus gain an initial overview of the most important key figures of certain domains. This tutorial will show you how this works.
Quick Overview of Important Key Figures
A regular comparison with your competitors will give you information about how successful you are with your domain. You can easily get a quick overview of the most important key figures such as Visibility Index, Keywords or Links with SISTRIX.
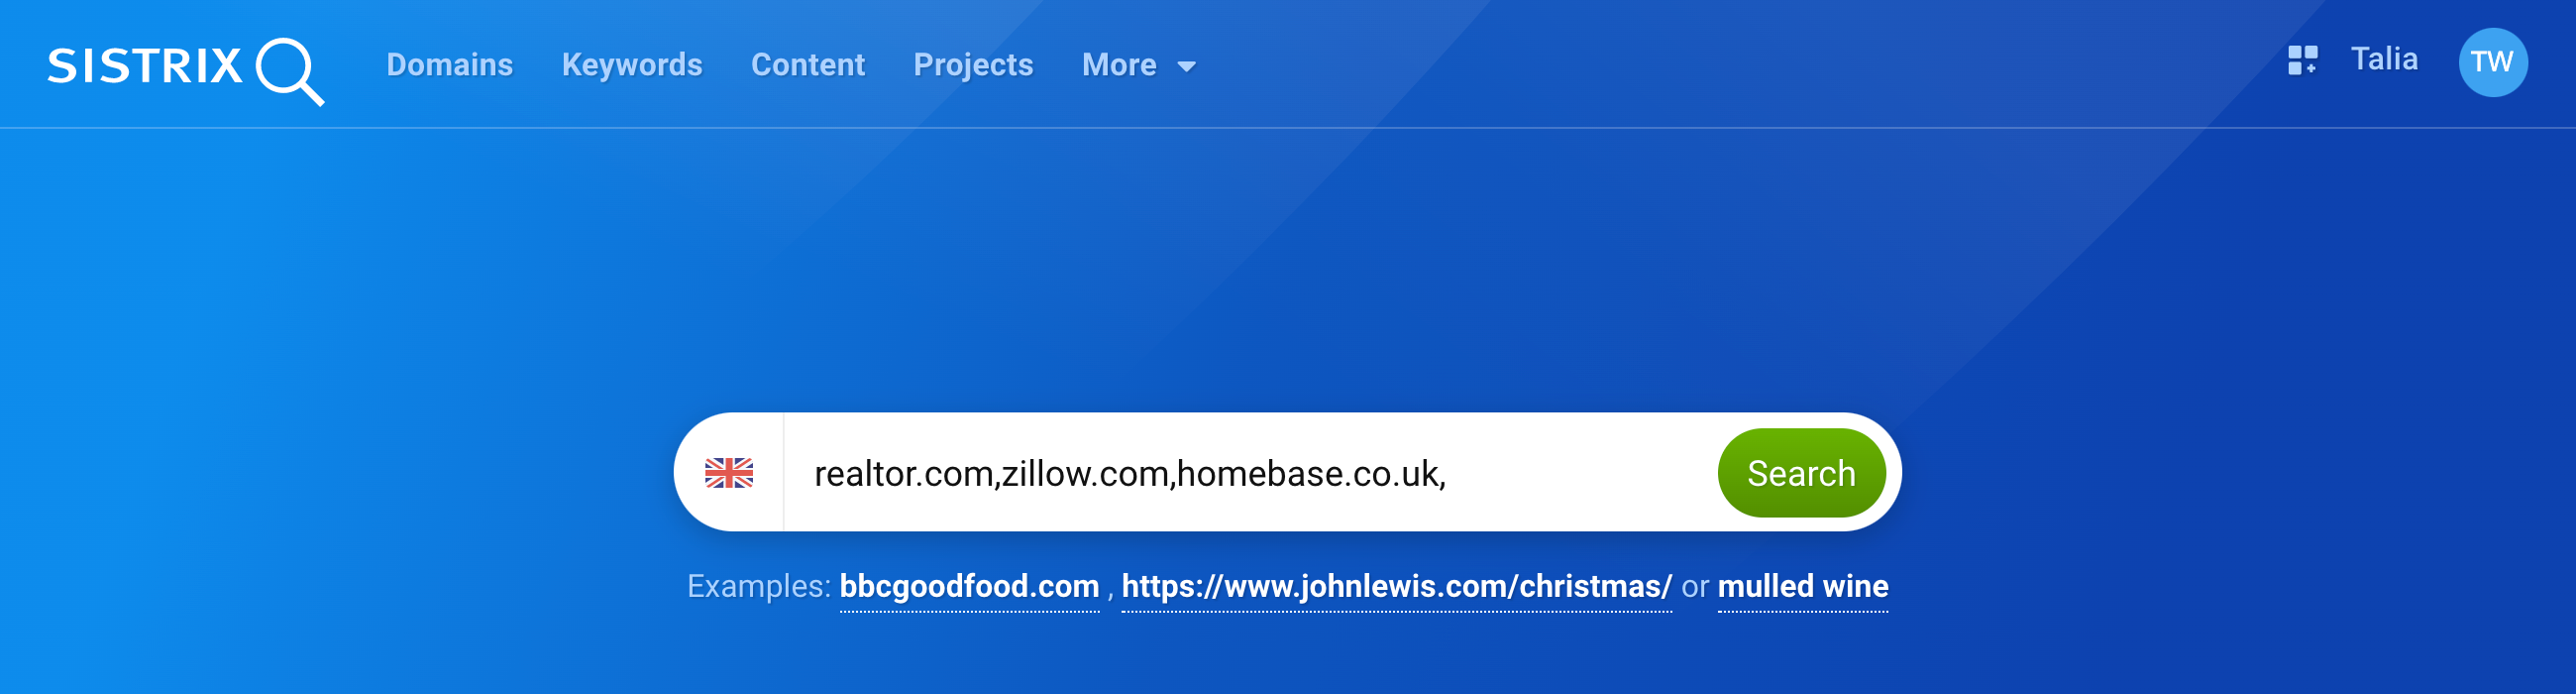
To do this, enter up to seven domains into the search field on the homepage of the SISTRIX Toolbox. Divide these with a comma, but without using spaces. This will open up a table and different data boxes in which all domains are compared directly.
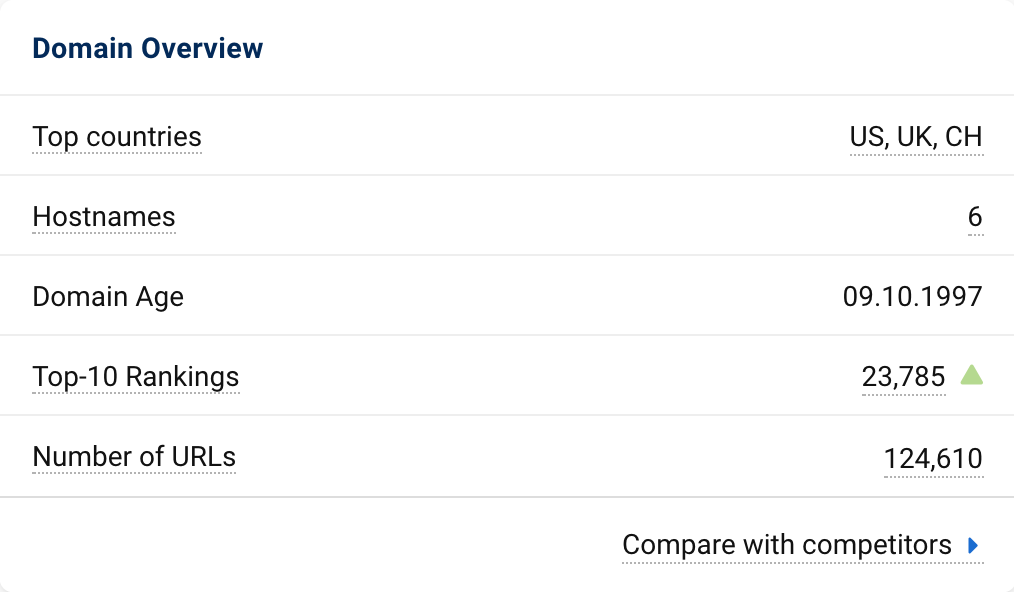
If you are on the domain overview page and have already entered a domain into the search field, you can also use the “Compare with competitors” link inside the “Domain Overview” box, in the image below at 1.
After entering all domains, the full comparison will look as follows.
Comparison of Key Figures
We start at the top of the domain comparison page.
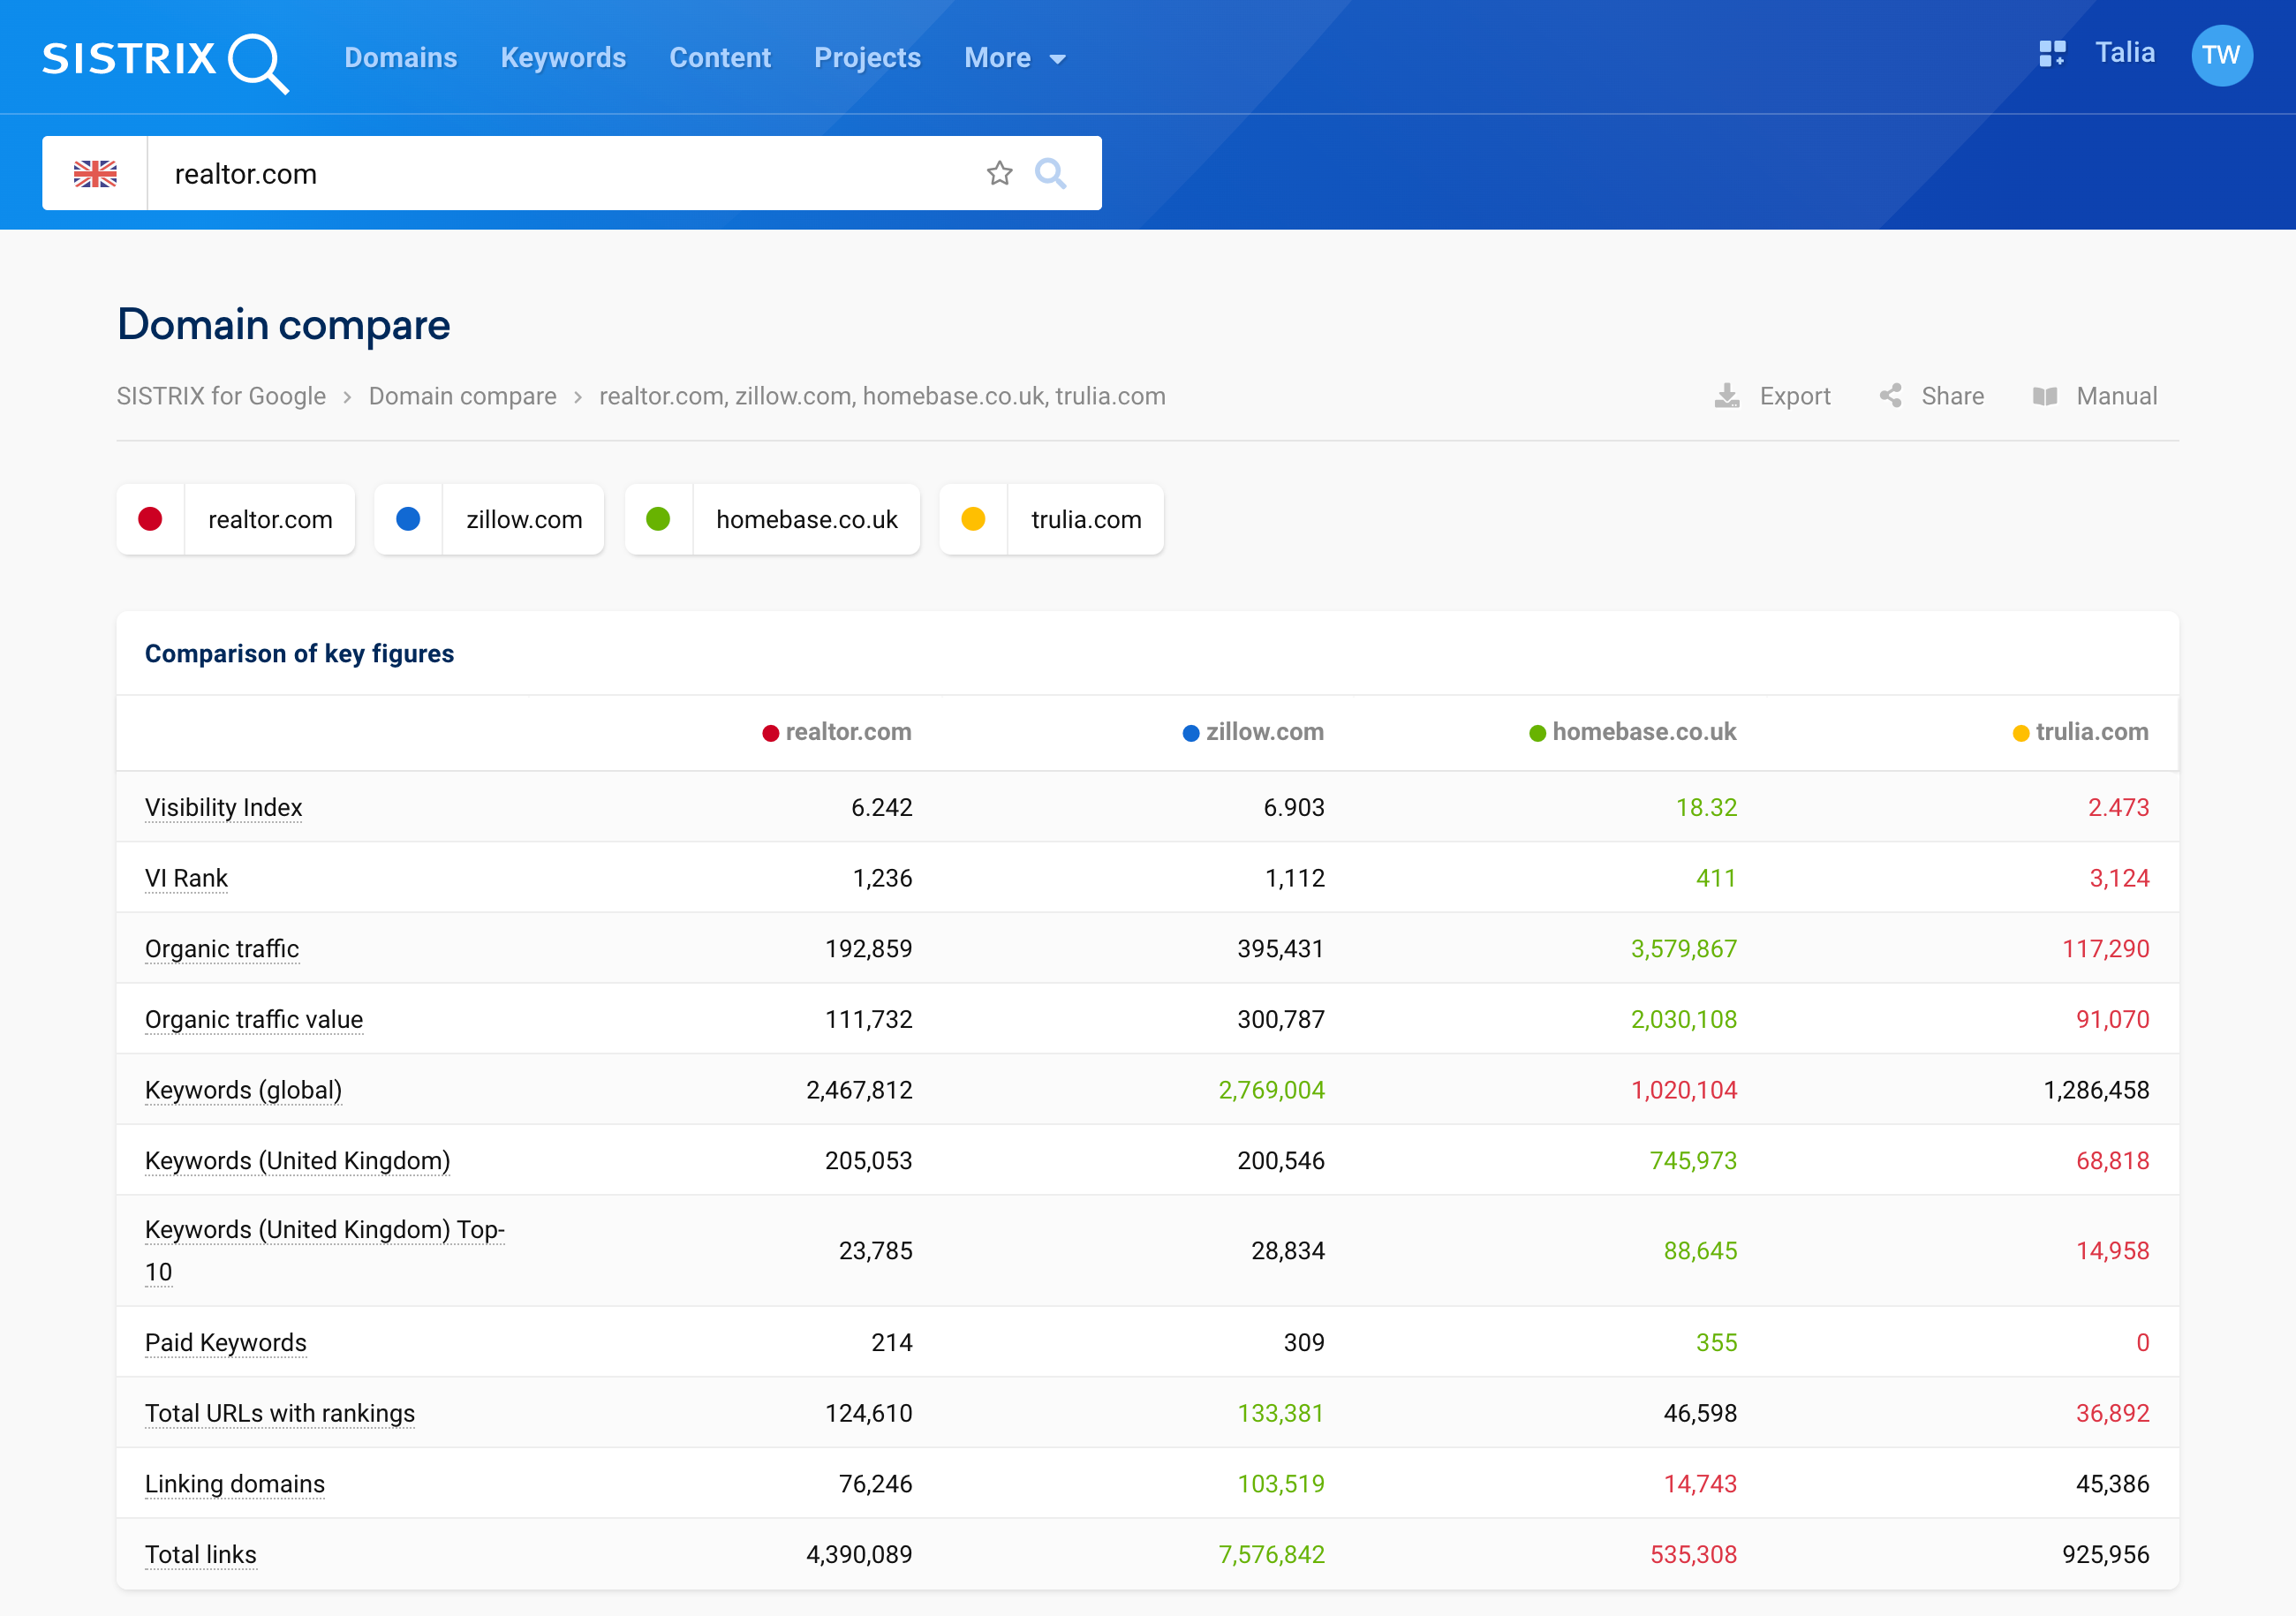
Here, you will get a good overview of important key figures of the domains. The figures of the domain that is in the lead are marked in green. Accordingly, the figures of the weakest domain in the respective category are marked in red.
At a glance, you can see that the domain homebase.co.uk dominates in many figures. The domain trulia.com, on the other hand, generally has the lowest values. Homebase.co.uk also has the highest Visibility Index with 18.32 points.

If you would like to take a closer look at certain figures of your domain, you can simply click on the underlined name in the left column 1 of this overview.

If you have mistyped a domain or want to quickly enter another one, you can simply correct this via the URL 2.
Below this table, you will find further interesting data boxes.
Search Intent
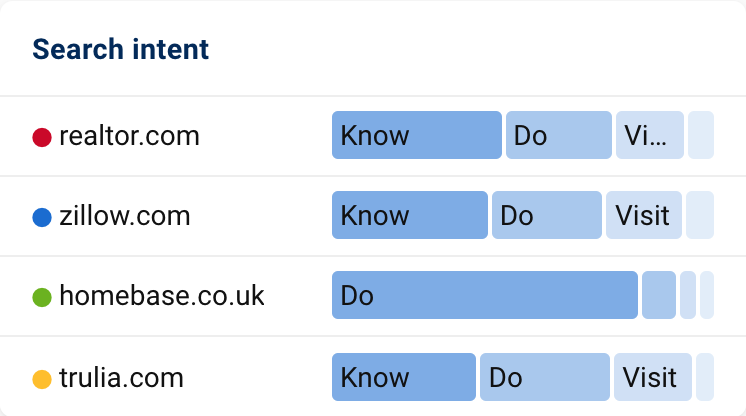
In the “Search intent” data box, you can see at a glance what users are usually looking for when they come across a particular domain. Do they have a “Do” intent, or are they looking for information about something and therefore have a “Know” intent?
If you go over the blue bars with your mouse, you will find more detailed information about the intents. You can also see for how many keywords of the respective search intent the domain ranks, for example.
Device Distribution
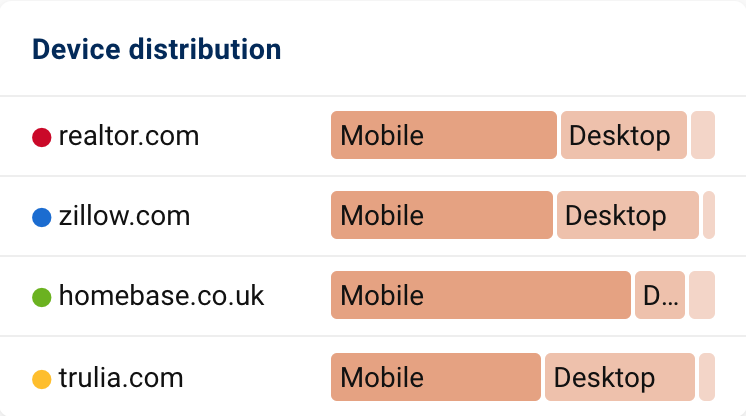
In the data box for “Device distribution”, you can see how the domains are usually accessed. In our example, we can see that the domains are frequently accessed via mobile. Compared to the other domains, homebase.co.uk is accessed more often via mobile.
Here, too, you can get more detailed information by moving the mouse over the bars.
Core Web Vitals
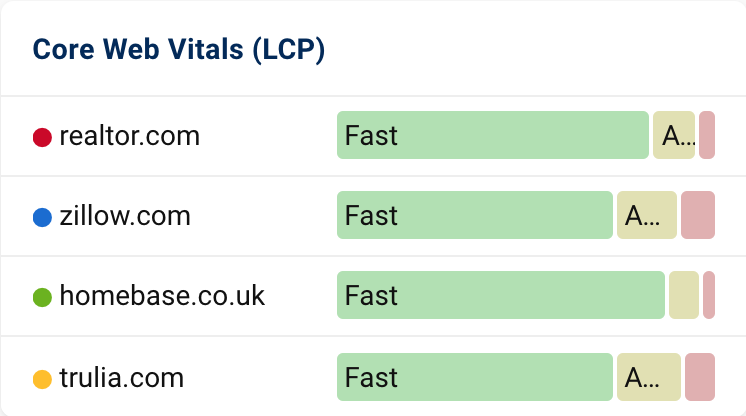
In the “Core Web Vitals” data box, you can see how much time passes until the main content of a web page is visible to users in the browser (Largest Contentful Paint). In this example, all pages of the domains load “quickly”. Only zillow.com and trulia.com have a slightly higher proportion of “average” loading pages than the other domains.
As with the other two data boxes, you can also view more detailed information here.
Visibility Index
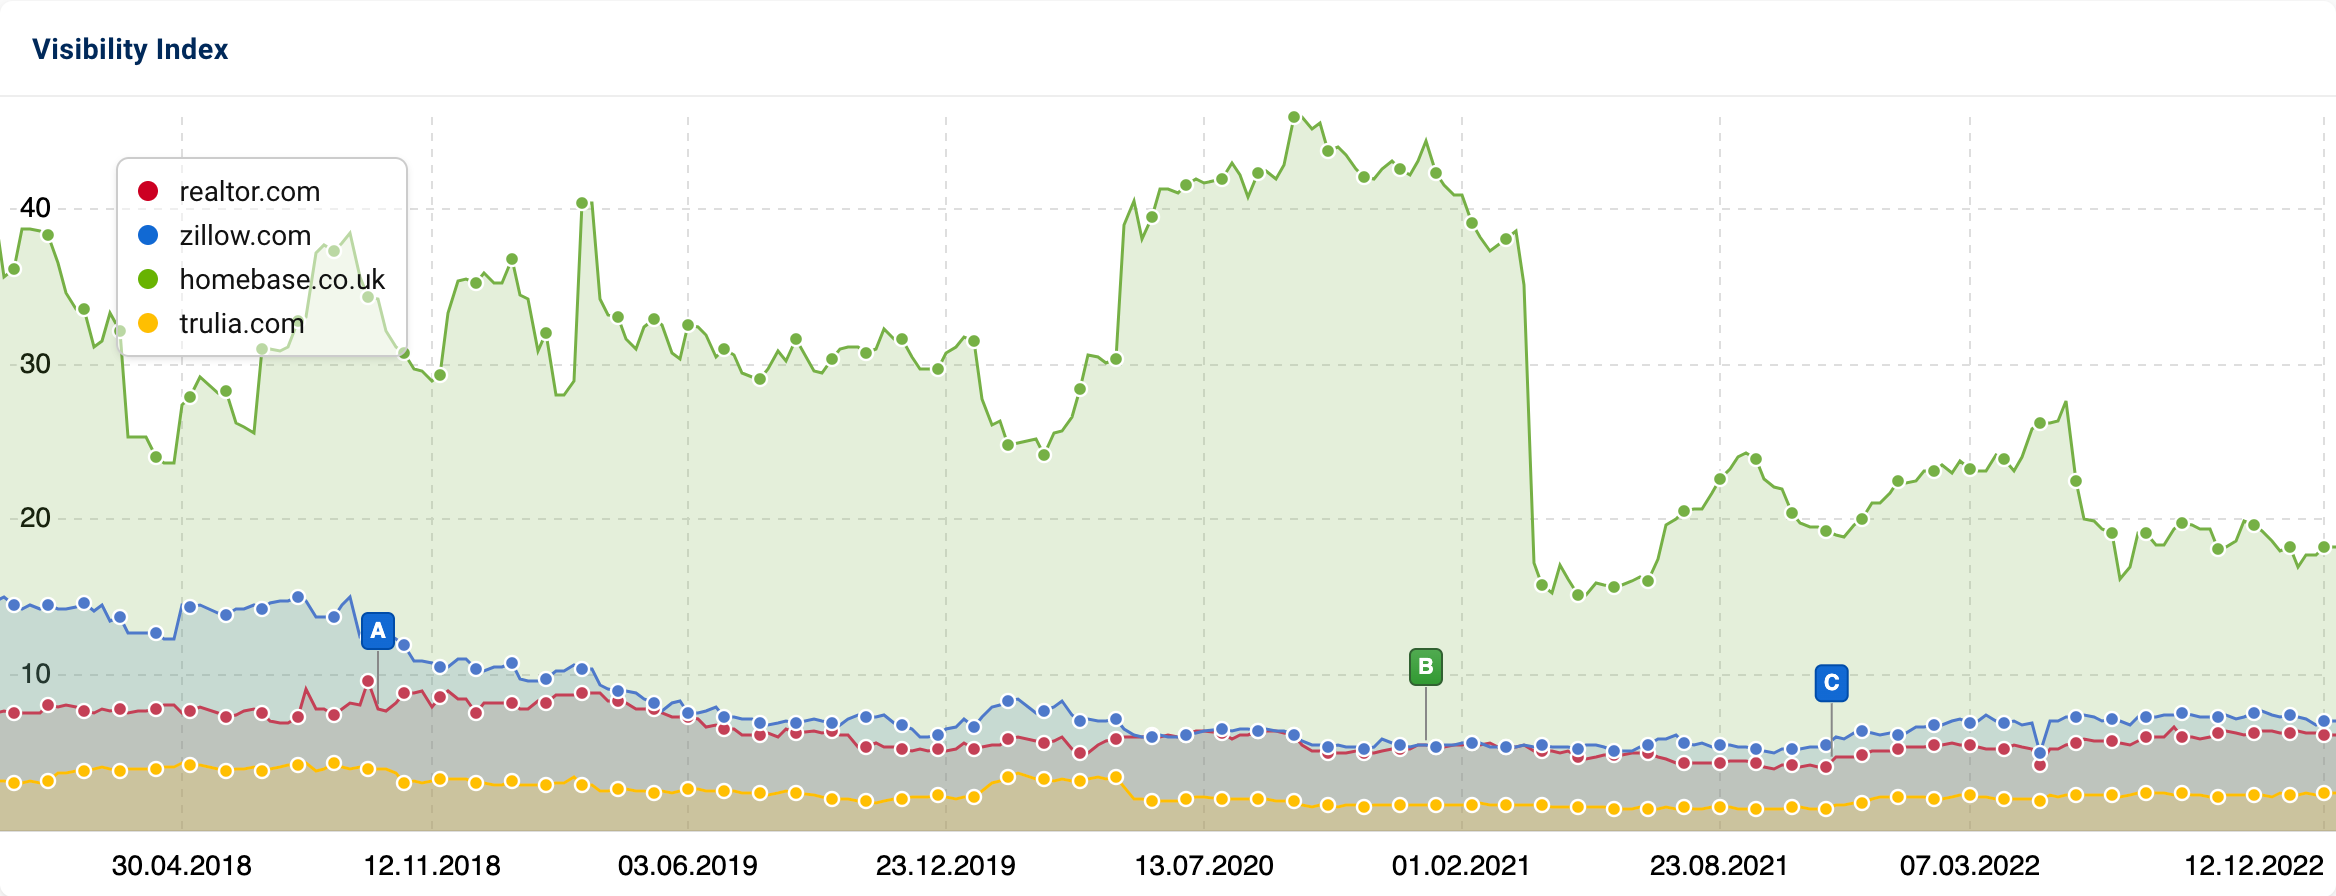
The last data box on the domain comparison page is the history of the Visibility Index of the respective domains. Here, you can see at a glance how the respective Visibility values of the domains relate to each other and how they have developed over time.
If you move the mouse over the graph, you can view the Visibility values of the domains at specific time periods.
Conclusion
With this domain comparison, you can gain an initial overview of the most important key figures of certain domains. This way, you will know, for example, where you stand in relation to your competitors and can then make rough estimates. If a figure or a development catches your eye, you can carry out further analyses for each domain separately in the SISTRIX Toolbox.