
Besides other data in the Onpage projects, information about the Core Web Vitals can also be accessed for specific domains, in the “Structure” section. Here you can see the Field Data from Google Chrome and analyse the performance of every website you want.
In this section we use the so-called field data. These are collected by Google’s Chrome browser and measured by a user panel. This means that this data is only available if a sufficient number of Chrome users visit the corresponding domain. The data is updated in the middle of each month for the previous month.
General Options
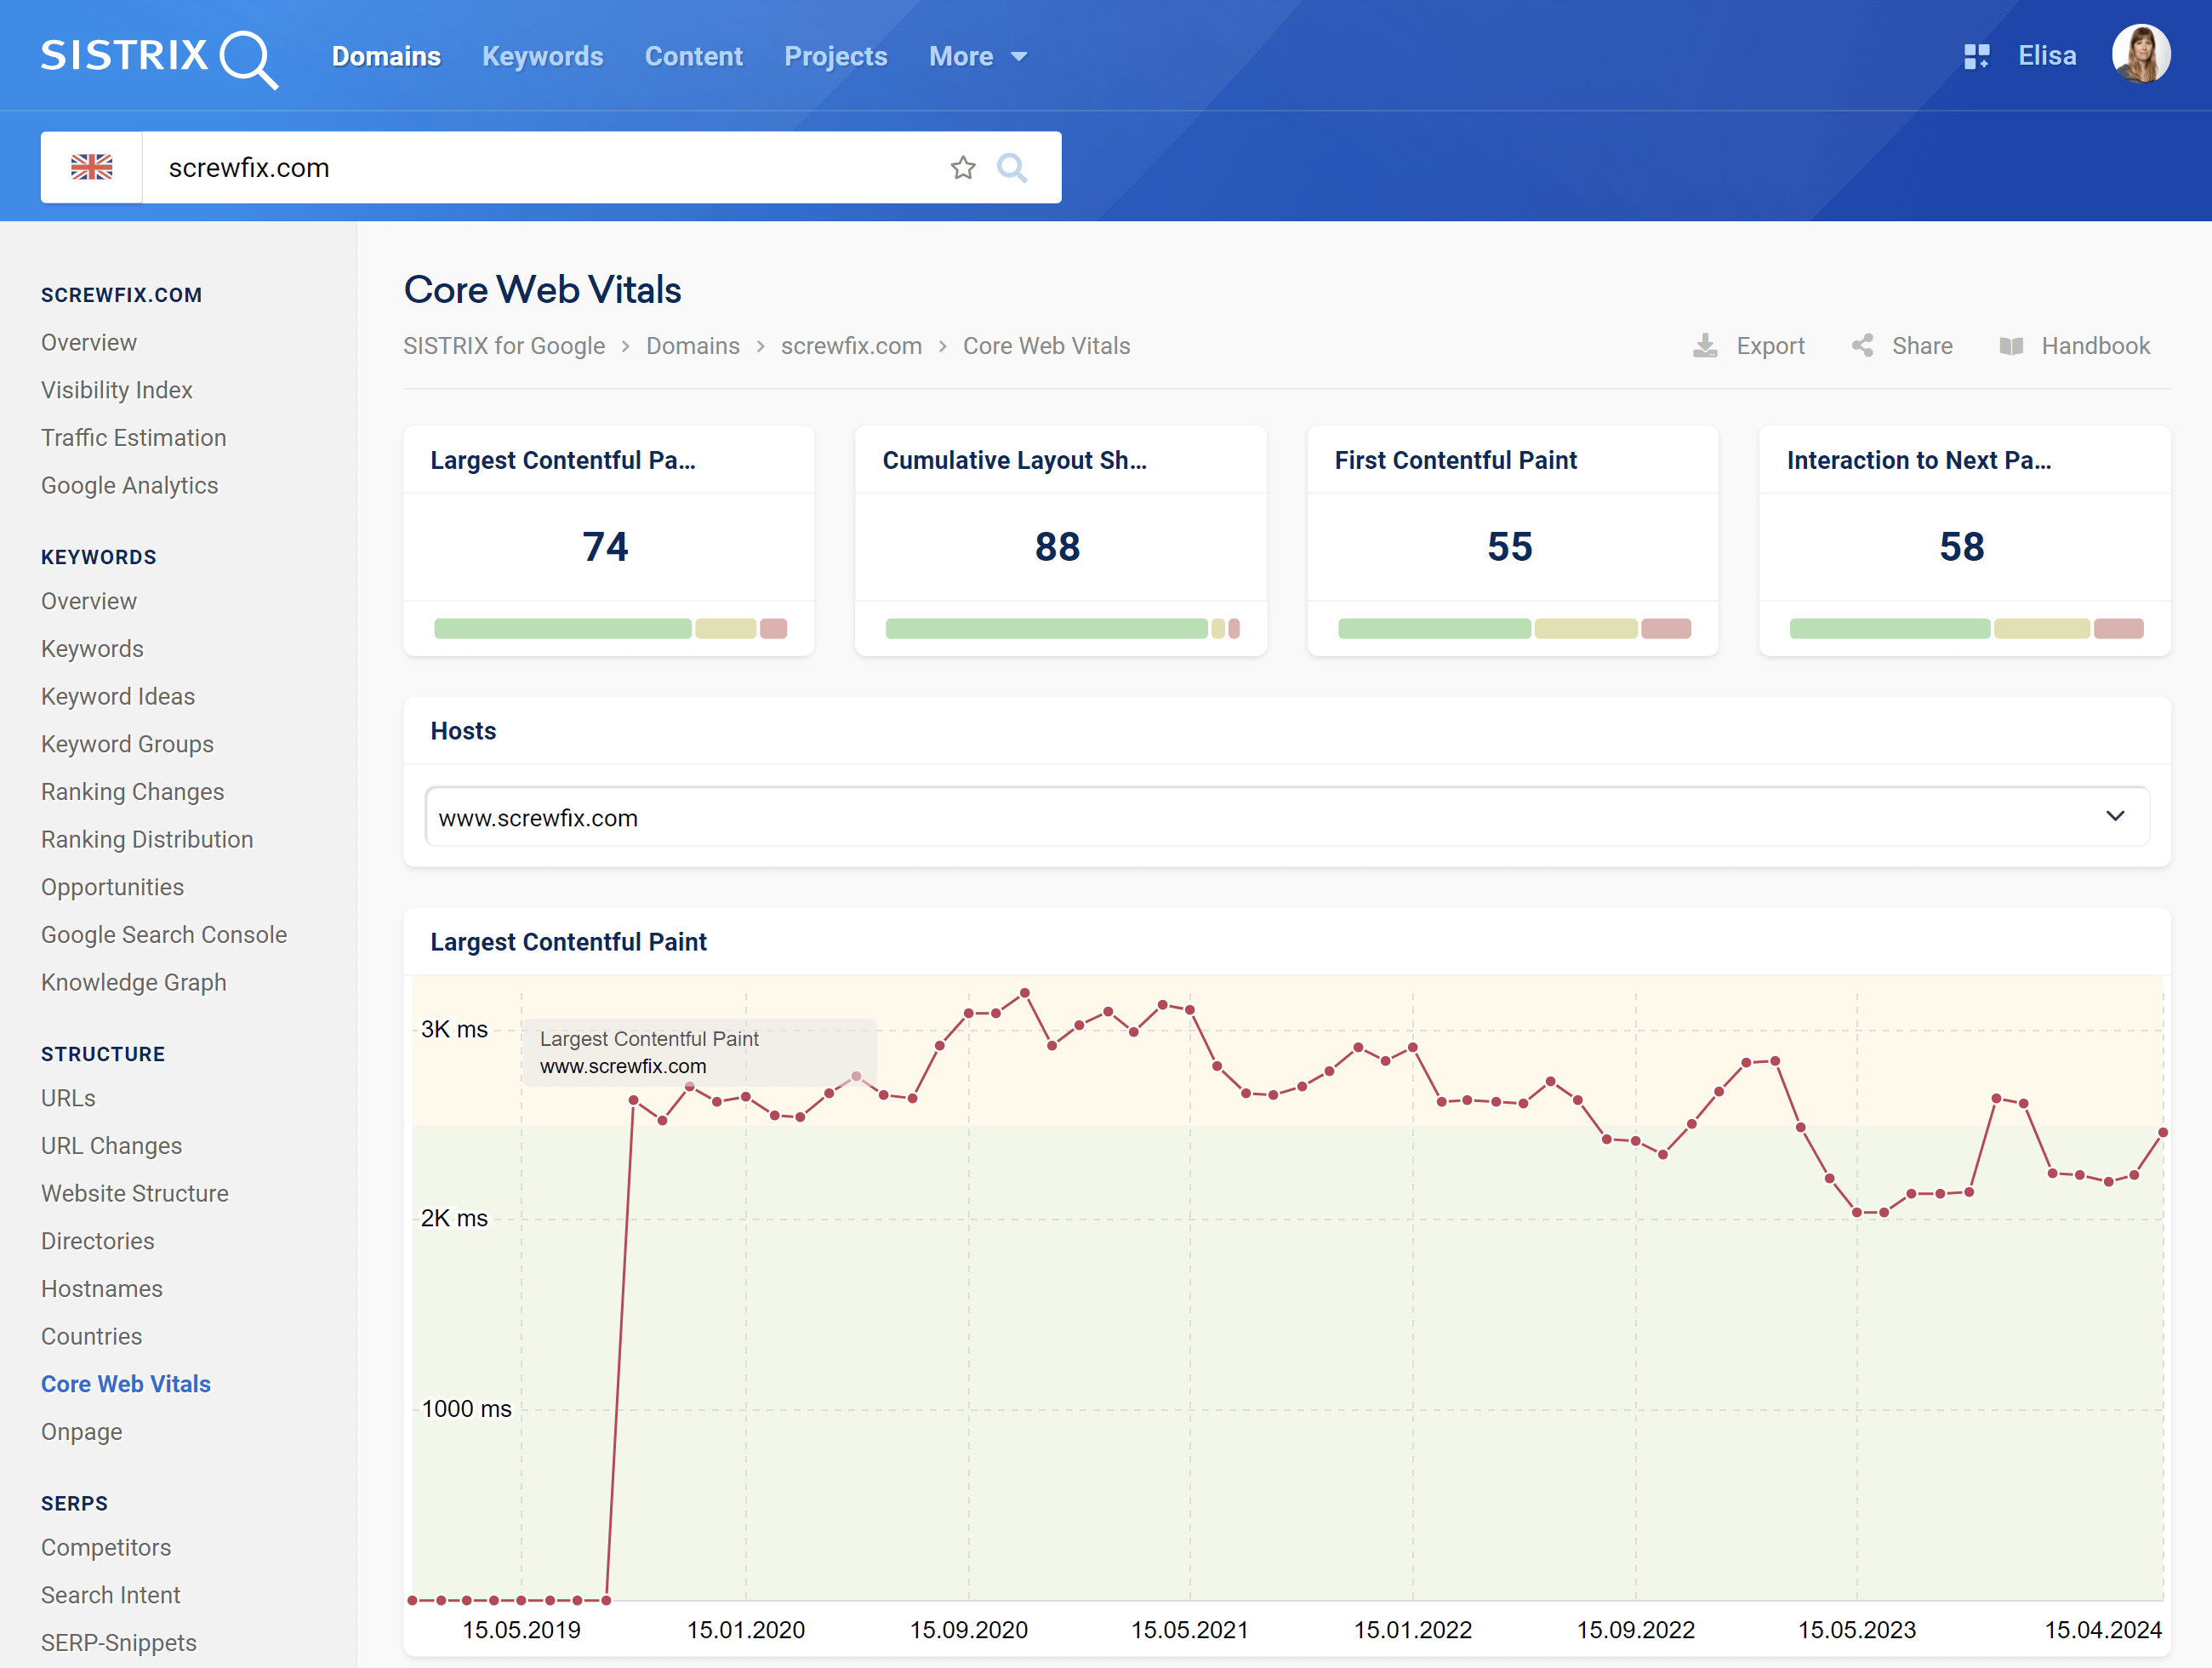
At the top right corner of the page you’ll find general settings for the whole page.
There you can switch between mobile and desktop values, export the data or share the live page on Social Media.
The data depends on the Country chosen for the evaluation, which is displayed in the search bar at the top left corner of the screen.
Core Web Vitals – Values
The four boxes show the actual values of the three Core Web Vitals:
- Largest Contentful Paint: How much time passes before the main content of the website is visible to the user in the browser.
- Cumulative Layout Shift: Does the content of the page jump around during its loading? And, if yes, how far are the elements moved?
- First Contentful Paint: The time from when a piece of content is shown for the first time to the user’s browser
- Interaction to Next Paint: The page’s overall responsiveness to user interactions by observing the latency of all click, tap, and keyboard interactions that occur throughout the lifespan of a user’s visit to a page.
Besides the actual values, you can also see their distribution according to Google’s performance expectations. The green bar shows the percent of users where the value was considered positive, the yellow bar indicates the values which need improvement and finally the red bar shows the poor results.
Core Web Vitals – Graph
The graphs show the historic development of the Core Web Vitals for the analysed domain. According to their performance, the values are distributed in three colours:
Largest Contentful Paint (LCP):
- Good (green) – less than 2,500 milliseconds
- Needs improvement (yellow) – up to 4,000 milliseconds
- Poor (red) – more than 4,000 milliseconds
First Input Delay (FID)
- Good (green) – less than 100 milliseconds
- Needs improvement (yellow) – up to 300 milliseconds
- Poor (red) – more than 300 milliseconds
Cumulative Layout Shift (CLS)
- Good – less than 0.1
- Needs improvement – up to 2.5
- Poor – more than 0.25
Interaction to Next Paint (INP)
- Good – less than 200 milliseconds
- Needs improvement – up to 500 milliseconds
- Poor – more than 500 milliseconds
Hover the mouse on the chart to see the value of the corresponding Core Web Vital for a specific date. You can also zoom into a specific date-range by holding the mouse button down and selecting the range you would like to focus on, or click on “Fullscreen” to let the graph fit your entire screen. You can move the mouse cursor over each value and we will show you the values.
The values are updated monthly.