
The SISTRIX Visibility Index is a value for the visibility of a domain in Google’s search results. By using the Visibility Index, success in Google SERPs can be measured reliably and transparently.
The Visibility Index is a key-performance-indicator for the visibility of a domain (respectively the host, directory or URL for detailed-evaluations) in Google. It is calculated using the sum of all organic rankings within the Top-100 results – for a representative keyword-set which has been defined by SISTRIX. The rankings are weighted based on search-traffic and position per keyword.
- Updated daily
- the change, in percent, to the previous day/week value. (Configurable in settings)
To know more about the Visibility Index please read the following article: “SISTRIX Visibility Index – Explanation, Background and Calculation“.
The order of the boxes in this section of the Toolbox may vary according to the primary index selected in your account-settings.
Visibility Index
This first box shows the value of the Visibility Index for the analysed website within the search engine result pages. According to the object of your analysis, the Toolbox will indicate whether the value refers to a domain, host, directory or URL. Just below the value you’ll see the date when it has been updated.
- Updates: Daily or Live (recalculated every 5 minutes)
- Data-set: Extended database. Many millions of keywords
To know more about the Visibility Index please read the following article: “SISTRIX Visibility Index – Explanation, Background and Calculation“.
Change
Here you can see how much the absolute Visibility Index value has changed from yesterday to today, from last week to this week or within the last month, and how much the Visibility gained or lost over previous periods. You can move the mouse cursor over each value and we will show you both values as well as the change in percent.
- Updates: Daily or Live (recalculated every 5 minutes)
- Data-set: Extended database. Many millions of keywords
Visibility Index: Daily Updates
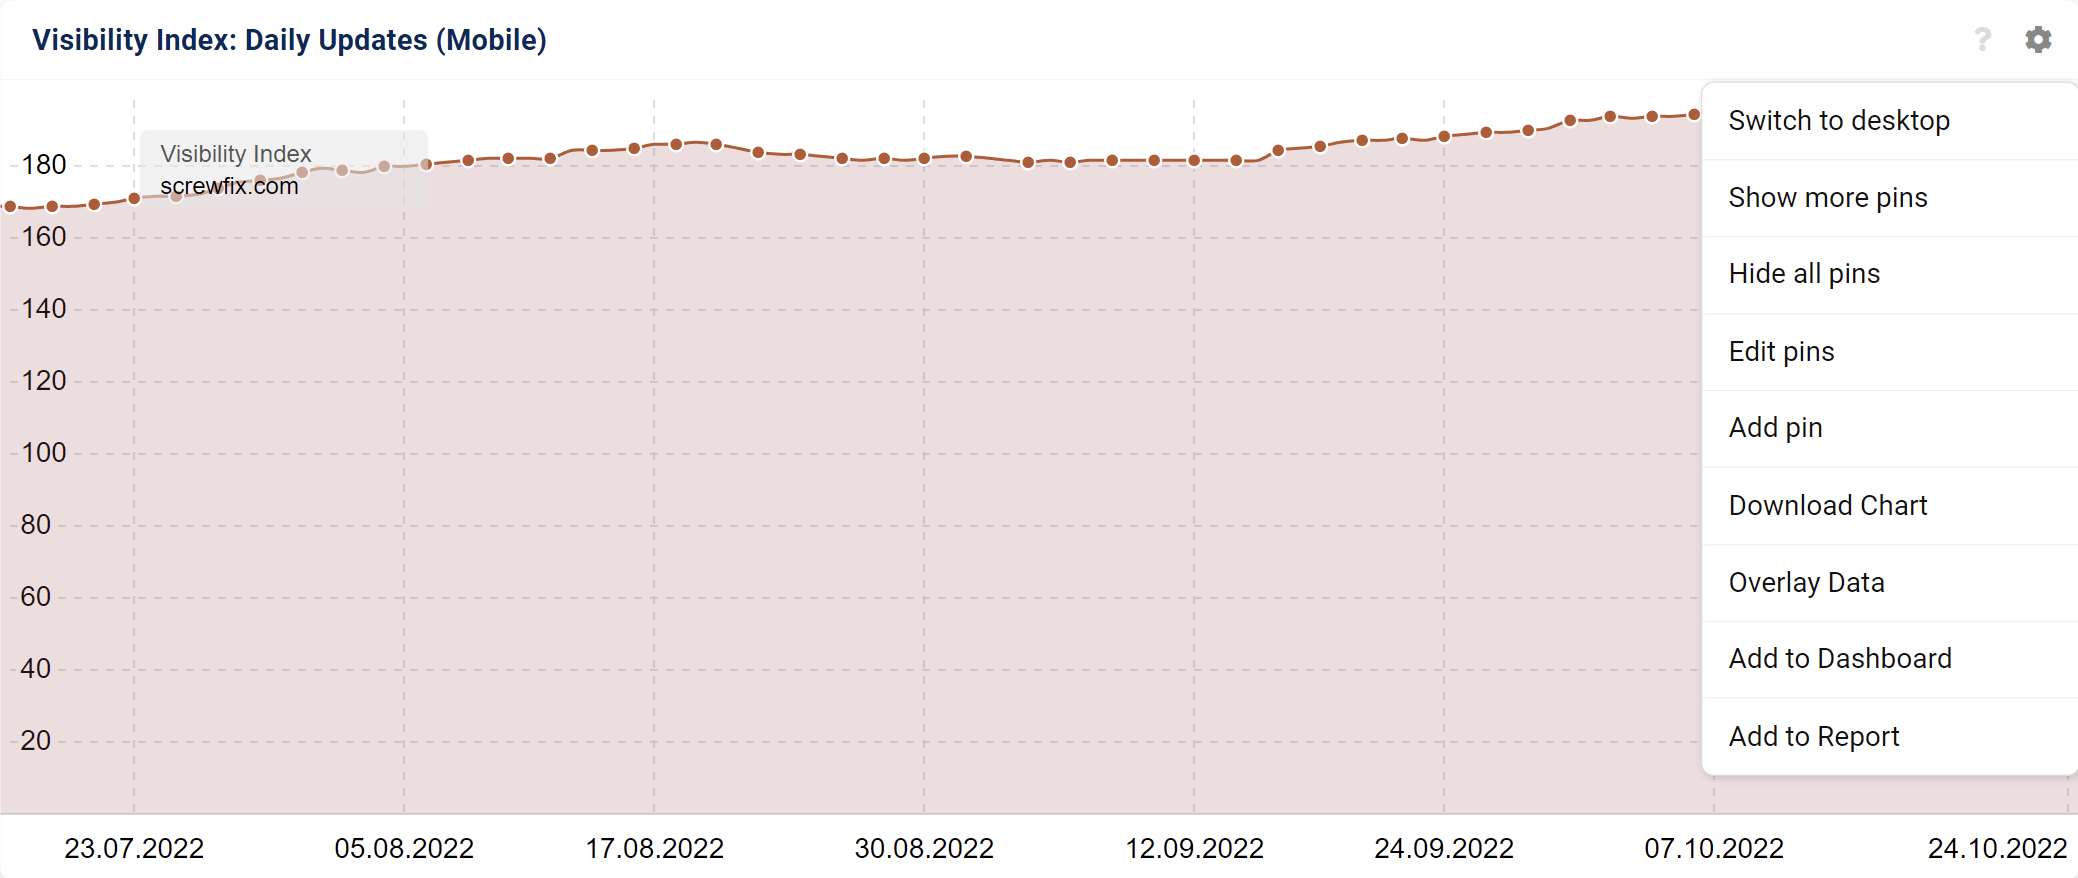
This chart shows the daily development of the visibility index for the analysed domain (or host, directory, URL).
Hover the mouse on the chart to see the value of the Visibility Index for a specific date. You can also zoom into a specific date-range by holding the mouse button down and selecting the range you would like to focus on.
You can also see the ranking keywords for a specific date by clicking on the corrisponding data point with the right mouse button of the mouse and selecting “Show keywords for (domain)”: the Toolbox will automatically take you to the corresponding table.
Note that the cogwheel icon will give you more options to make the Visibility Index useful in your analyses. For example, you can use it to see the desktop chart by selecting the option “Switch to desktop”.
- Updates: Daily
- Data-set: Visibility data: 1 million keywords for desktop and mobile
To know more about the Visibility Index please read the following article: “SISTRIX Visibility Index – Explanation, Background and Calculation“.
Visibility Index: Weekly Development
This box shows you the development history for the SISTRIX Visibility Index for the organic mobile rankings for the domain.
Also in this case, hover the mouse on the chart to see the value of the Visibility Index for a specific week. You can zoom into a specific date-range by holding the mouse button down and selecting the range you would like to focus on. Please also note the numerous options available through the cogwheel in the top right hand corner of this box.
In the options, you are able to decide on which event-pins should be shown and compare the history of up to six domains with each other, among other options.
- Updates: Weekly
- Data-set: Visibility data: 1 million keywords for mobile
To know more about the Visibility Index please read the following article: “SISTRIX Visibility Index – Explanation, Background and Calculation“.
Visibility Rank Graph
The Visibility Index rank shows you the position of the most successful domains for the examined domain. For this purpose, all domains with a measurable Visibility Index are sorted in descending order every day. More about the Visibility Rank.
This box shows you the development history for the SISTRIX Visibility Rank for this domain. Hover the mouse on the chart to see the value of the Visibility Index for a specific week.
Visibility Index Segmentation
Based on the filter that you have set up in the keyword table, we will show you a segmented Visibility Index that only relates to these filtered keywords.
In this case, you can also move your mouse over the graph to see the Visibility Index value for a specific week. You can select a date range by simply holding down the mouse button and highlighting it. Please also note the numerous additional features that are available to you via the cogwheel in the upper right corner of this box.
In the options, you can decide which event pins should be displayed and compare the development of up to six domains.
Updates: Daily or weekly
Data-set: Your filtered keywords