
The domain overview page gives you a quick summary of all the most important SEO KPIs for a specific domain. The data available covers desktop, mobile, daily and weekly SEO KPIs that you’re able to export or share anytime you want.
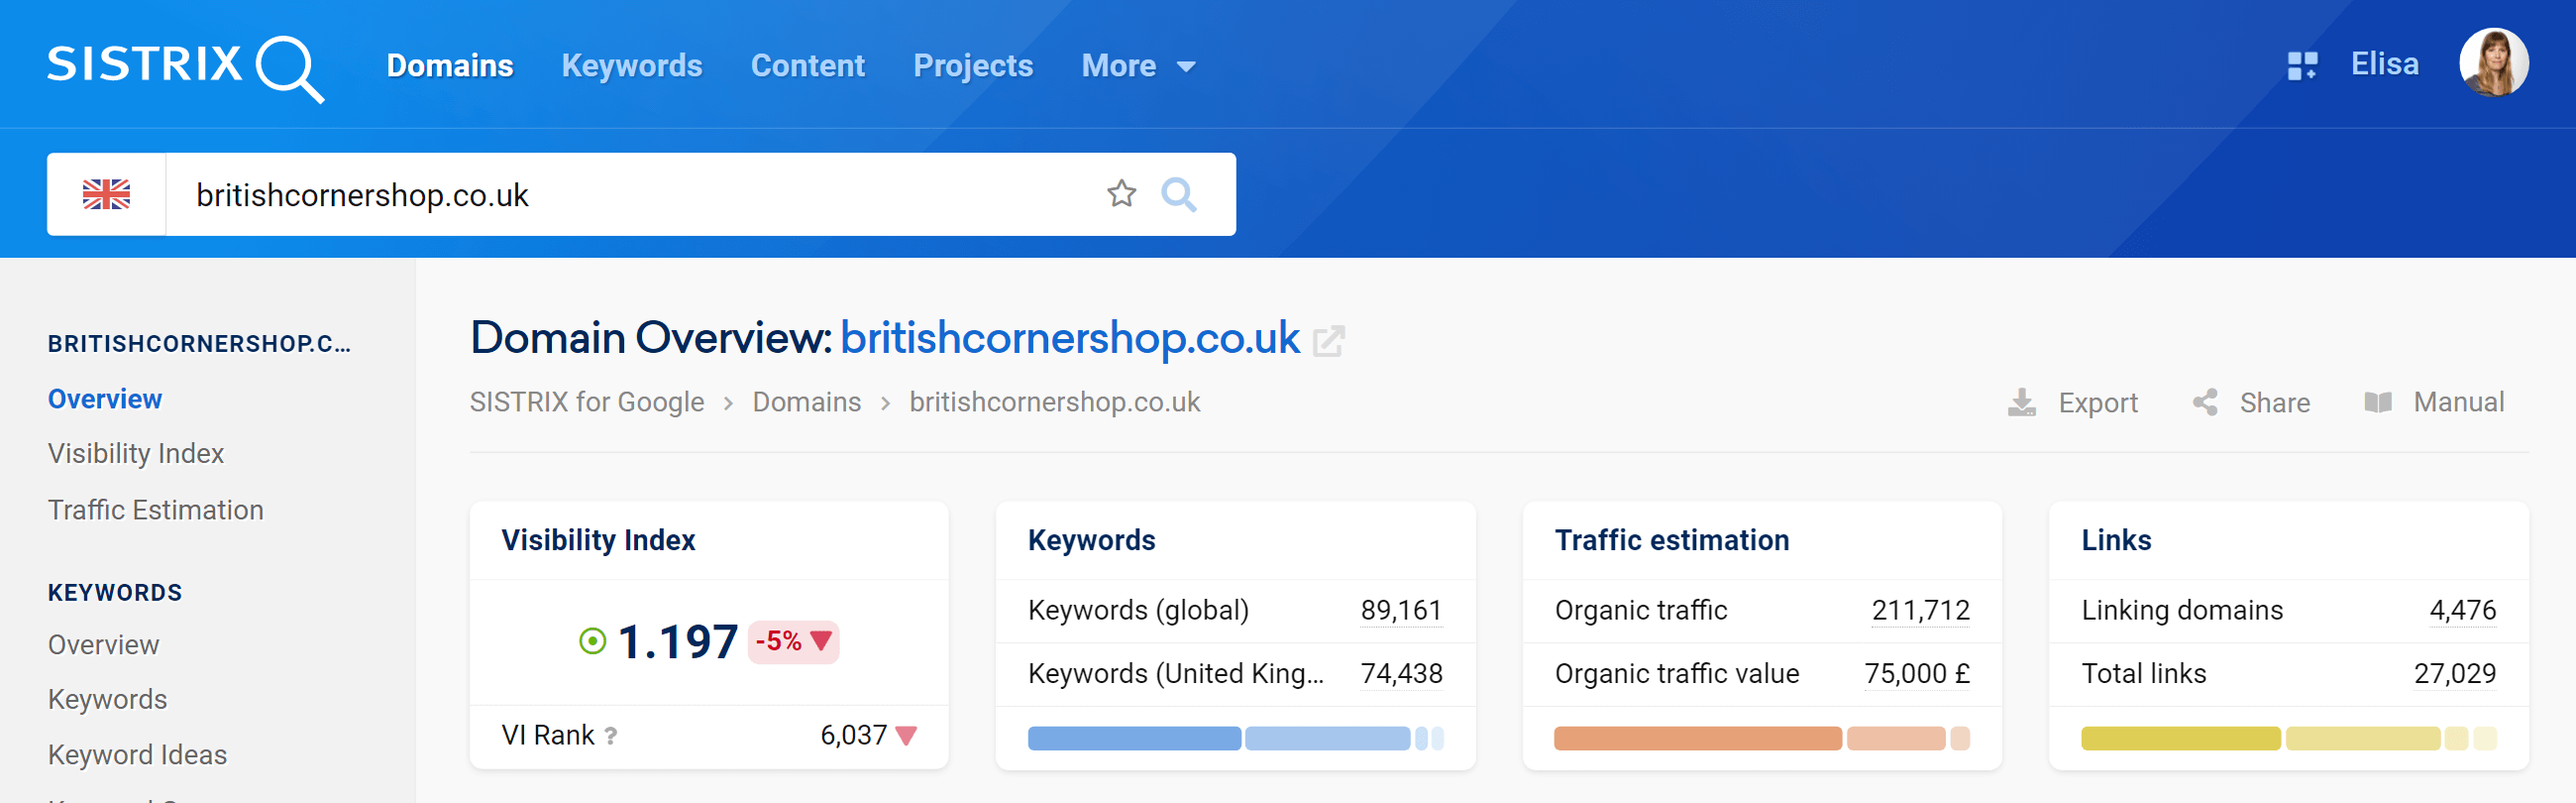
Visibility Index
The VI is the core metric of a domains visibility (or optionally, host, directory or URL) and it’s evaluated from the rankings found within a representative keyword set. Each ranking is weighted by position and search volume and added together to create the final figure. Extensive information on the Visibility Index can be found in this article: SISTRIX Visibility Index – Explanation, Background and Calculation.
The Visibility Index is based on the mobile rankings for the selected country. The percentage change refers to the Monday of the previous week.
The Visibility Index displayed is continuously updated daily. However, SISTRIX continuously monitors the ranking data. If we detect a strong deviation between the daily Visibility Index and the last analysed data, we will display a green pulsating dot. If you move your mouse over the dot, you will see the live Visibility Index and the exact time of the last update.
VI rank: the Visibility Index rank shows you the position of the most successful domains for the examined domain. For this purpose, all domains with a measurable Visibility Index are sorted in descending order every day.
Visibility Index (All countries)
The VI is the core metric of a domains visibility (or optionally, host, directory or URL) and it’s evaluated from the rankings found within a representative keyword set. Each ranking is weighted by position and search volume and added together to create the final figure. Extensive information on the Visibility Index can be found in this article: SISTRIX Visibility Index – Explanation, Background and Calculation.
The Visibility Index is based on mobile rankings in a global cross country comparison and is updated weekly.
Keywords
This box gives you a quick overview of the number and orientation of the rankings of the examined domains (or host, directory, URL). The first line (global) shows how many different rankings can be measured in SISTRIX across all countries.
The second line (default country, as per user settings) then shows you how many keyword rankings were measured in the country. Clicking on the numbers takes you directly to the keyword table with the exact keywords and rankings. Learn more about our SERP database.
The third line tells you the search intent of the keywords. The blue bar shows you right away whether most keywords have a “do”, a “know”, a “website” or a visit intent. If you hover over the bar with your mouse, we will show you more precise numbers.
Traffic estimation
This box shows estimations about the traffic of the domain (or host, directory, URL when doing deeper analysis). The value given for Organic traffic in the first row is our estimate of the average monthly traffic that can be generated by the keywords found. More on traffic estimation.
The second row, Organic traffic value, shows you, based on Google Ads CPC values, how much money you would have to spend to buy this organic traffic in the paid areas of Google search results.
In the third line of the box you can see how the device distribution of the examined domain looks like. What percentage of users come from desktop, mobile or tablet? This data is not available for all domains.
AI Citations
This box shows how frequently the domain appears as a source in the AI search system responses we have tracked, such as Google AI Mode, Google AIO, or ChatGPT.
Links
Here you can see the most important link metrics for the examined domains (or host, directory, URL) at a glance. If link metrics have not yet been determined for a domain, you can trigger this with a click here.
In the first row you can see the number of different referring domains: one of the most important metrics for links. How many different domains link to a website. The second line then shows you the total number of links: how many links refer to the domain.
In the third line you can then analyze what proportion different top-level domains (such as .com) make up in the link profile of the examined domain. Here, too, you can see further details and data if you move the mouse over the line.
Country Overview
For any business working or expanding into international markets, and for sites offering content that spans many countries, monitoring the international visibility of your domains, or those of your competitors, is important.
Here you find an overview of the countries where your domain is more visible. For each Country the tool displays the average monthly click value and the Visibility Index of the domain.
Click on “Other countries” to see the whole list.
Top Paths, Hosts and URLs
Often some specific content formats of a website are better accepted by Google and the users than others. This pie chart shows the most successful directories, hosts and URLs according to the number of organic ranking keywords, and is based on keywords in our extended database using the Mobile-First search results.
To create this chart we consider the number of different ranking keywords per URL, directory and hostname.
- Updated weekly
- Database: Extended, with many millions of keywords.
Visibility Index Graph
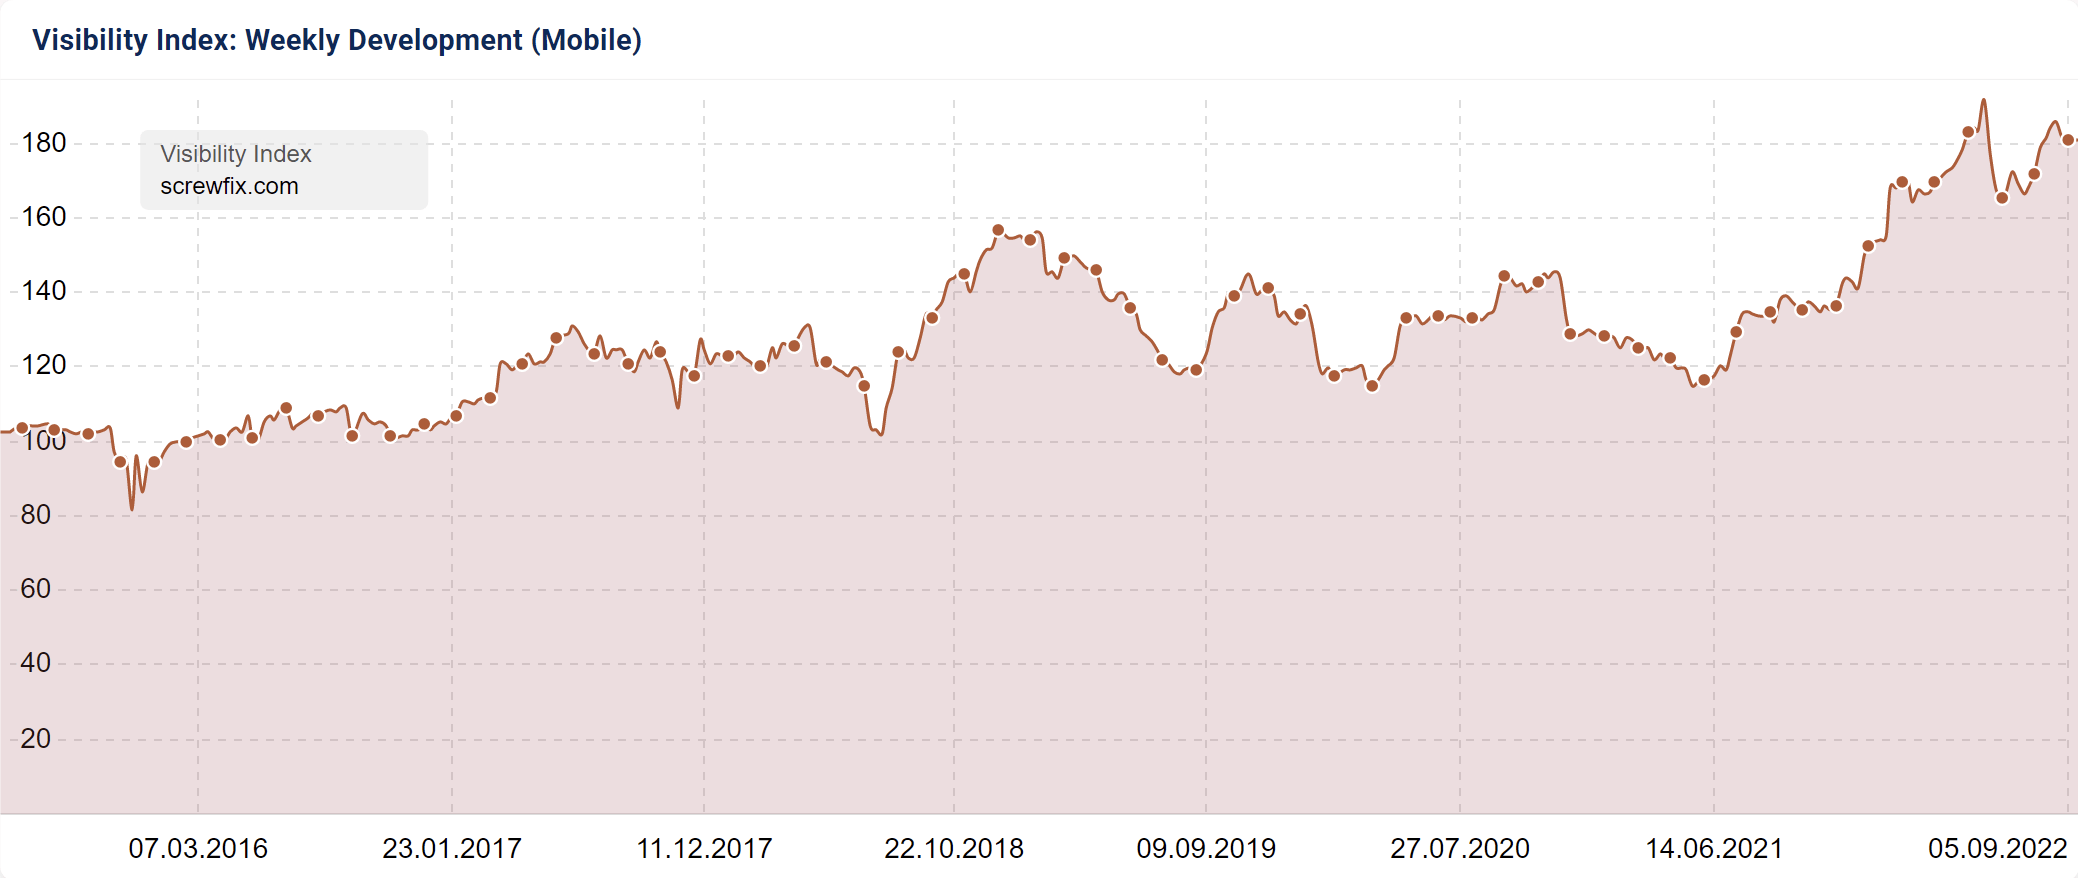
This box shows you the development history for the SISTRIX Visibility Index for the organic rankings for the domain. The development history for the SISTRIX Visibility Index is able to tell you quite a bit about the current health of a domain.
You can zoom into a specific date-range by holding the mouse button down and selecting the range you would like to focus on. By right-clicking on a single visibility-point, you can jump directly to the keywords for that date.
Please also note the numerous options available through the cogwheel in the top right hand corner of this box which allow you to:
- Switch between desktop and mobile data.
- Decide on which event-pins should be shown.
- Compare the history of up to six domains with each other
- Export the data.
- Add this box to a dashboard or a report.
Extensive information on the Visibility Index can be found in this article: SISTRIX Visibility Index – Explanation, Background and Calculation.
Visibility Index Graph (All countries)
This box shows you the development history for the SISTRIX Visibility Index for the organic rankings for the domain. The development history for the SISTRIX Visibility Index is able to tell you quite a bit about the current health of a domain.
You can zoom into a specific date-range by holding the mouse button down and selecting the range you would like to focus on.
Please also note the numerous options available through the cogwheel in the top right hand corner of this box which allow you to:
- Decide on which event-pins should be shown.
- Export the data.
- Add this box to a dashboard or a report.
Extensive information on the Visibility Index can be found in this article: SISTRIX Visibility Index – Explanation, Background and Calculation.
Overlay Data
You can use the feature “Overlay Data” to compare the chart with one or more domains, hostnames, paths or URLs (up to six in total).
Add the domains (hostnames, paths or URLs) in the search slot and click on “Show details” to select the Country and the device (mobile or desktop) for the visibility data. By default, the tool will use the mobile database and the Country chosen in the search bar.
Finally, click on the green button “Compare” to begin your analysis.
Competitor Positioning
The different colored dots in this box represent domains that we have identified as competitors for the domain.
- The further to the right a point is, the higher the visibility index of the domain.
- The higher up, the higher the number of keywords for which this domain ranks.
- The size of the dots indicates how much monthly traffic this domain generates according to our estimates.
Competitors
Based on the keywords ranking in the Top-100 from our Ranking-Keyword-Set for the domain under evaluation, we show you other domains which also have rankings for this keyword-set. These domains are the strongest keyword-competitors for the domain you are evaluating.
Meaning of the values in each column:
- Competition: This value shows the percentage-based visibility for the keyword-competitors, based on the ranking-keyword-set. If you are evaluating domain A and domain B has 200% in this column, then domain B is about twice as visible for the keywords that domain A ranks for in the Top-100.
- Visibility Index: In this column we show you the Visibility Index score for each domain, using only the keywords in the ranking-keyword-set.
Click on “Show all” to open the whole competitors list.
Rankings
This table gives you an overview of rankings which are especially interesting for a domain. This is done by choosing keywords from this domain’s rankings which are well positioned and show a large search-traffic and strong competition.
- Keyword: The query exactly as it is written in Google.
- Ranking / Position: Best position of the domain URL for the keyword inside the organic SERPs.
- Clicks: Estimated number of organic clicks per month for the keyword. Read more about clicks here.
- Search Volume: number of monthly search queries for this keyword on Google for the chosen country (learn more).
- Competition: this indicator shows the level of competition for the keyword in the organic Google Index: 0 (low) until 100 (extremely high) (learn more).
You can browse all the domain’s keywords by going to the menu-item “Keywords”, in the left navigation under SEO or by clicking on the “Show all Keywords with a Top-100 Ranking” link at the bottom of this box.
- Updated weekly
- Database: Extended database, with many millions of keywords.
The table is sorted in descending order by the number of clicks.