
The ranking distribution shows you how the Top100 rankings for the evaluated domain (respective the host, directory or URL for detailed-evaluations) are distributed within Google’s results-pages. The data can be quickly sorted and exported if needed.
General options
At the top right corner of the page you’ll find general settings for the whole page, in particular:
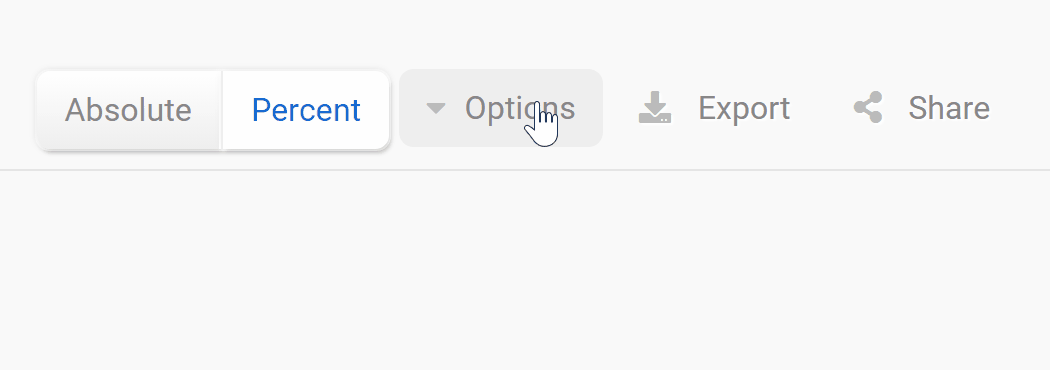
- Absolute/ Percent: Choose if you want to see the values in percentages or in absolute values.
- Options: The Toolbox provides the most comprehensive data for mobile SERPs, so mobile data are set as default. Here you can switch to the desktop data.
- Export: Export the (filtered) table and all of its columns and data as a CSV file. To do this you’ll need to use some credits.
- Shortlink : Share the page with people who don’t have a SISTRIX account. We’ll generate an individual shortlink valid for a few days and that you can share without any limitations.
Ranking Distribution
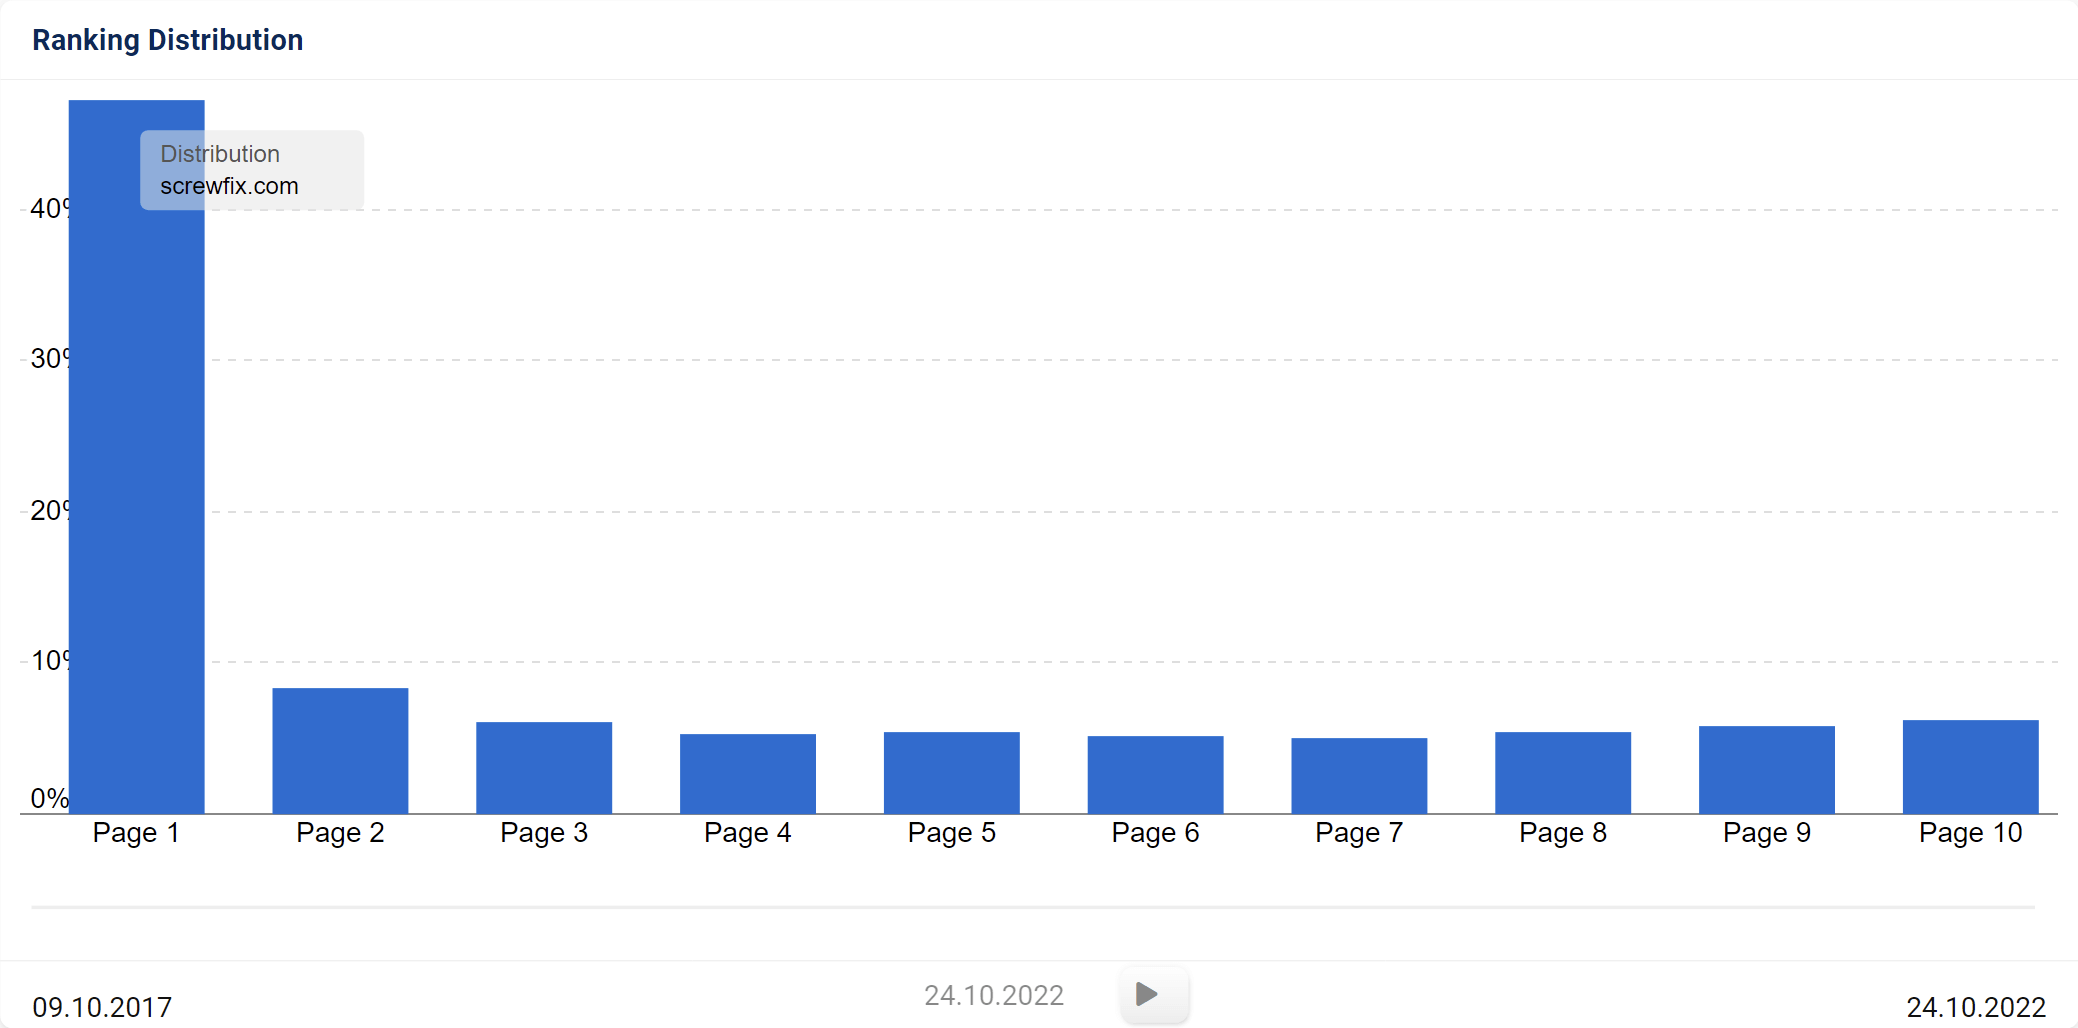
The column chart right under the option menu shows you how many keywords of the analysed domain are ranking on the first ten results pages on Google. Page 1 represents ranking positions 1 to 10, page 2 are positions 11 to 20 and so on until page 10, which shows the organic positions 91 until 100. Hover the mouse over the columns to see the keyword percentage (or number) for each page.
You can also use the slider below the Graph to browse the results for different weeks. By clicking on the play-button, we will play though the history, beginning at the point the slider is at that moment.
- Updates: Weekly
- Data-set: Visibility data: 1 million keywords for desktop or mobile
Ranking Distribution – History
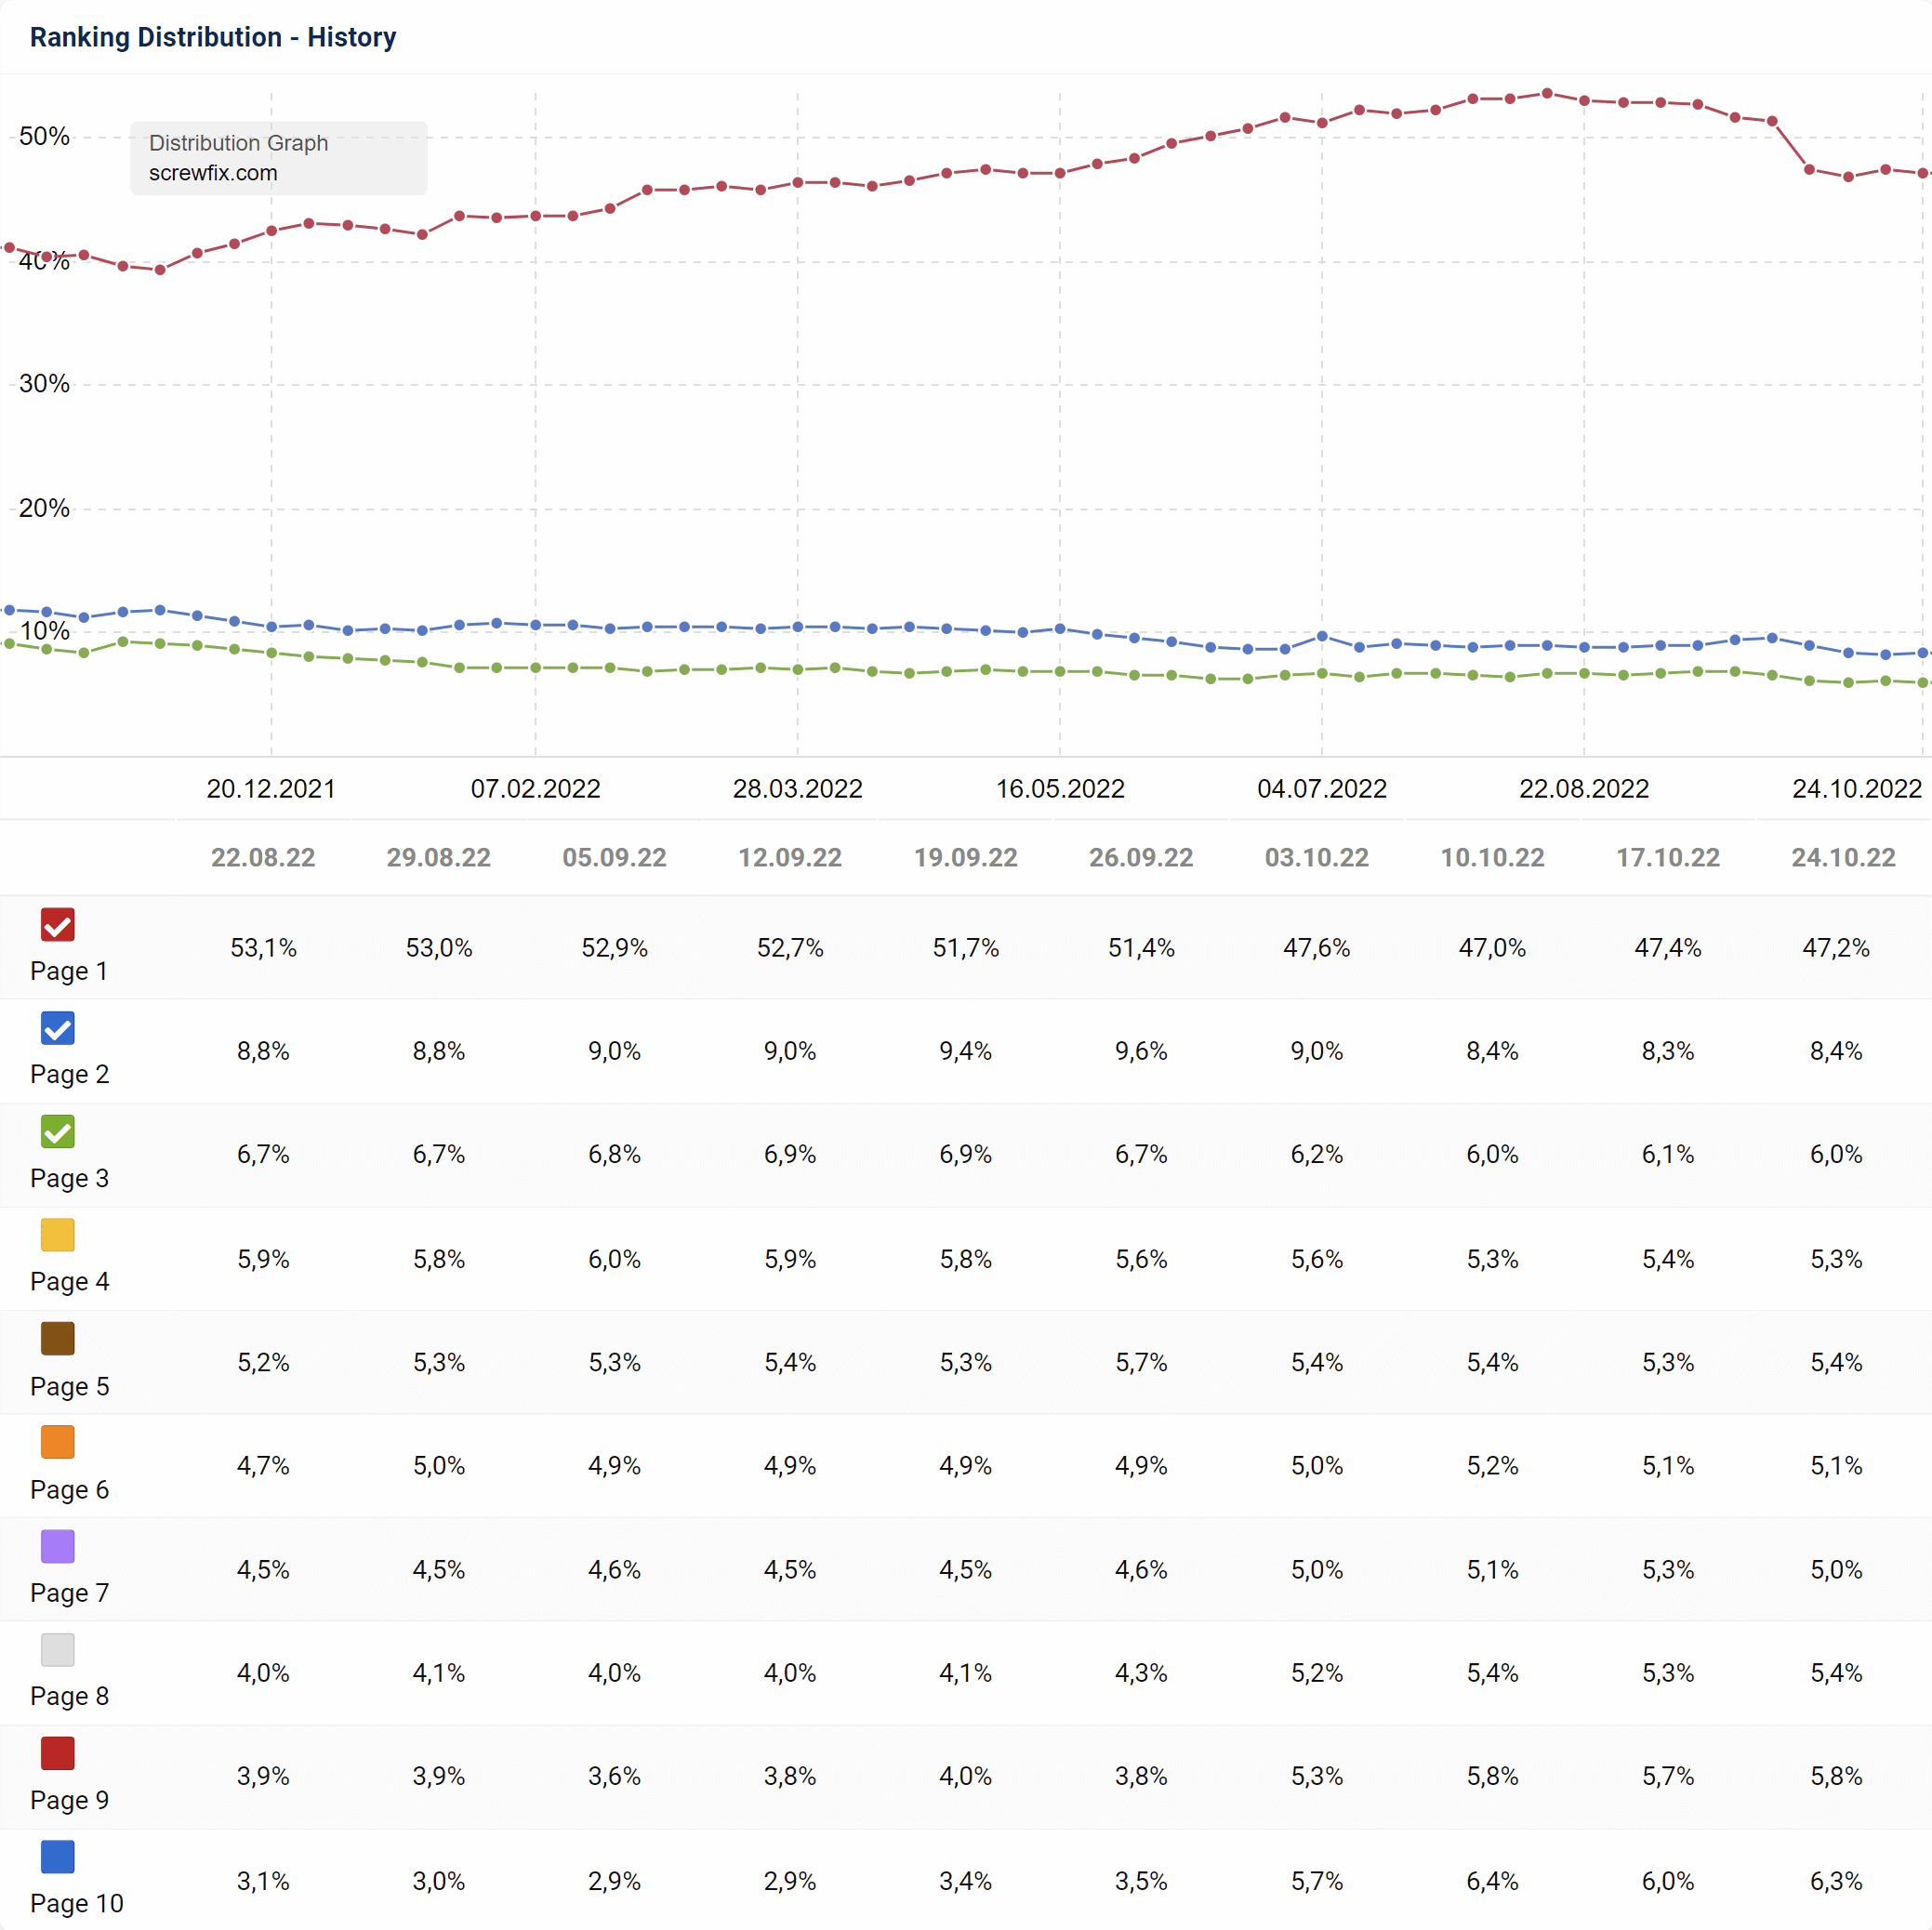
In this graph you can see the ranking-development throughout the historic data, available for this domain (respective the host, directory or URL for detailed-evaluations), with the amount of rankings for each page shown.
You can activate and deactivate each line by checking the colour-box to the left of each row in the table below the graph. By hovering the mouse on the graph, the Toolbox will show you the percentage (or absolute) values for the domain on that specific week.
Note that the cogwheel icon will give you more options for your analysis.
- Updates: Weekly
- Data-set: Visibility data: 1 million keywords for desktop or mobile