
SISTRIX Toolbox dashboards can save you time, improve your workflow, and reduce the possibility that you miss an important event. By monitoring your customer or competitor, single domain monitoring can also alert you to threats and opportunities.
How to create a Dashboard
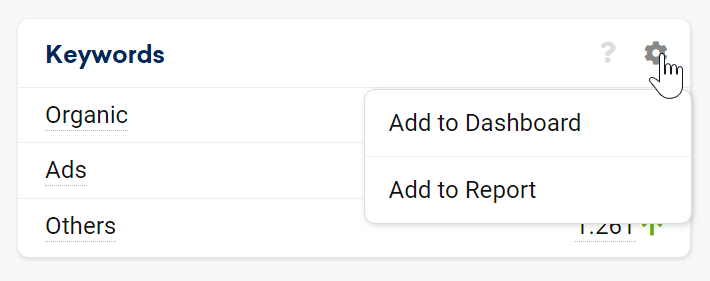
Dashboards are created by adding an element to a new dashboard. For example, by adding the Domain Overview box. Use the cogwheel on the top-right of sections in the Toolbox to add them to a dashboard and select “Create New Dashboard”.
Use this method to add all the elements you want into one or different dashboards.
Dashboard Overview
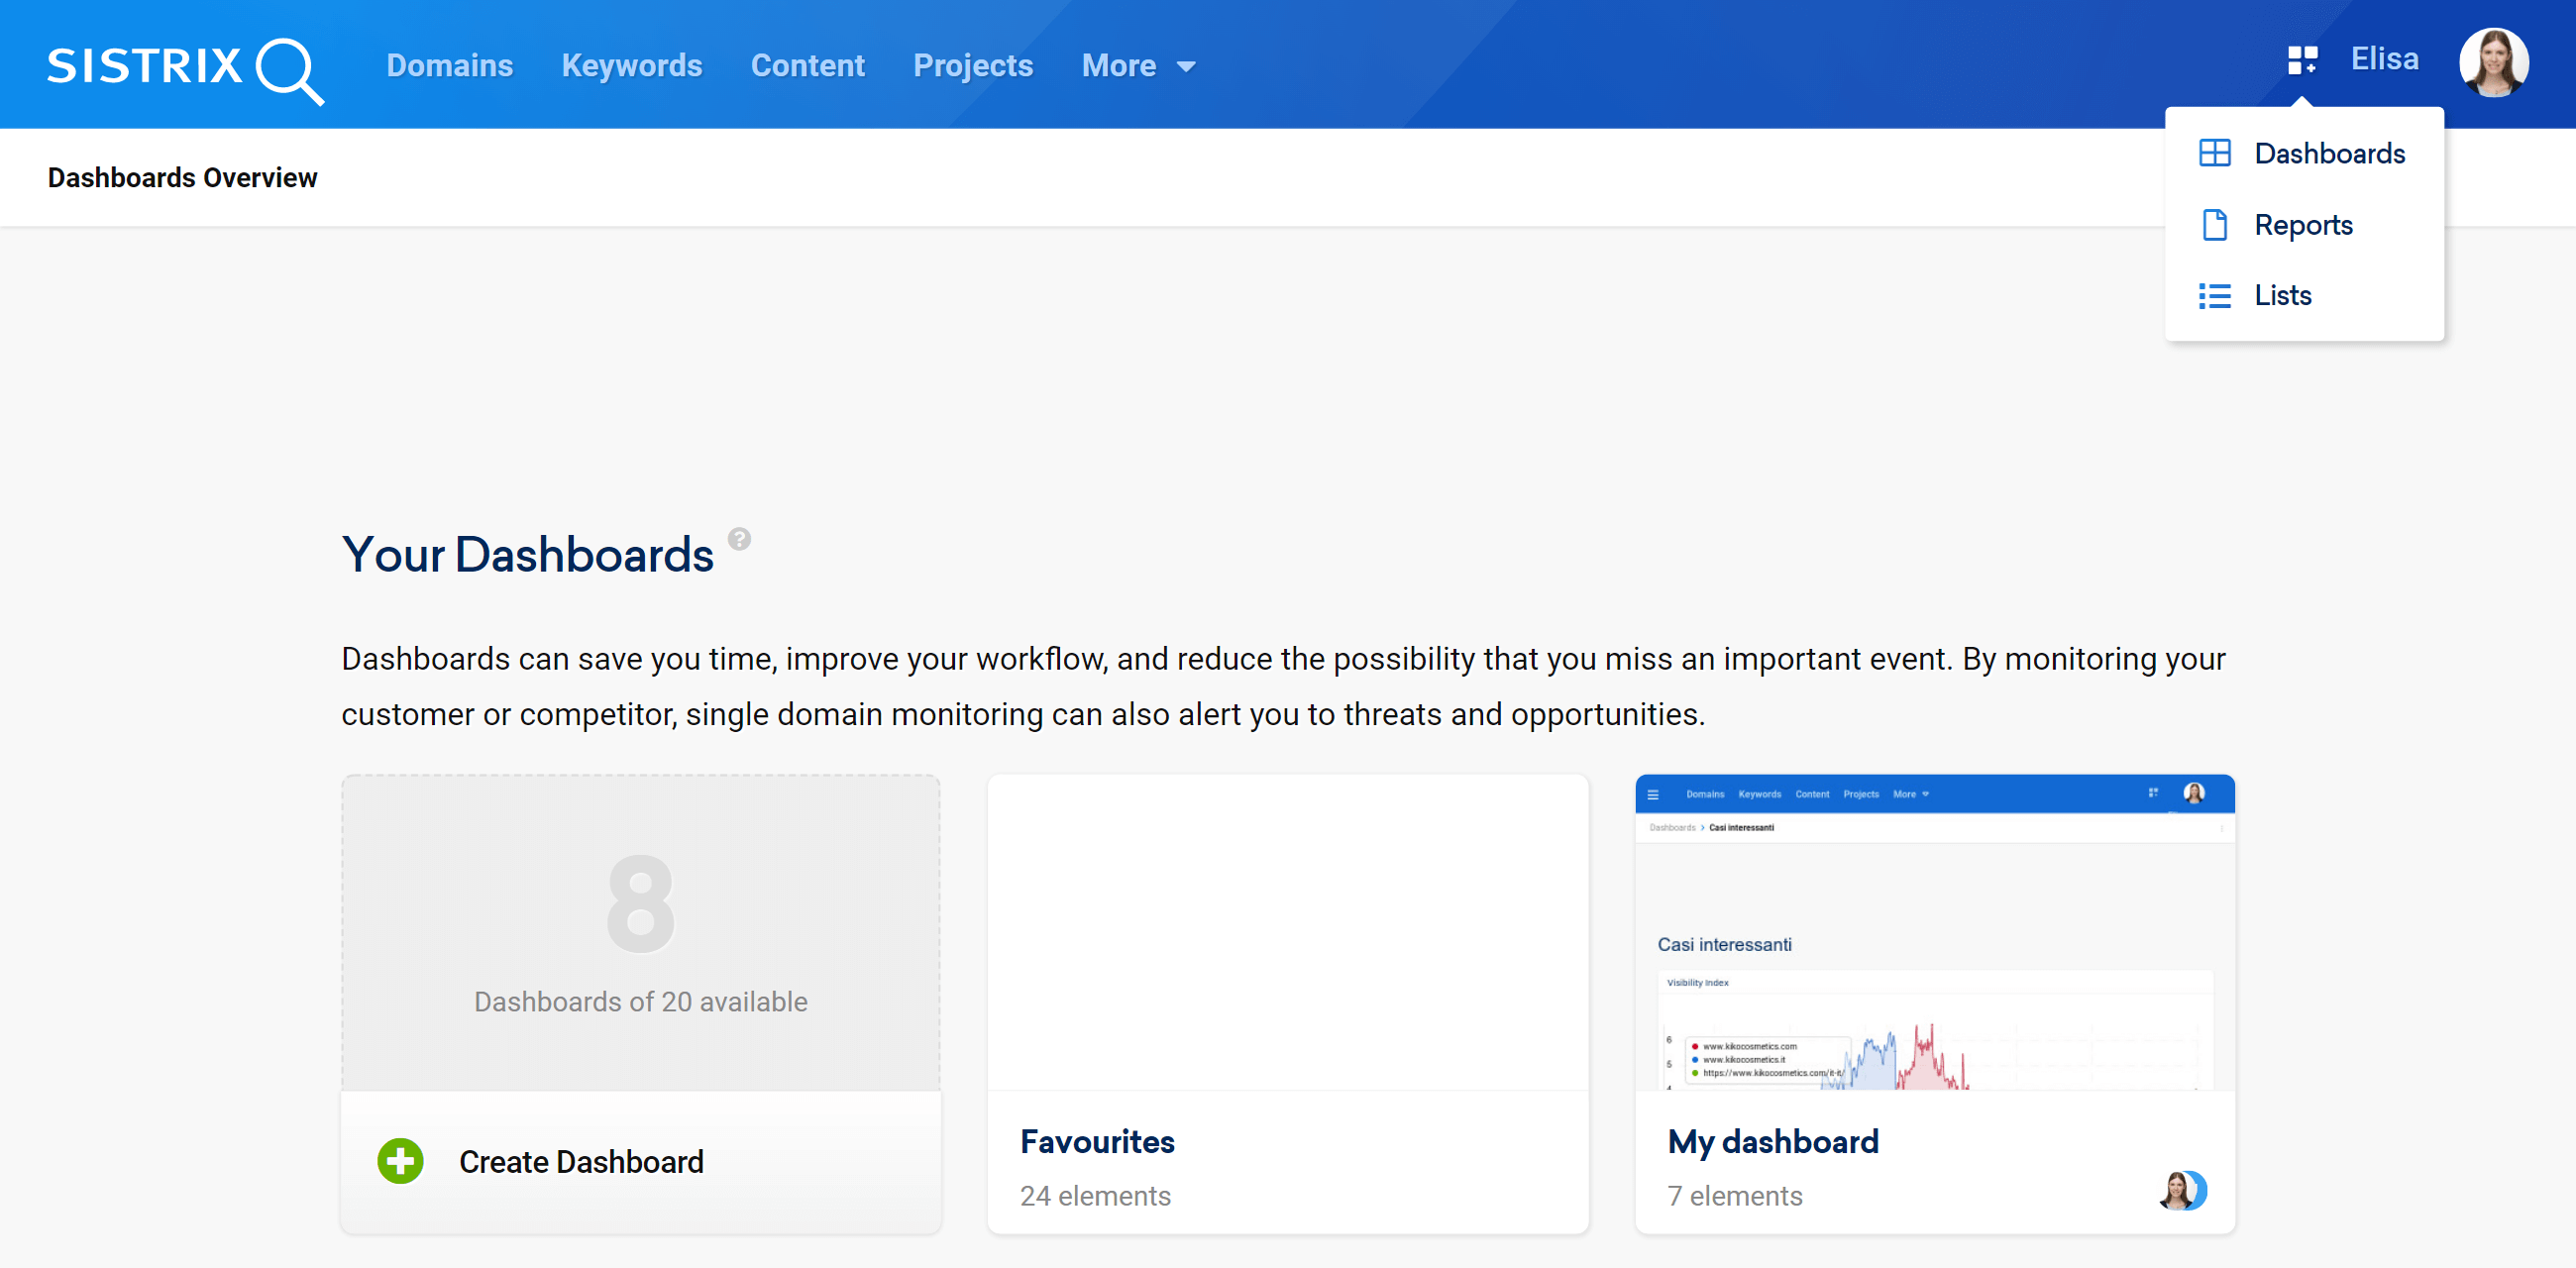
To see all your dashboards hover the mouse on the icon near your picture profile, on the top right corner of the screen.
There you’ll be able to open the dashboards you previously created and see how many you have left.
You can view the overview as tiles or as a table.
The tile overview shows you the name and the number of elements of each dashboard.
The table shows you the name, the creator and the creation date of the dashboards instead.
Click on “Filter now” to filter the dashboards that you have already created. You can also open one of your dashboards to edit it or delete it.
Dashboard Setup
General Options
In the white bar, located between the Toolbox navigation menu and the dashboard elements, you’ll find general settings for the whole page, in particular:
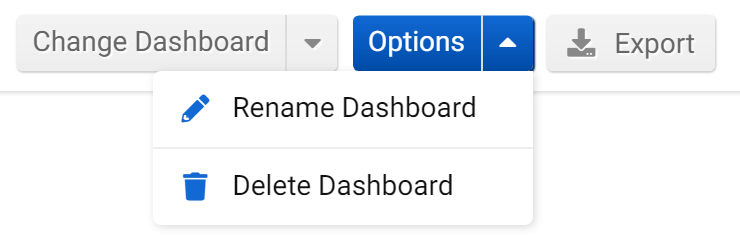
- Change Dashboard: click on the arrow to select a different dashboard you created.
- Options: in the option menu you’ll be able to rename or delete the dashboard you’re in.
- Export: export the dashboard. Read more about exports and credits here.
Editing a Dashboard
Every element in a dashboard will be updated exactly as it were in the Toolbox. To change the order of the elements, just drag and drop them within the dashboard.
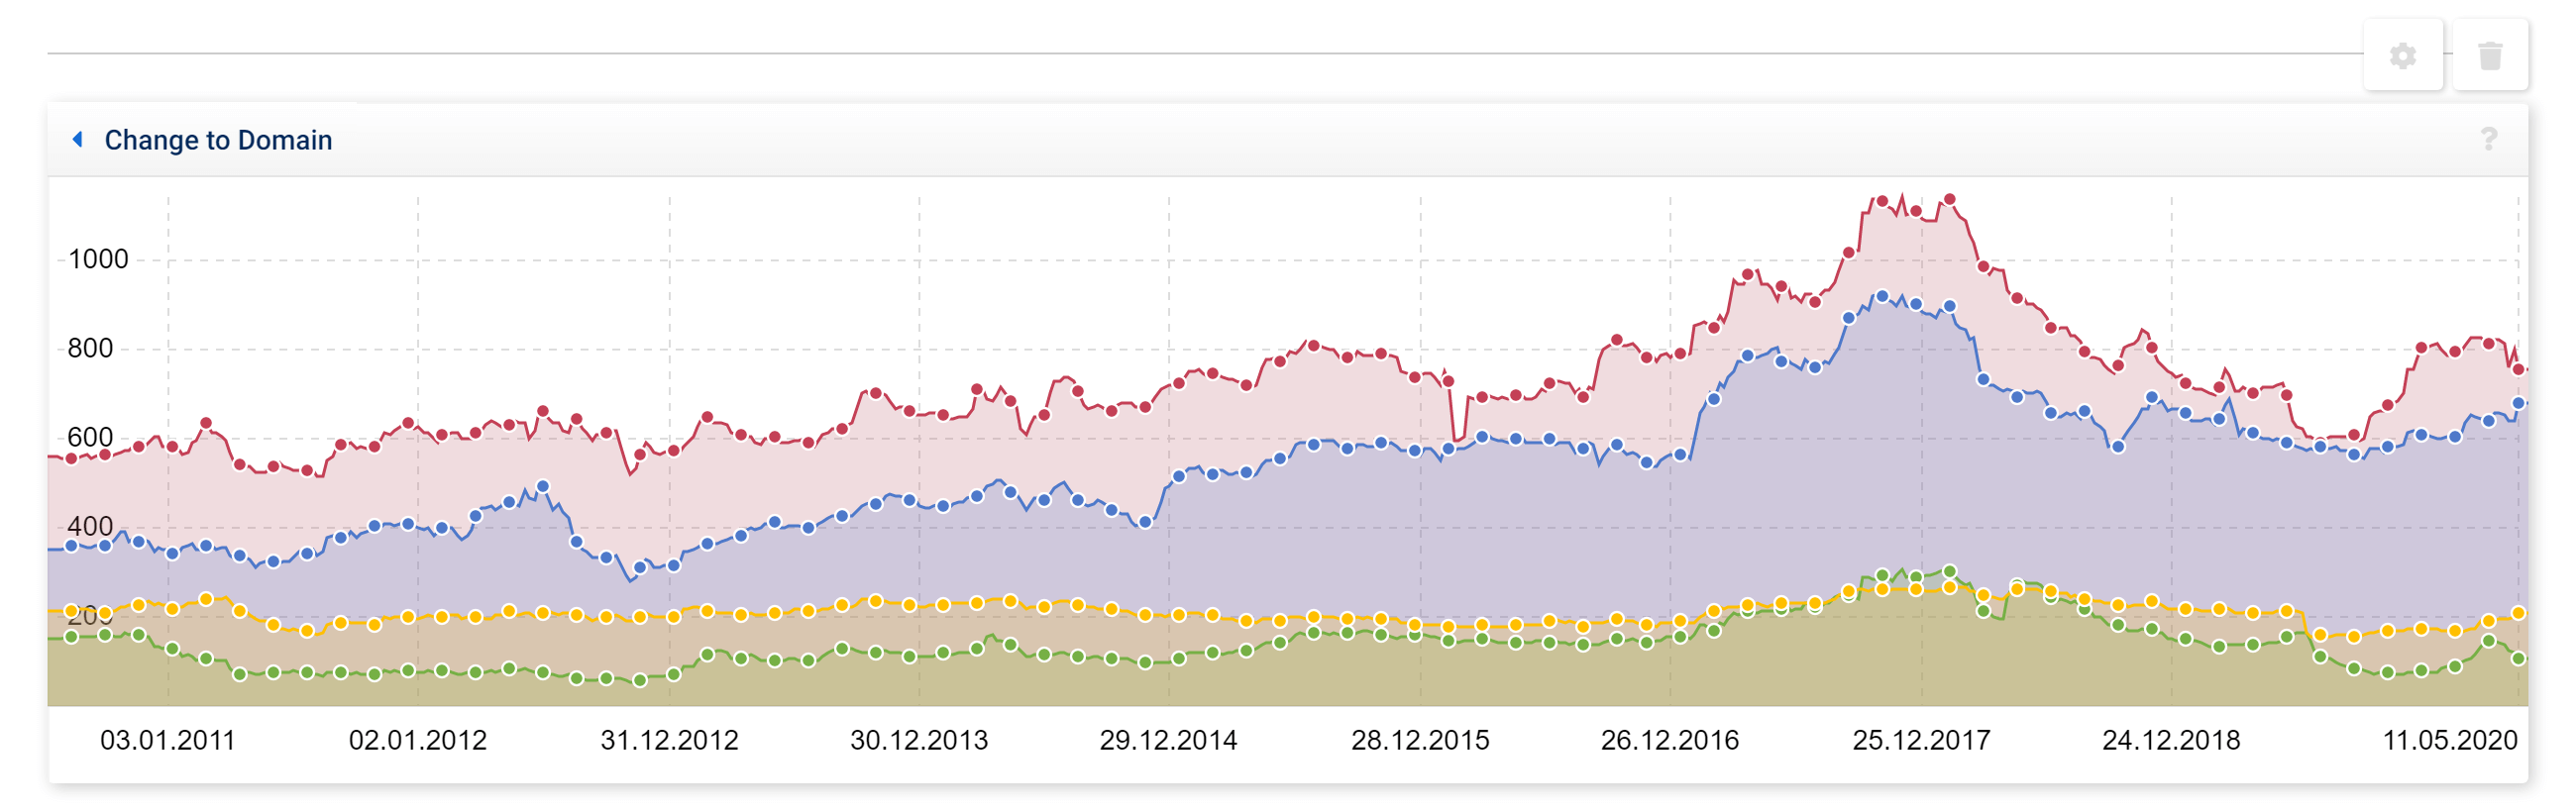
If you want to deepen your analysis, you can click on the button “Change to domain” to go directly to the corresponding domain 1 . The two buttons on the right allow you to set up the options of that specific element (for example, rename it or change its time range) or delete it 2 . The buttons appear when you hover the mouse over the box.
Favorites

If you added domains or Onpage projects to your favorites, they will be automatically shown in a special Dashboard called “Favorites“.
To add a domain (or a subdomain, directory, URL or Onpage project) to your favorites, just click on the little star next to it.
This dashboard automatically collects all your favorites and displays their most important values in a simple and schematic way, to give you a quick overview of their parameters.
Click on the grey box “Frequently used functions” right next to the favorite’s name to open a menu at the right of the screen. There you can find shortcuts to the most popular SISTRIX features, like gained or lost rankings or links. By selecting one of them, you’ll land on the corresponding table, which will be already filtered for you.
Here’s an overview of the different boxes of the favorite dashboard.
Visibility Index
The first box at the top left shows you the daily Visibility Index value. You can move the mouse cursor over the value and we will show you the change in percent.
The referring country and device are indicated just below the value, where you can also see an overview of the Visibility Index graph for the website.
Visibility & Links
Here you can see the Visibility Index value from last year and for desktop devices. You can move the mouse cursor over these values and we will show you the change in percent.
Below that, you can see the total number of referring domains and of backlinks.
Keywords
Here you’ll find the total number of keywords for which this domain is ranking in the search results and the amount of Top-10 keywords. In addition we show you the number of URLs ranking in the Top-100 Google search results. You can move the mouse cursor over these values and we will show you the change in percent.
Top Paths
This box shows the most successful directories according to the number of organic ranking keywords, and is based on keywords in our extended database using the Mobile-First search results. Move the mouse over the bars to see the total number of Top-100 keywords.
Crawling Information
In this box we show you the most important information relating to your Onpage project. In particular, we show you when it was crawled last and the total number of errors, warning and notices. This information allows you to easily keep track of the Onpage project status.
Project Visibility Index
If you have added your own keyword set to your Onpage project, here we show you the Visibility Index based on that set. If you added one or more competitors to your project, their Visibility Index value will be listed right below.
Rankings
In this box you can see some interesting ranking information about your project’s keyword set: the total number of Top-10 rankings, the rankings won, lost and changed.
Lighthouse Performance
Here you find the metric Lighthouse Performance Score of the analysed page. This value is taken directly from Google Lighthouse and it is updated daily. Moreover, we show you the values of the three Core Web Vitals: Largest Contentful Paint, First Input Delay and Cumulative Layout Shift. Read this post to know more about the Core Web Vitals.