
With the SISTRIX Toolbox you’ll be able to easily create and personalise reports and email them to anyone you decide. This will simplify your everyday SEO workflow and save time.
How to Create a Report
To add elements from the SISTRIX Toolbox to a report, you can start by typing a domain into the search bar to reach the overview page.
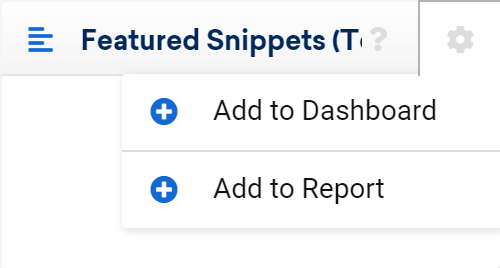
Nearly every element in the Toolbox can be added to a report by clicking on the cogwheel icon in the upper right corner of the box you wish to add. Then just click on “Add to report“.
You can choose to put each element into a report you already generated or you can create a new one, which will be automatically called “My report”.
Report Overview
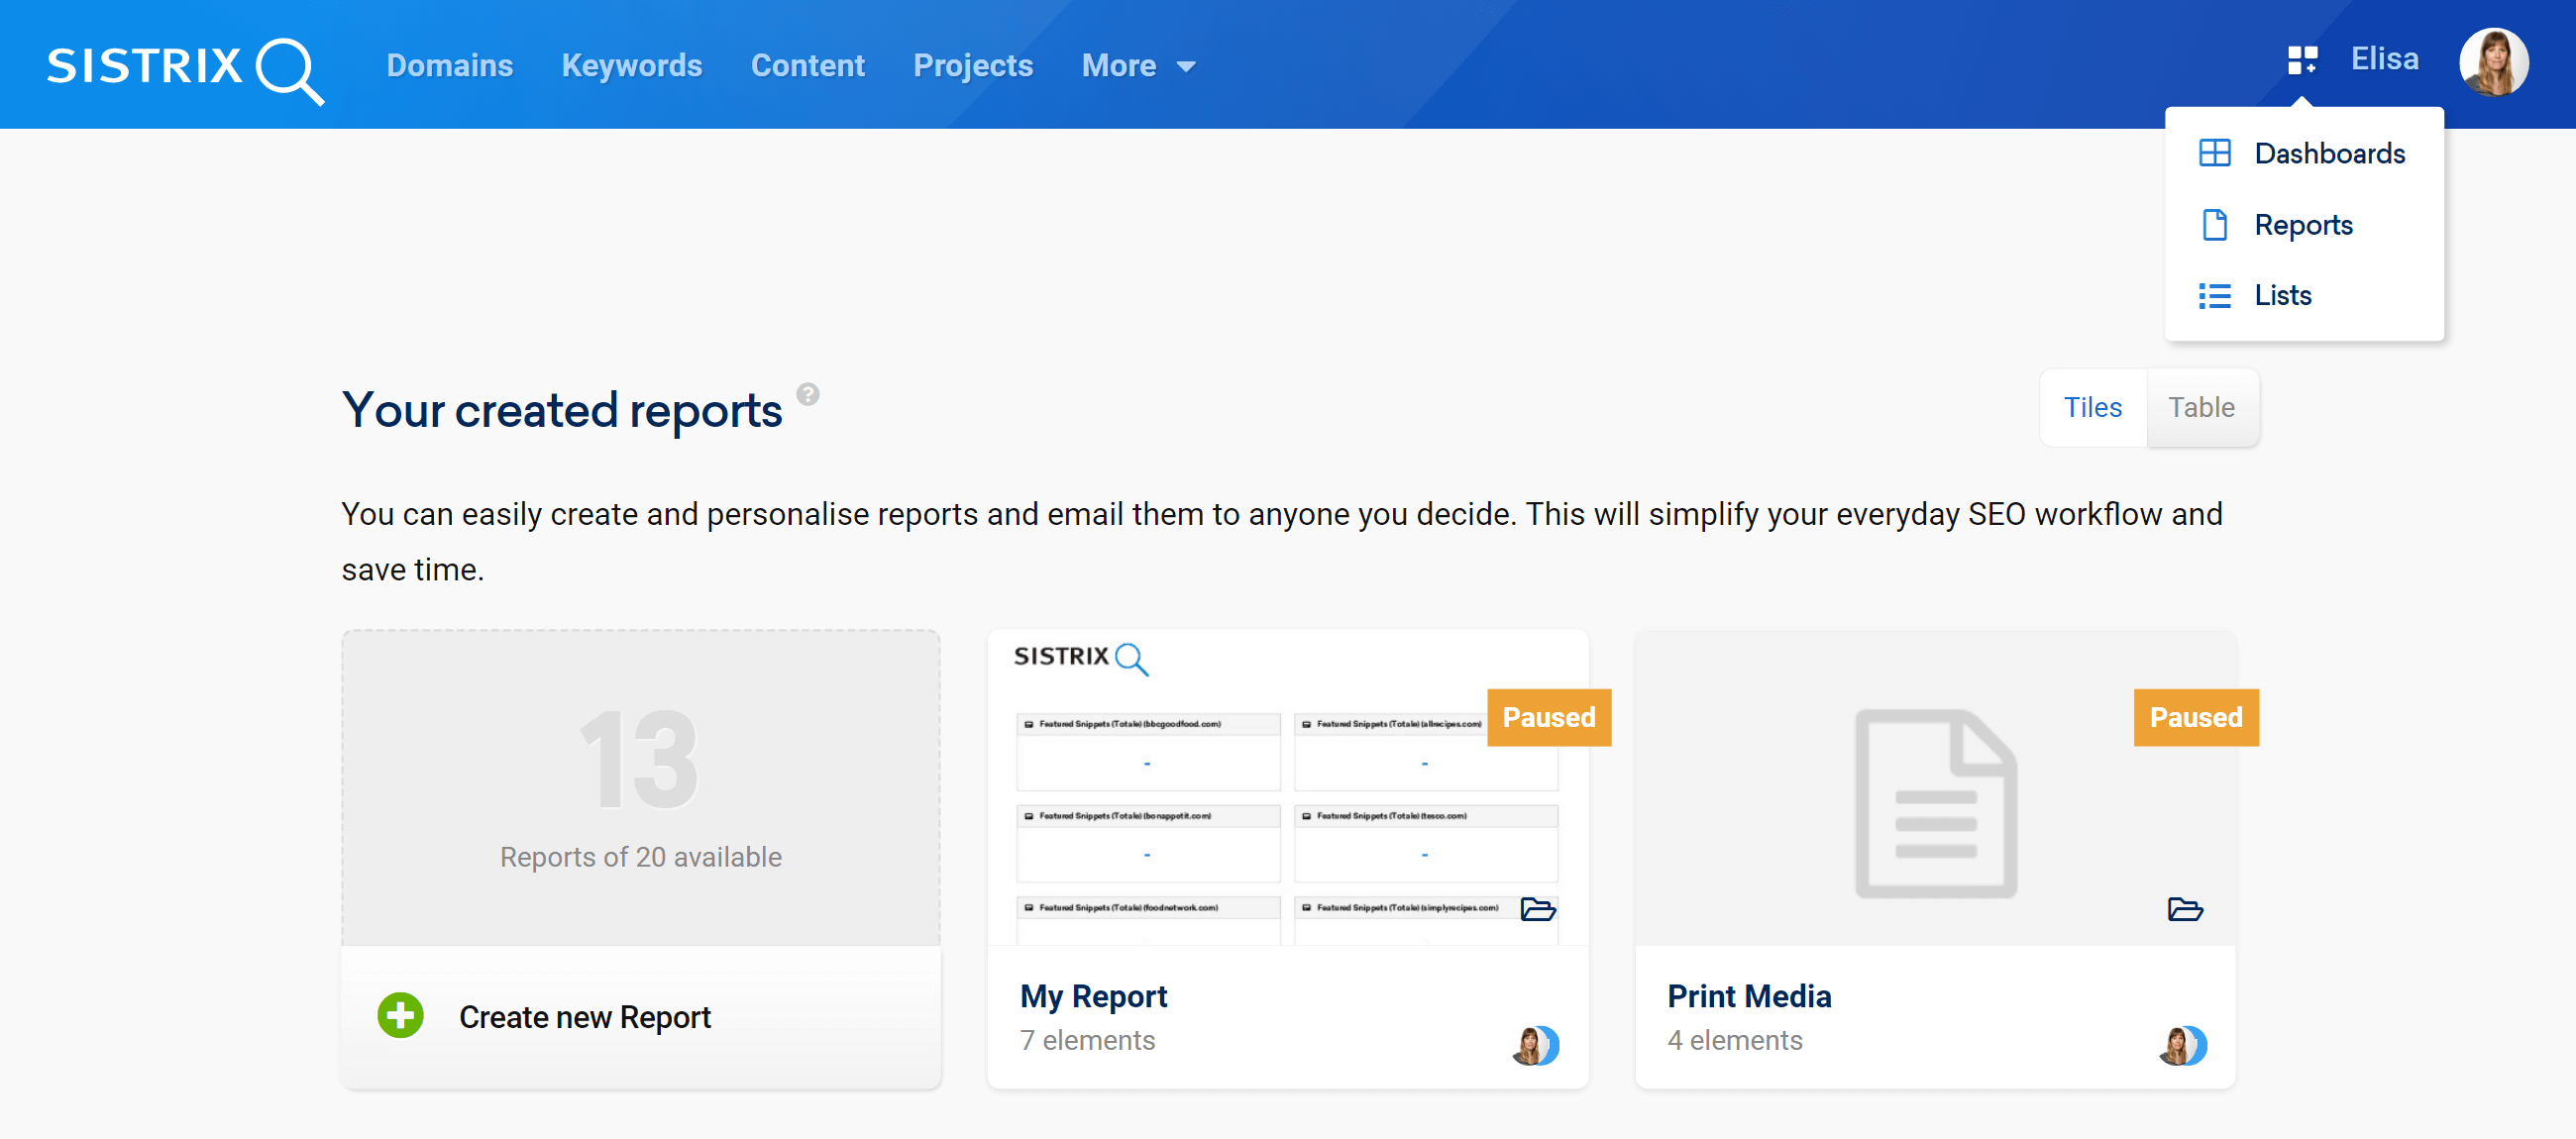
To see all your reports hover the mouse on the icon near your picture profile, on the top right corner of the screen.
There you’ll be able to open the reports you previously created and see how many you have left.
You can view the overview as tiles or as a table.
The tile overview shows you the name and the number of elements of each report.
The table shows you the name, the creator and the creation date of the report instead.
Click on on “Filter now” to filter the reports that you have already created. You can also open one of your reports to edit it or delete it.
Below your reports you’ll also find the report templates and the design templates that can be used to personalise your reports. To know more about this topic read the following article: “How to create and configure Reports in the SISTRIX Toolbox“.
Report Setup
Editing a Report
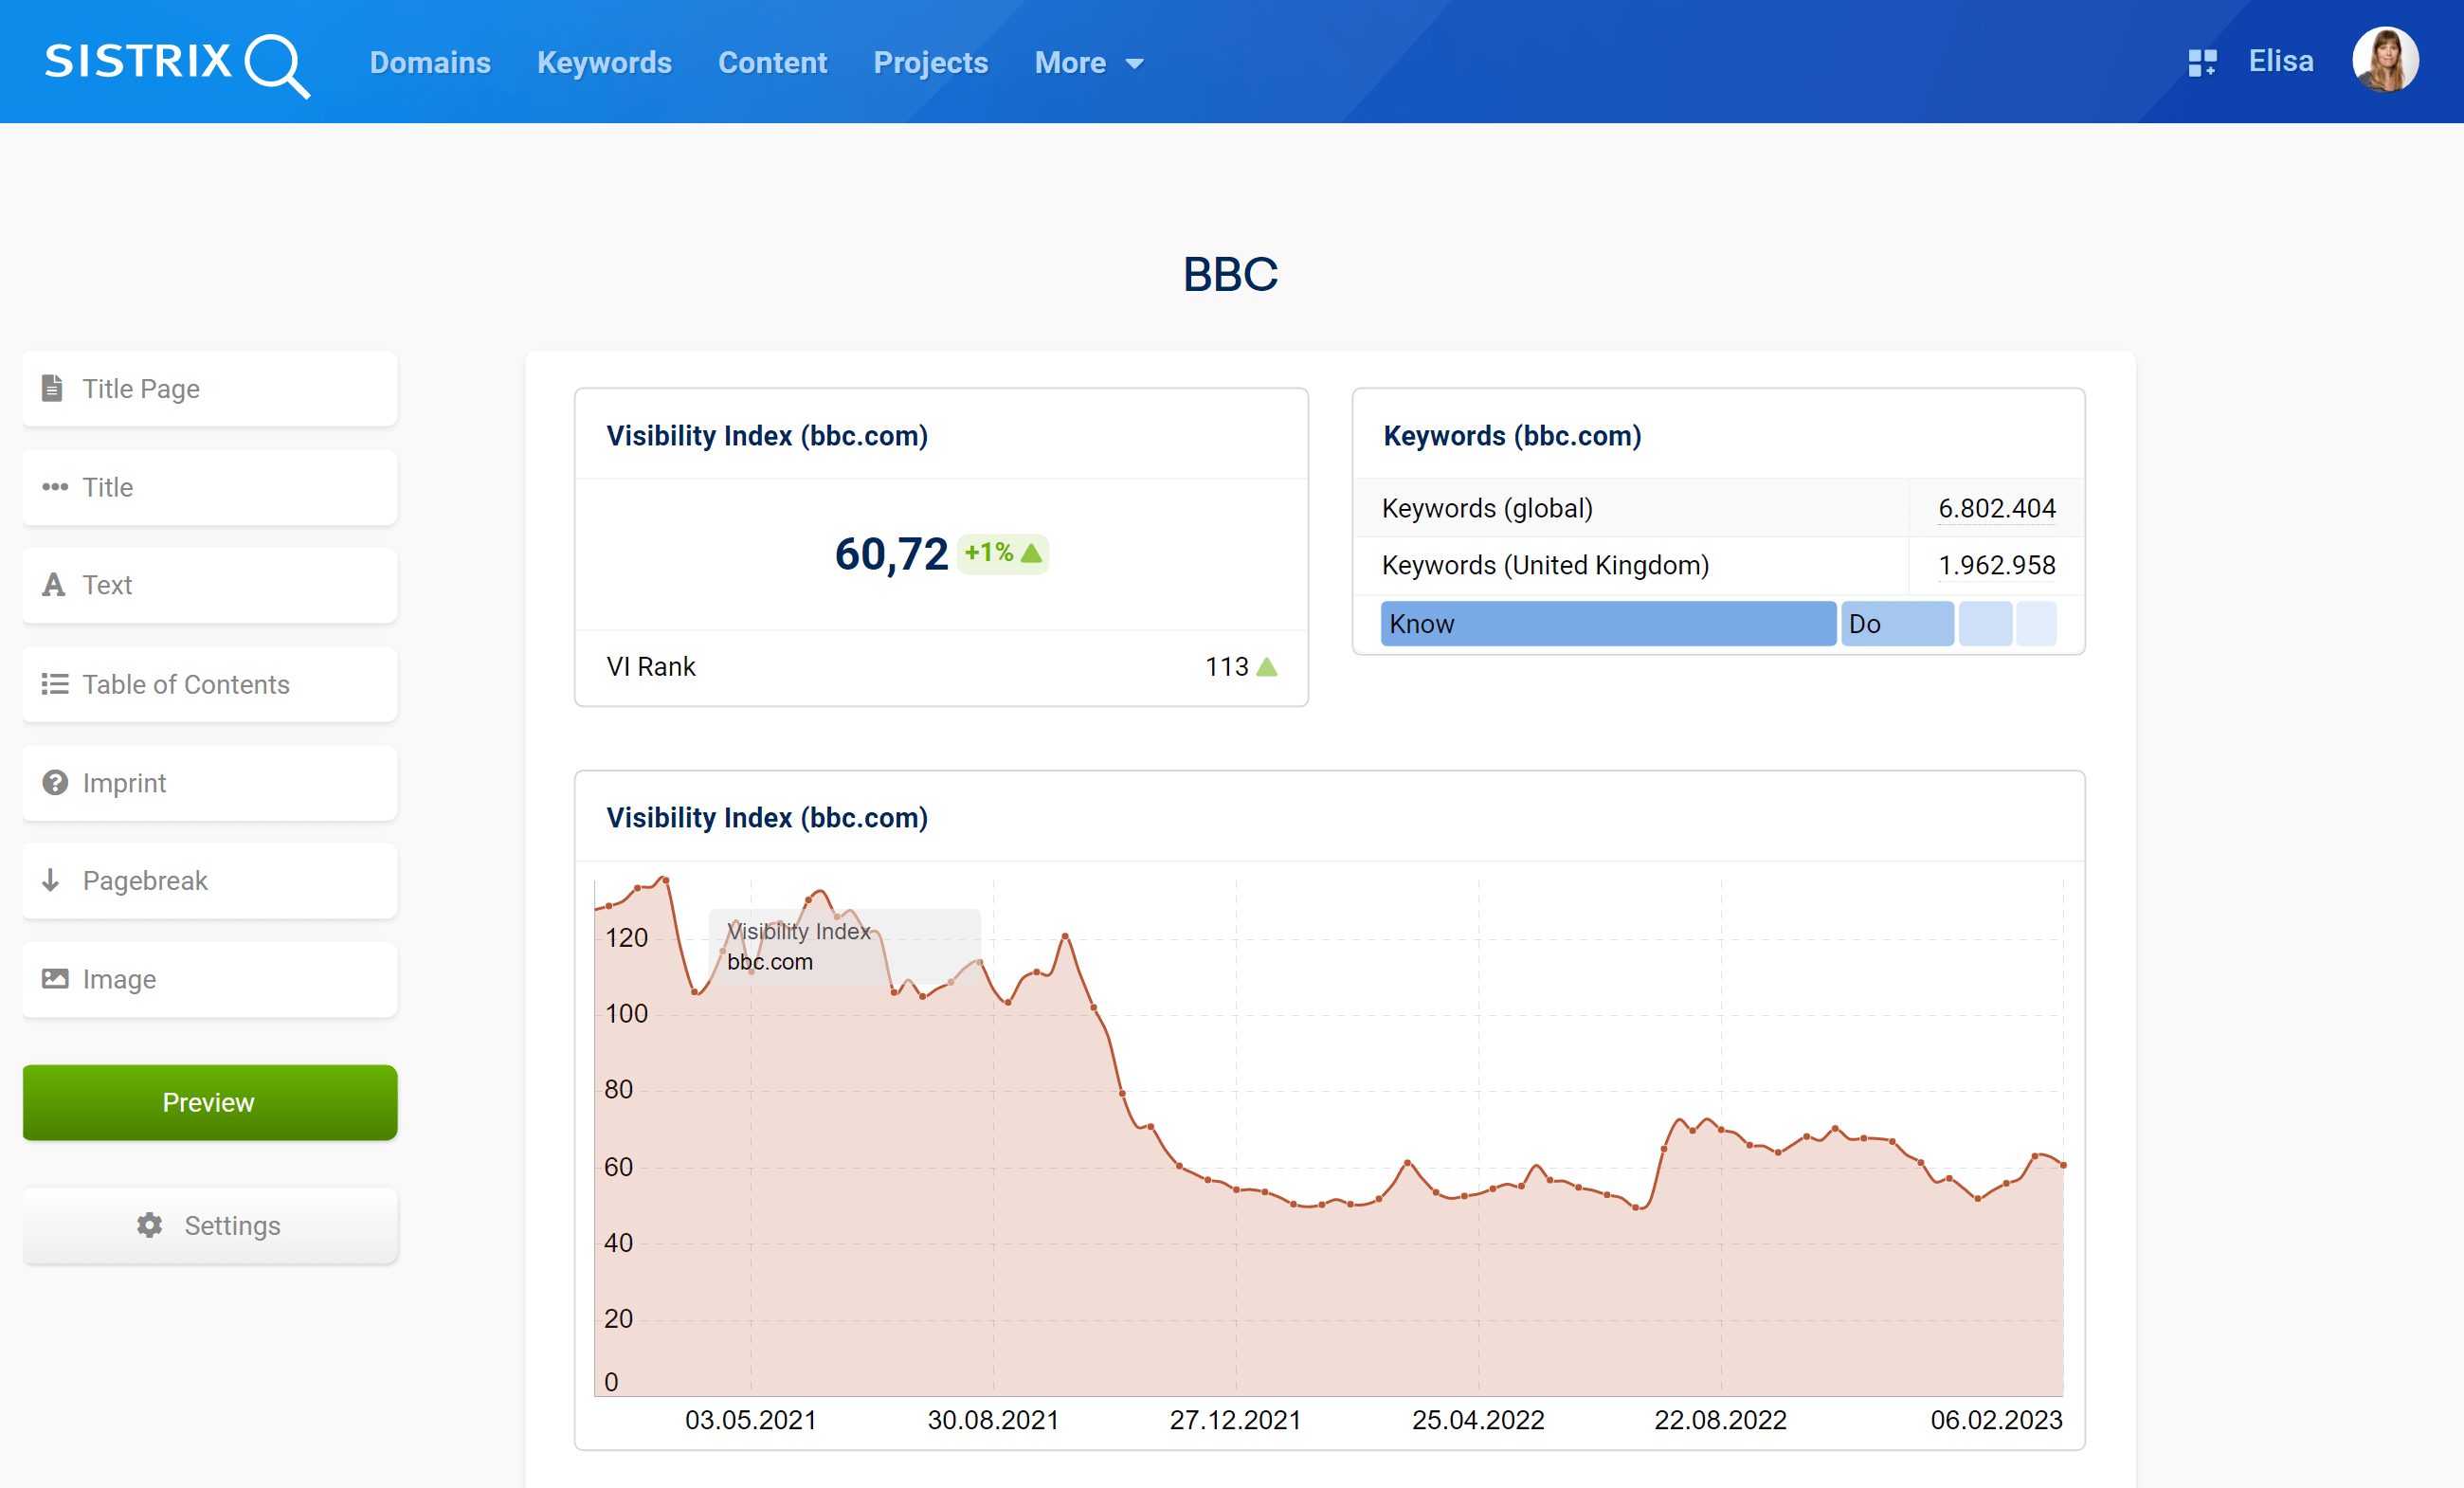
The interface will show you all the elements you added in the order you added them. You can simply move them around by clicking on the arrows at the top left corner of each box, or draging the box to where you want with your mouse. You can also modify the options of every box by clicking on the yellow pencil, or delete it.
Changing the title is also very easy: just click on it and type the name you prefer. Moreover, thanks to the menu on the left, you will be able to personalize your report even further.
- Title Page: adds a title page to the report which uses the title you specified and the current date.
- Title: adds a headline to the report, which will also show up in the table of content.
- Text: adds a text field.
- Table of Contents: creates a table of content automatically from the boxes of the report as well as title fields.
- Imprint: adds an imprint to the end of the report.
- Pagebreak: adds a line break to the current page and starts a new one.
- Image: add an image to the report.
- Preview: saves the report as a PDF file with the current data.
- Settings: overall settings for the report.
Note that “Settings” offers you more options for your report. For example, you’ll be able to send it as PDFs to email addresses you choose.
Archive
At the top right corner of the page you’ll find a button called “Archive“.
The online archive for reports keeps all reports that are sent through our system. That way, you no longer have to save the reports yourself.
In addition, you can access the archive at any time and look at reports from the past whenever you need them.
How often a report is saved to the archive depends on the settings for every report. You can send the reports daily, weekly or even monthly.