
The overview page called “Domains” offers you useful tools and features to get updated on current SEO movements, as well as giving you a quick overview of your favourites.
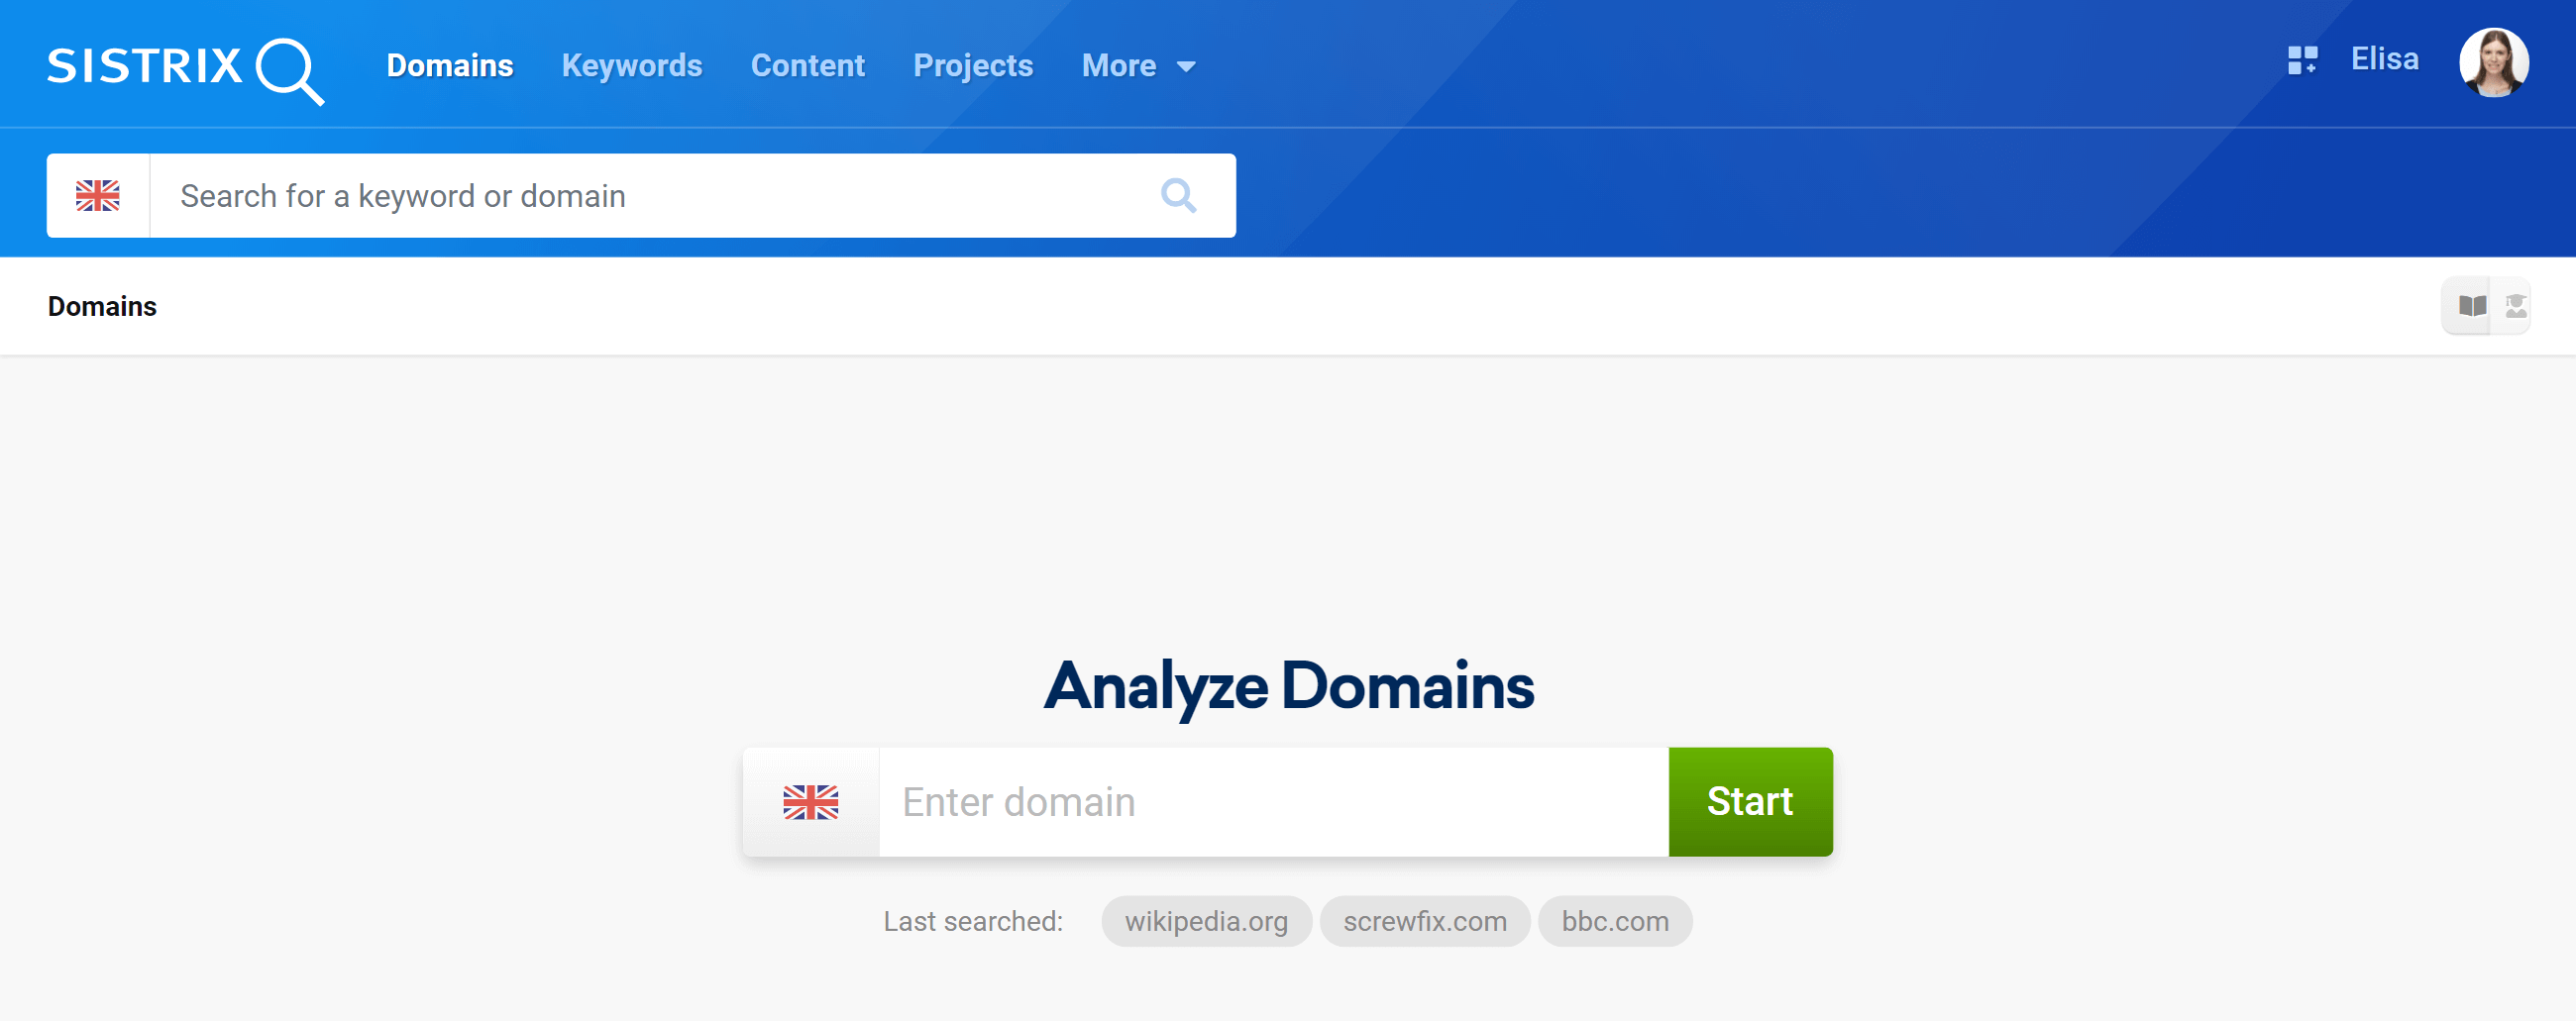
In the header of the SISTRIX Toolbox you will find links to the different overview pages divided by topic.
To analyse a specific domain (or parts of it) use the search bar or the box at the top of the page. Your last searches will be automatically displayed as quick filters to help you reach the data even faster.
Measuring the Visibility Index
The Visibility Index is an important performance indicator for the visibility of a domain (for example for detailed analyses: host, directory, URL) on Google. To find out more about the Visibility Index, we recommend the article “SISTRIX Visibility Index“.
With this function you can analyse the Visibility Index of one or more domains. First, click on “Measure and increase visibility now!”, then simply put in the domains that you want to analyse into the text box on the right and click on “Apply” to open the corresponding page. Learn more about this function in this handbook.
Analysing keywords
With this function you can analyse the discovered keywords and rankings for any domain. Enter a domain to start.
Learn more about this function in this handbook.
Discovering successful content
Discover URLs of the domain you are inspecting that were found ranking in the Top 10 and Top 100 search results on Google. This way, you can find pages that rank especially well on Google.
Learn more about this function in this handbook.
Finding unknown competitors
The SISTRIX Toolbox lists competitors, visualises connections and enables an analysis on a keyword level. Enter a domain to discover and analyse competitors.
Learn more about this function in this handbook.
Backlink analysis
With this function you can find out which defective backlinks refer to a domain. This way, you can continuously test the access of your pages and the links of your competitors.
Learn more about this function in this handbook.
Visibility Index: Movers & Shakers
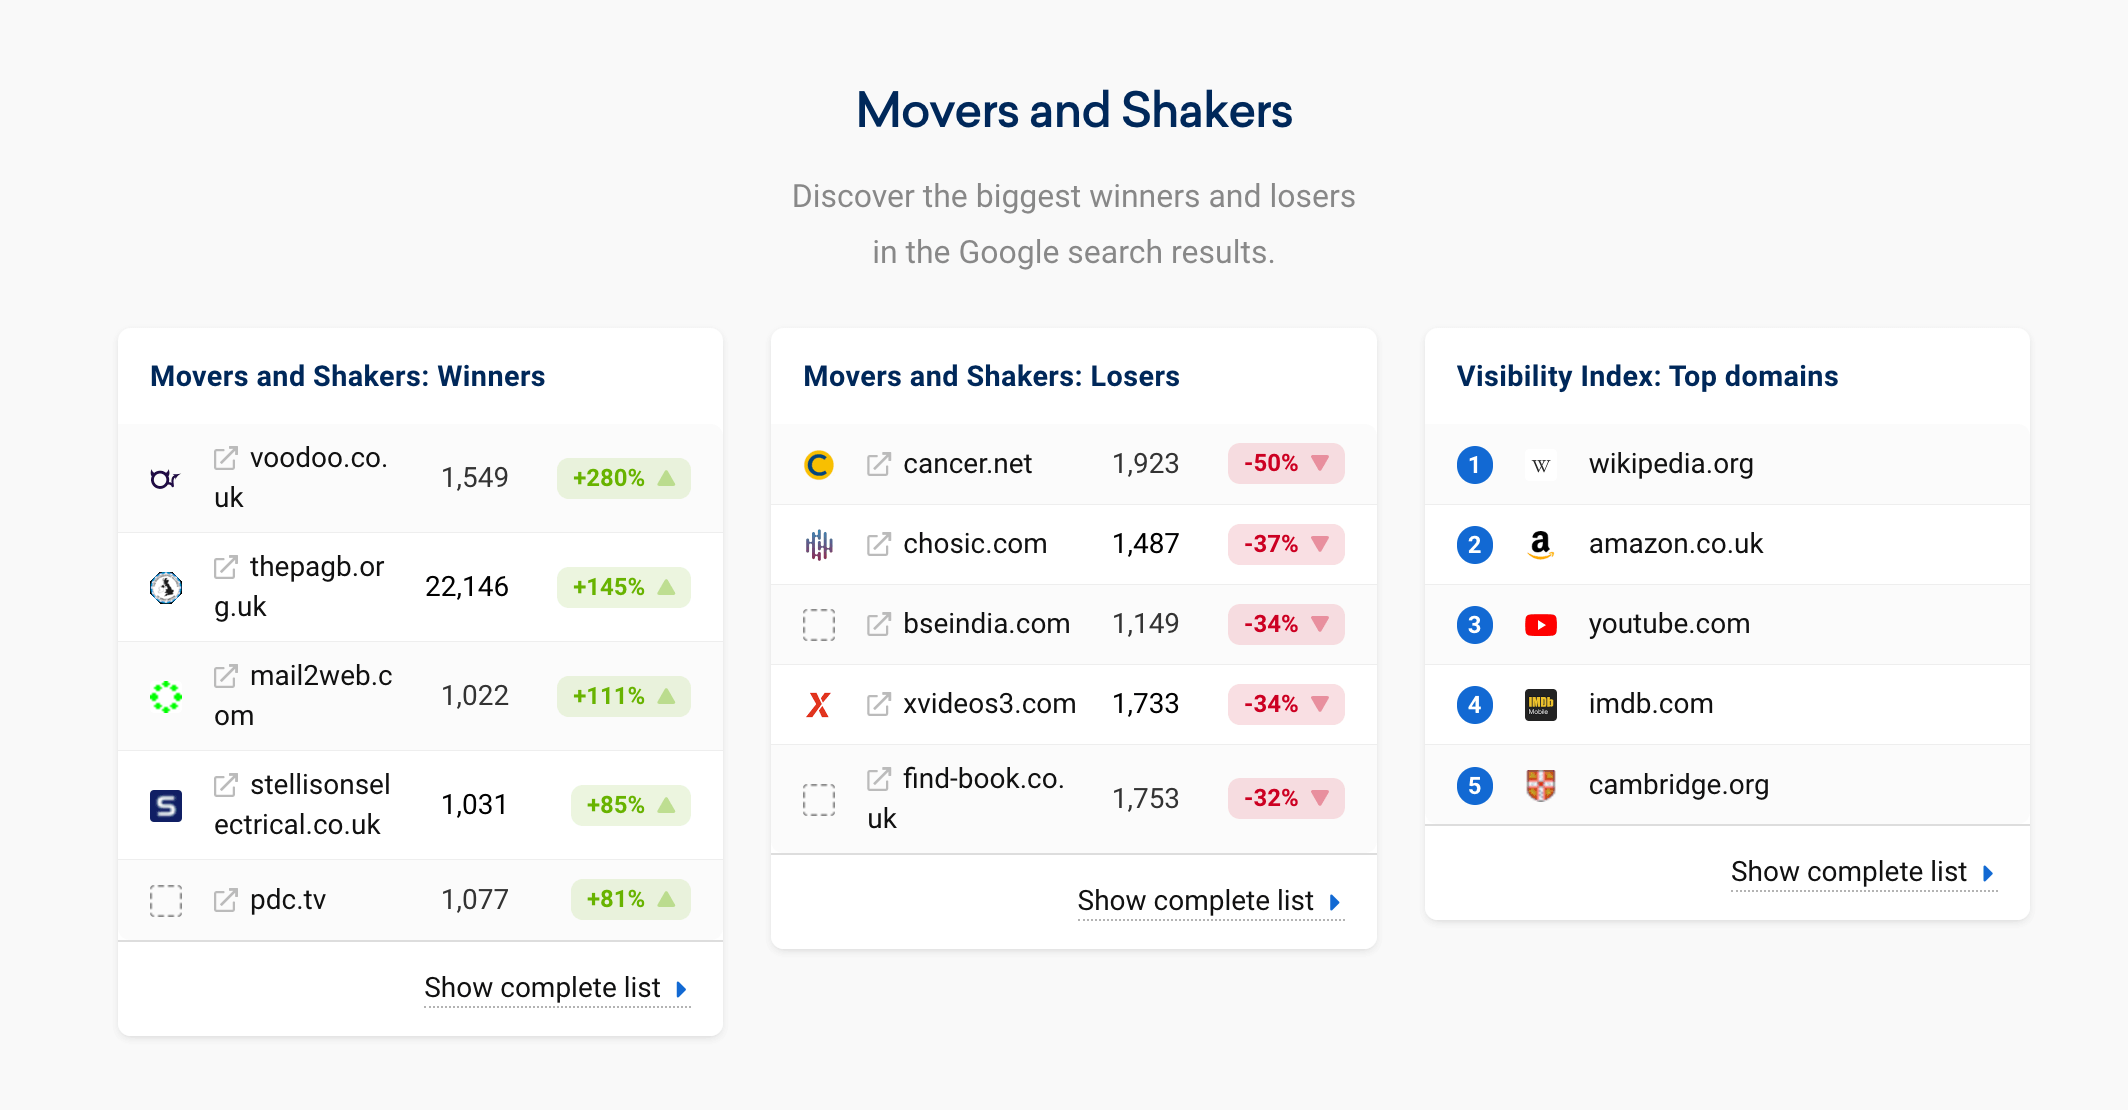
Next is the list of winners and losers within the Visibility Index for the current country. You are shown the Top-5 domains whose mobile Visibility Index has changed noticeably between the previous and current week.
The country depends on the flag you choose in the top search bar. A default country can be set in account settings.
To see the full lists click on “Show complete list” at the bottom of the table. The Toolbox will redirect you to a page where you’ll first see a complete list of the Winners then the Losers and their Visibility Index changes. These lists can provide good examples of domains that you may want to look at more closely to find out why they won or lost visibility.
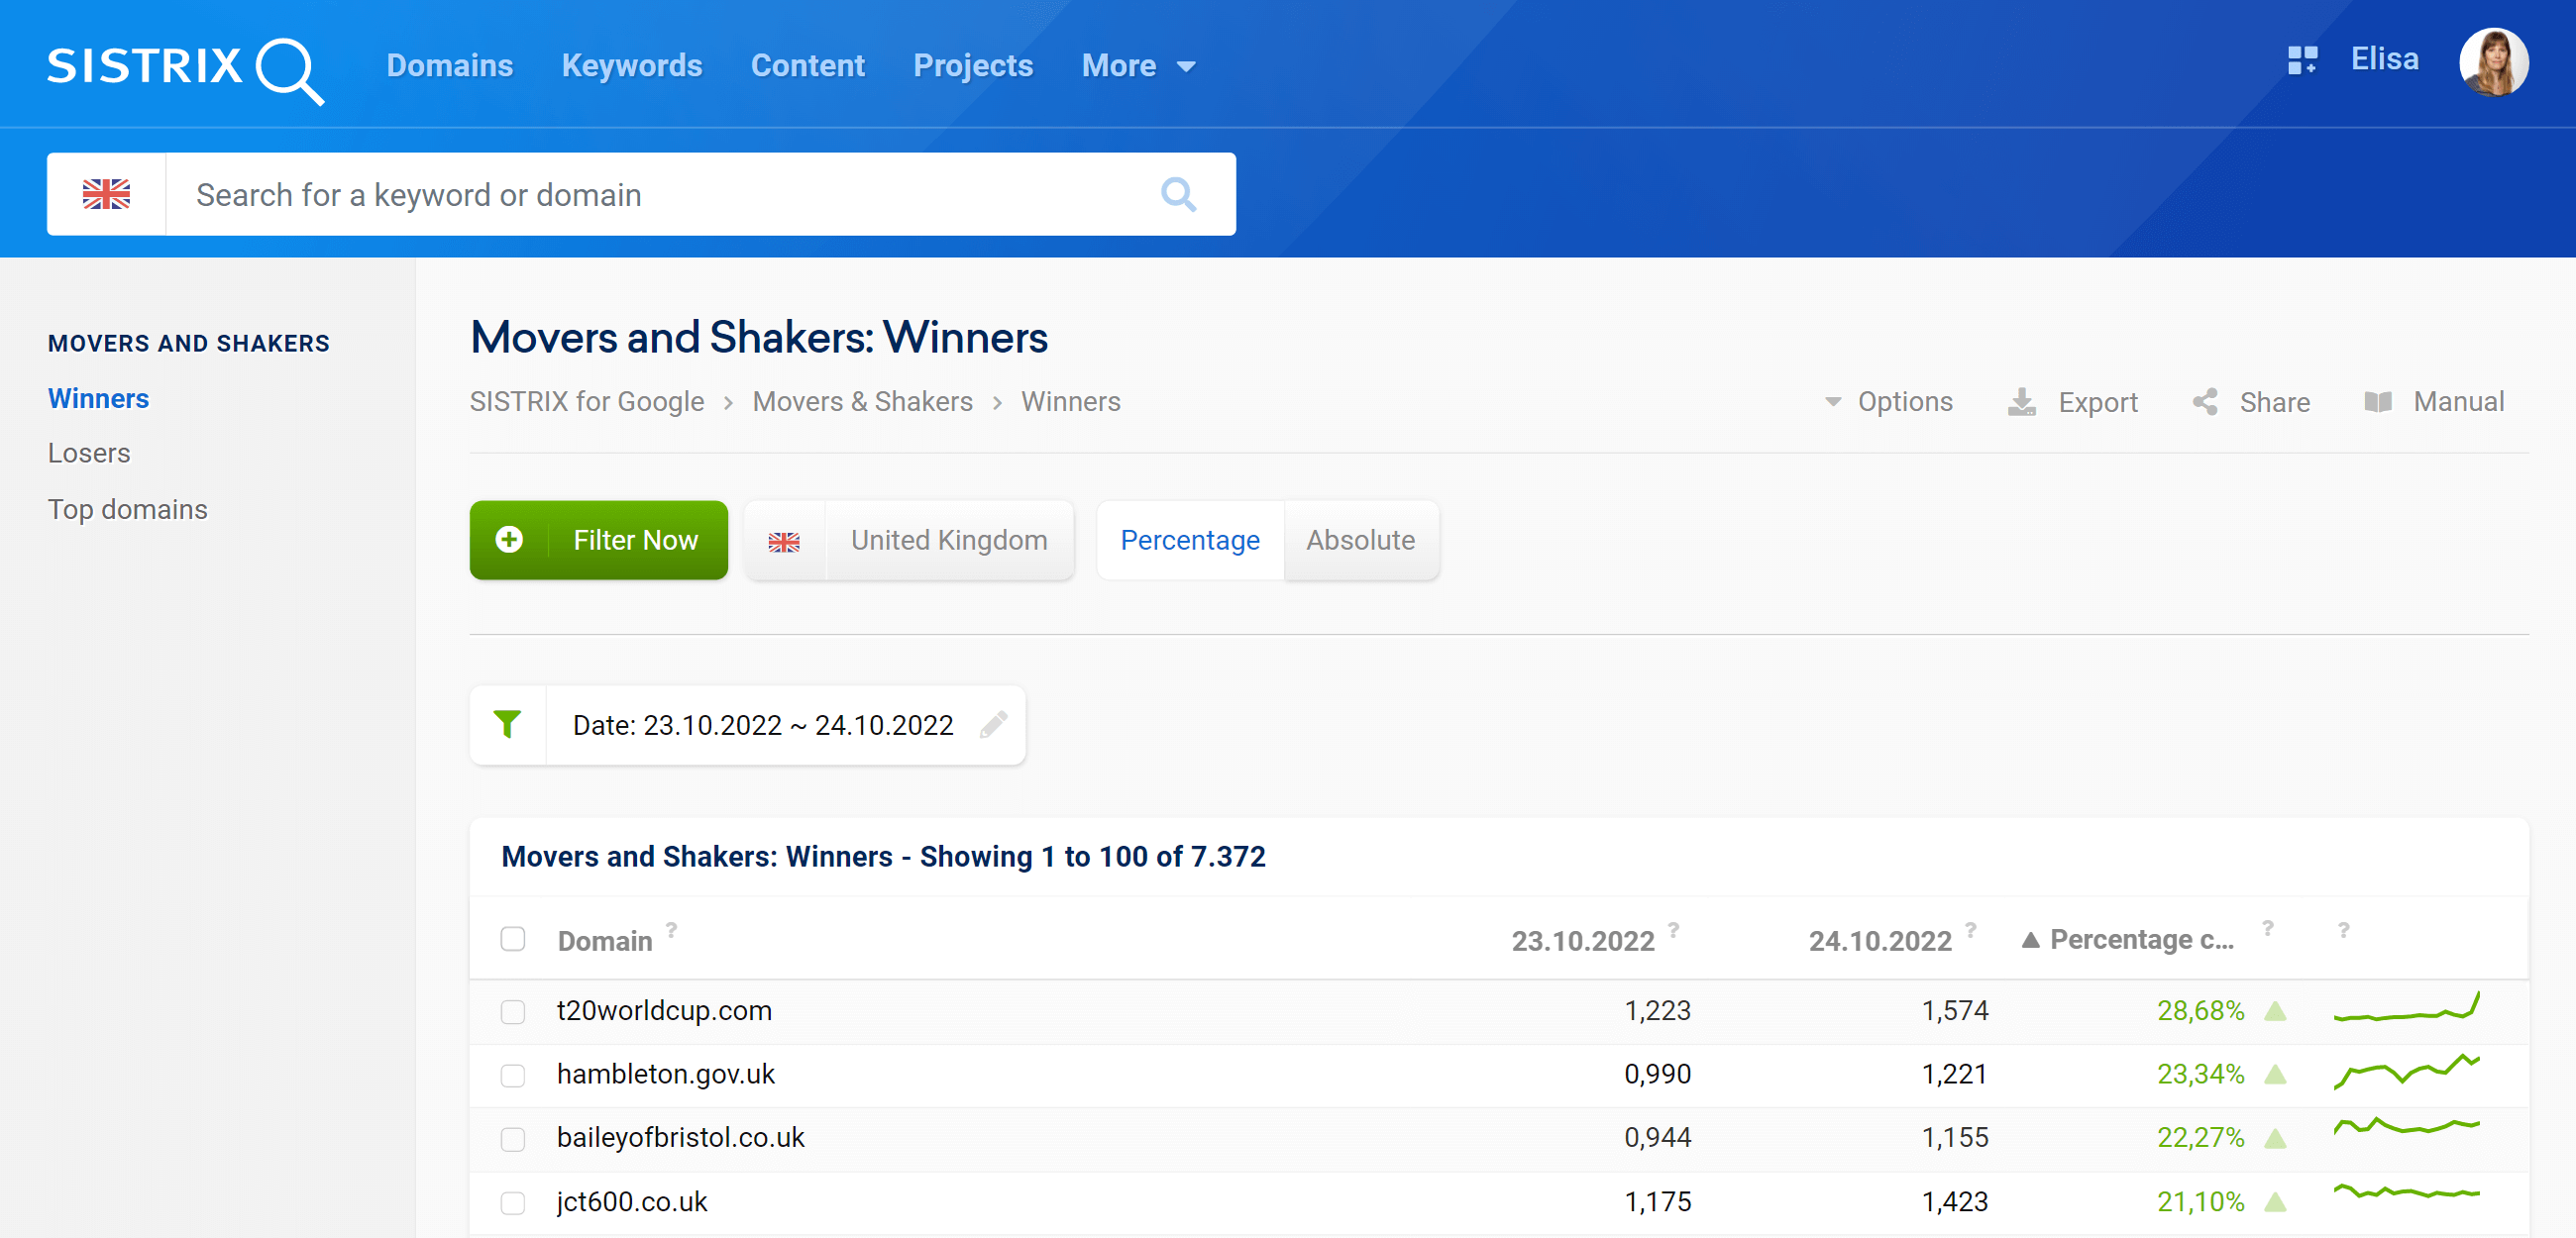
By default, the Toolbox will show you the weekly data and the percentage change. The list with changes in percentage is useful to find, for example, domain moves, technical issues and even the effect of core update changes.
The list is ordered according to the visibility change during the chosen period of time:
- Domain: The domains which gained (Winners table) or lost (Losers table) visibility.
- Date #1: Visibility Index of the domain on date #1.
- Date #2: Visibility Index of the domain on date #2.
- Change: Percentage or absolute visibility change of the domain.
- Preview: Graphic preview of the Visibility Index graph of the domain.
Thanks to the quick filters you’ll be able to compare a specific period of time within the last 3 months, change the analysed country and/or see the absolute changes. Click on the green button “Filter now” to open additional filters for the table.
Finally, the data can be exported to a PDF or shareable URL, or added to a list in SISTRIX.
Visibility Index: Top Domains
This is followed by the Top-5 most mobile visible domains for that country. The top 5 domains will be shown. In order to see the complete list, click on “Show complete list” below the table.
To see the absolute changes or filter the results, you can use the options right above the table:
- Domain: Name of the domain with its position according to its visibility on Google for that country.
- Visibility Index: Visibility Index of the domain during the current week.
- Change: Percentage or absolute visibility change of the domain.
- Preview: Graphic preview of the Visibility Index graph of the domain.
The change refers to the previous day or to the previous week, depending on the primary change selected in your settings.
The data can be exported to a PDF or shareable URL, or added to a list in SISTRIX.
Domain Favourites
If you added domains to your favourites, they will be automatically shown in a special box called “Favourites“ right below the Movers and Shakers.
The table shows the daily Visibility Index and the number of ranking positions of the domains. Moreover, you can quickly check if the domain’s visibility has increased or decreased from the previous day.
This allows you to have an overview of all your favourites and quickly check their changes: If you notice that a domain has suddenly lost a lot of visibility, you’ll just need to click on it to reach its overview page and examine the causes.
To add a domain to your favorites, type it in the search bar and click on the little star next to its name. It will be automatically added to the list.