
Linking your Google Search Console to the SISTRIX Toolbox will give you the possibility to see the keyword ranking changes. We also show you a breakdown of directories and their development over time. Video walk-through below.
If you linked your website’s property to the SISTRIX Toolbox, you can access your extended Search Console data within the project and have access to a number of key values from the Google Search Console.
Ranking Changes
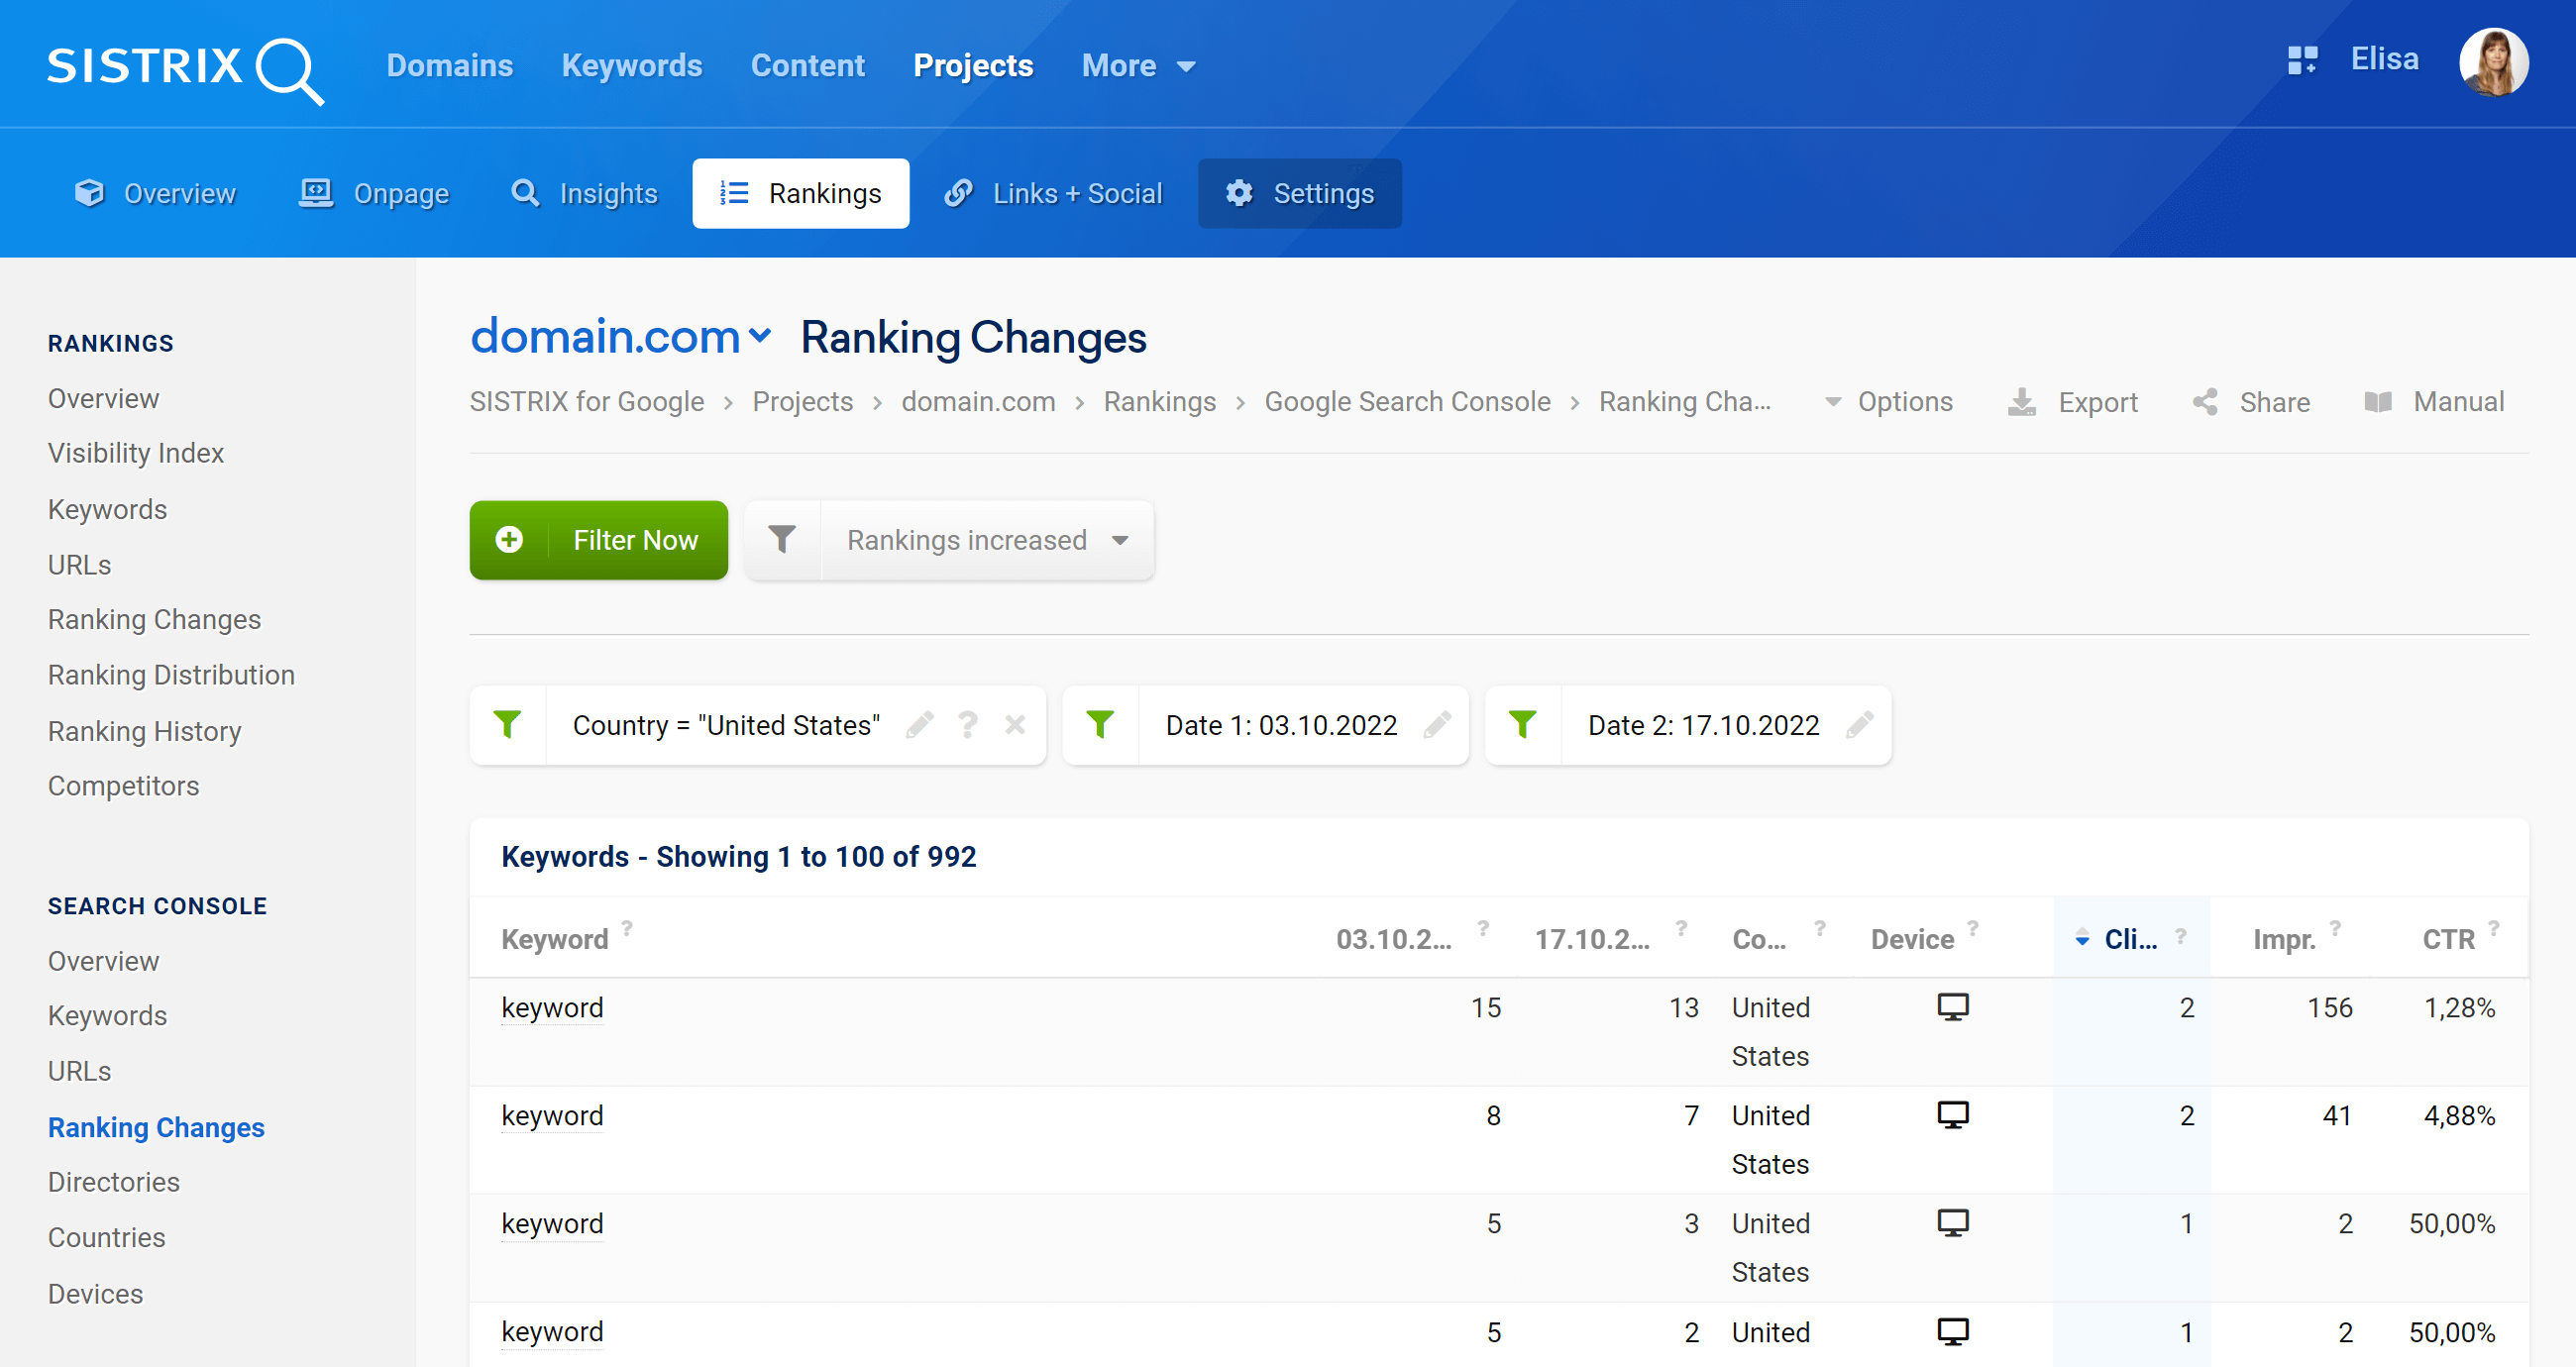
The section “Ranking Changes” allows you to see all the changes in the keyword positions of your website between two different dates.
Inside the selection boxes you can choose to see the keywords that have increased or decreased and select the specific period of time to take into consideration.
The default table that shows the ranking changes for a domain (or a path, subdomain or URL) is made up of different columns.
- Keyword: The keyword for which the domain is ranking.
- Date #1: Ranking position for that keyword on the start date.
- Date #2: Ranking position for that keyword on the end date.
- Change: Change value between the start and end dates.
- URL: the URL which is ranking for that keyword.
- Device: Device taken into consideration.
- Clicks, Impressions and CTR: Number of clicks, impressions and CTR generated from the URL.
Directories
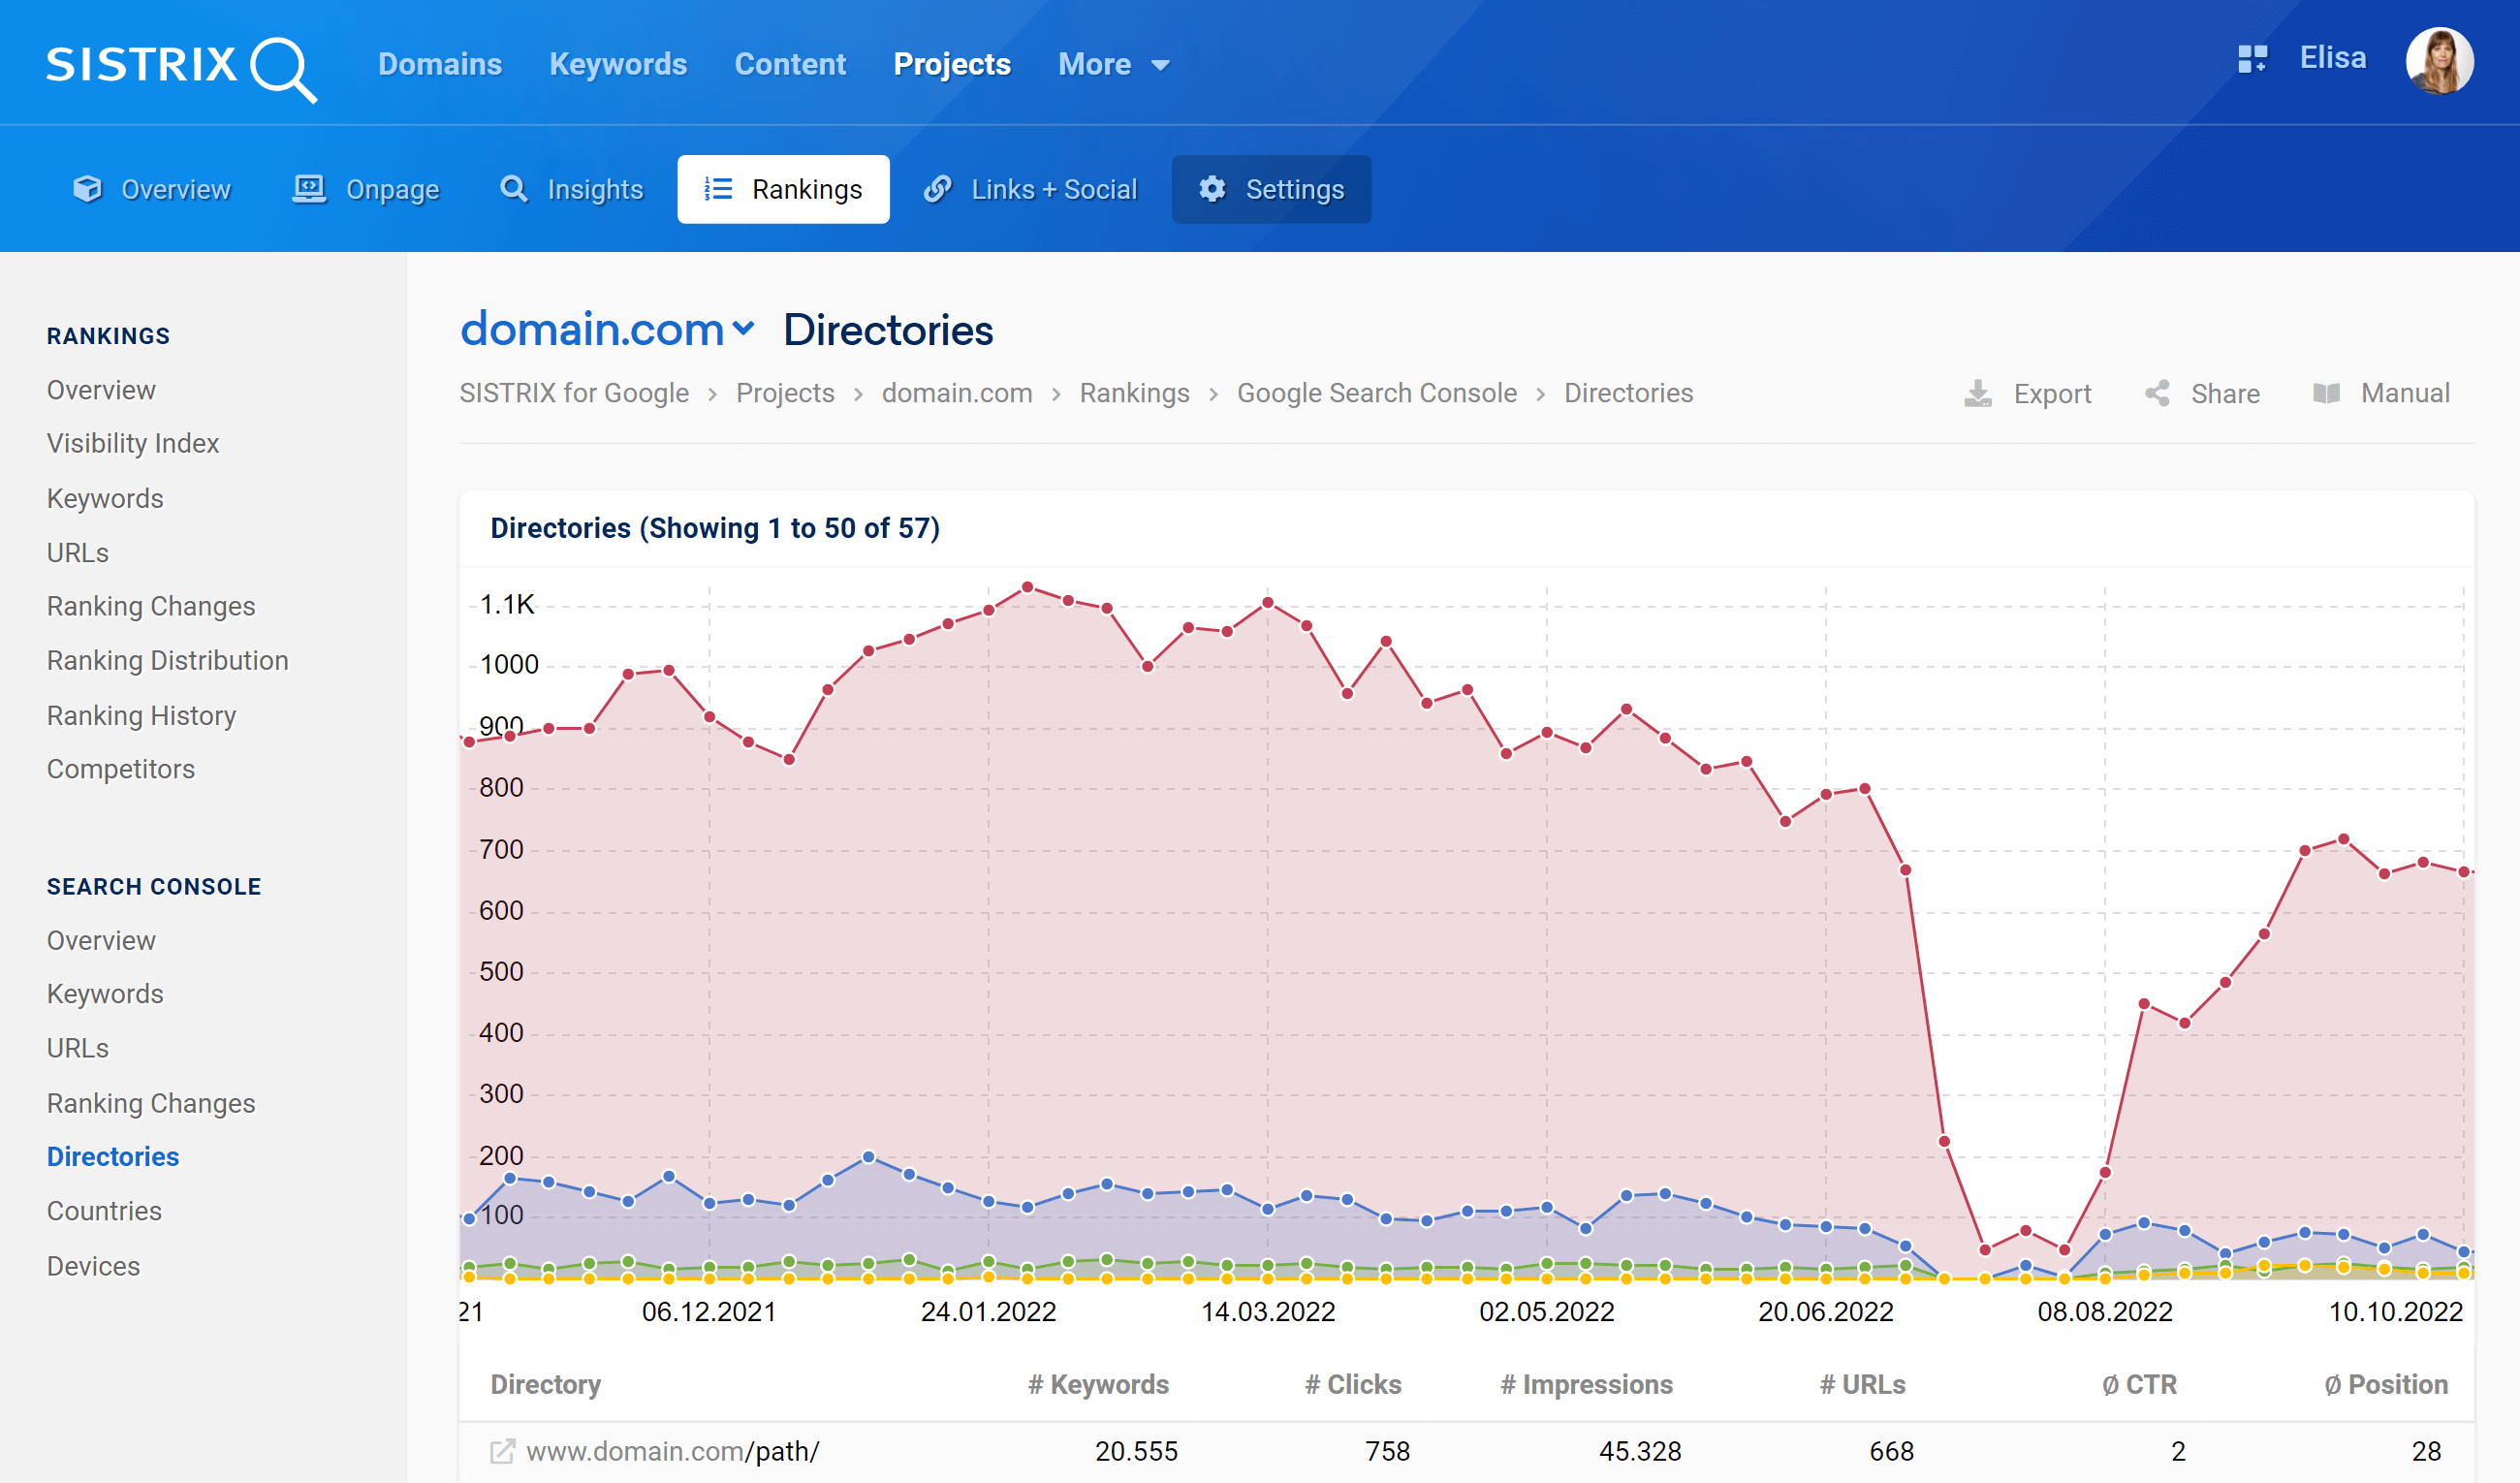
History
In this graph we will show you the historic Visibility Index development for the four most successful directories of your website.
If you hover the mouse over the chart, the Toolbox will let you see the specific data for that week.
If you need to focus on a specific period of time, you can zoom into a specific date-range by holding the mouse button down and selecting the range you would like to focus on.
Also don’t forget that the cogwheel icon at the top right corner of the chart will offer you even more options and functions. For example, you’ll are able to add an event-pin to the chart.
Table
Right under the chart you can see a table containing the following data:
- Directory: The directory itself, including all sub-directories and pages.
- # Keywords: Total number of keywords for which data exists in Search Console.
- # Clicks: Total number of clicks recorded in Search Console.
- # Impressions: Total number of impressions recorded in Search Console.
- # URLs: Amount of ranking URLs in Search Console.
- CTR: Average CTR recorded in Search Console for the directory.
- Position: Average position of the keywords for the directory.
Note that you can click on a directory to reach the overview page of the SEO module and deepen your analysis even further.