
The section “Insights Performance” in the SISTRIX Onpage projects focuses on the loading times of your project website and helps you monitor its uptime status on Google. Besides the overview page, this section is made up of three more features: “World Map”, “Uptime” and “Response Time”.
Uptime
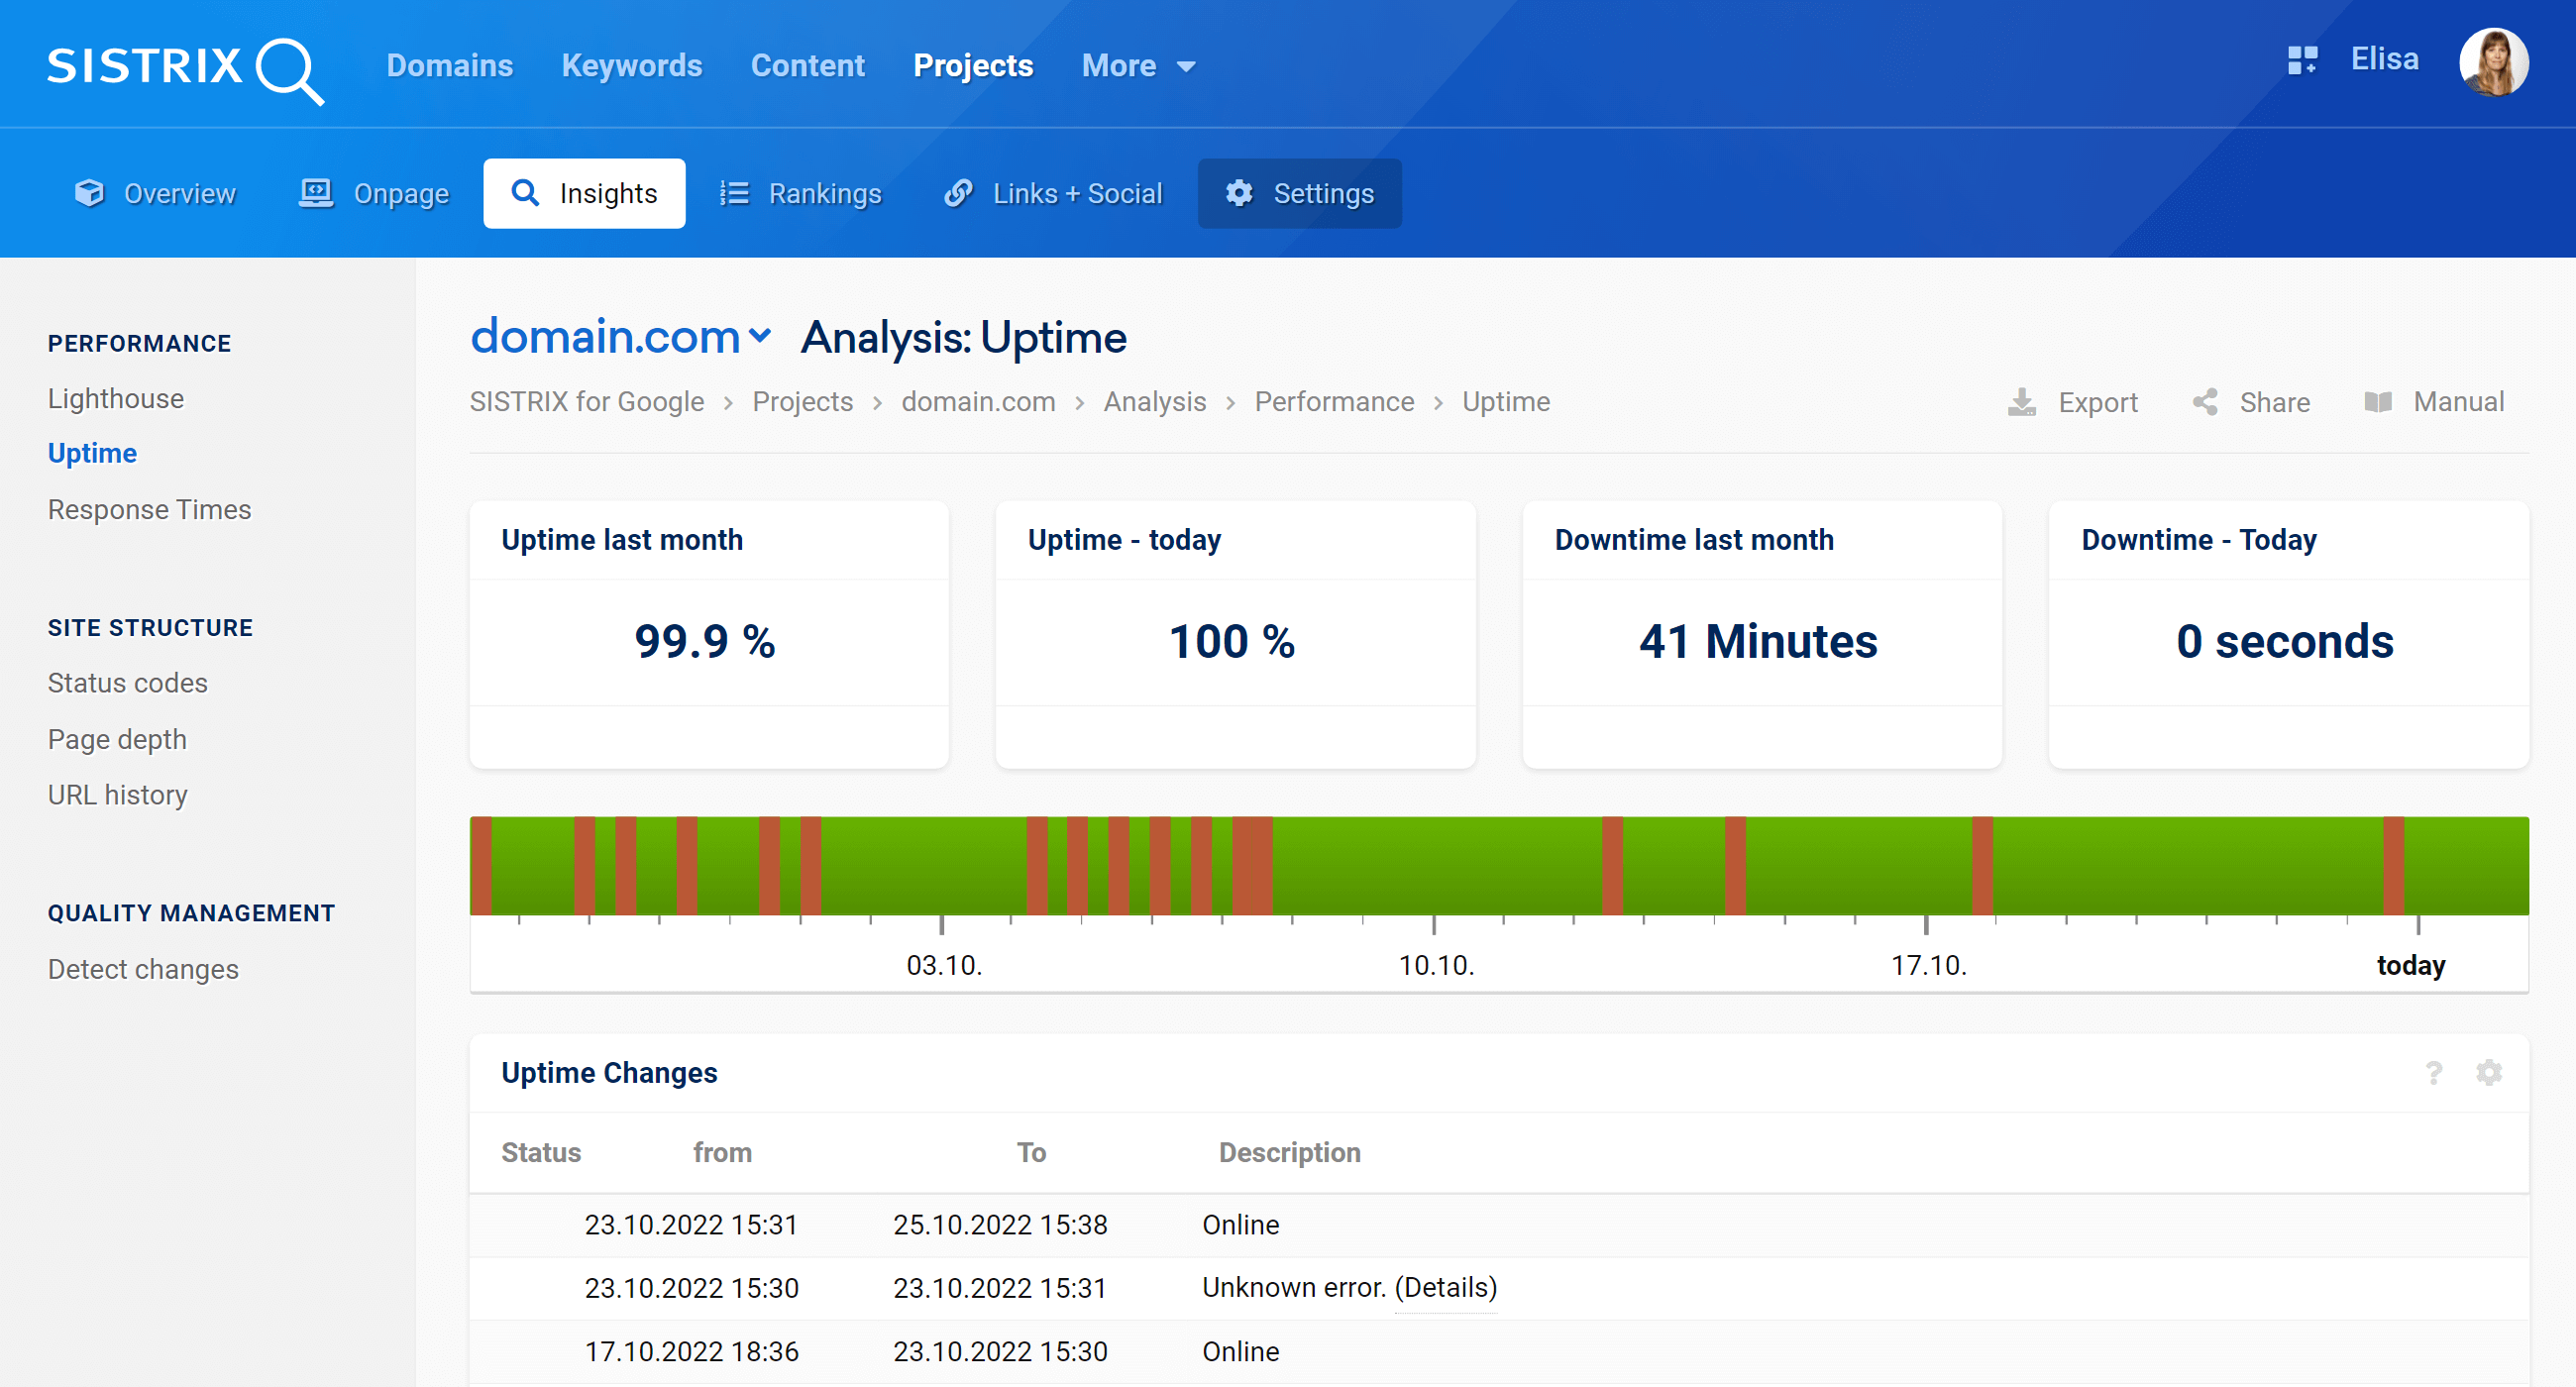
Uptime Last Month / Today
Percentage of time over the last 30 days or over last day that the site was available to our crawler. (Status code 200)
Downtime Last Month / Today
The time in the last 30 days or during today that the site was unavailable to our crawler.
Uptime Changes
Our crawler quickly checks the start-page of your domain every minute. If this check fails we will retry the availability of the page at a more frequent rate. Thanks to this, you will notice even short uptime problems, which will be marked red in the bar above.
In the table we show you the changes seen along with a description of what happened as well as the date and time at which it was found.
Response Time
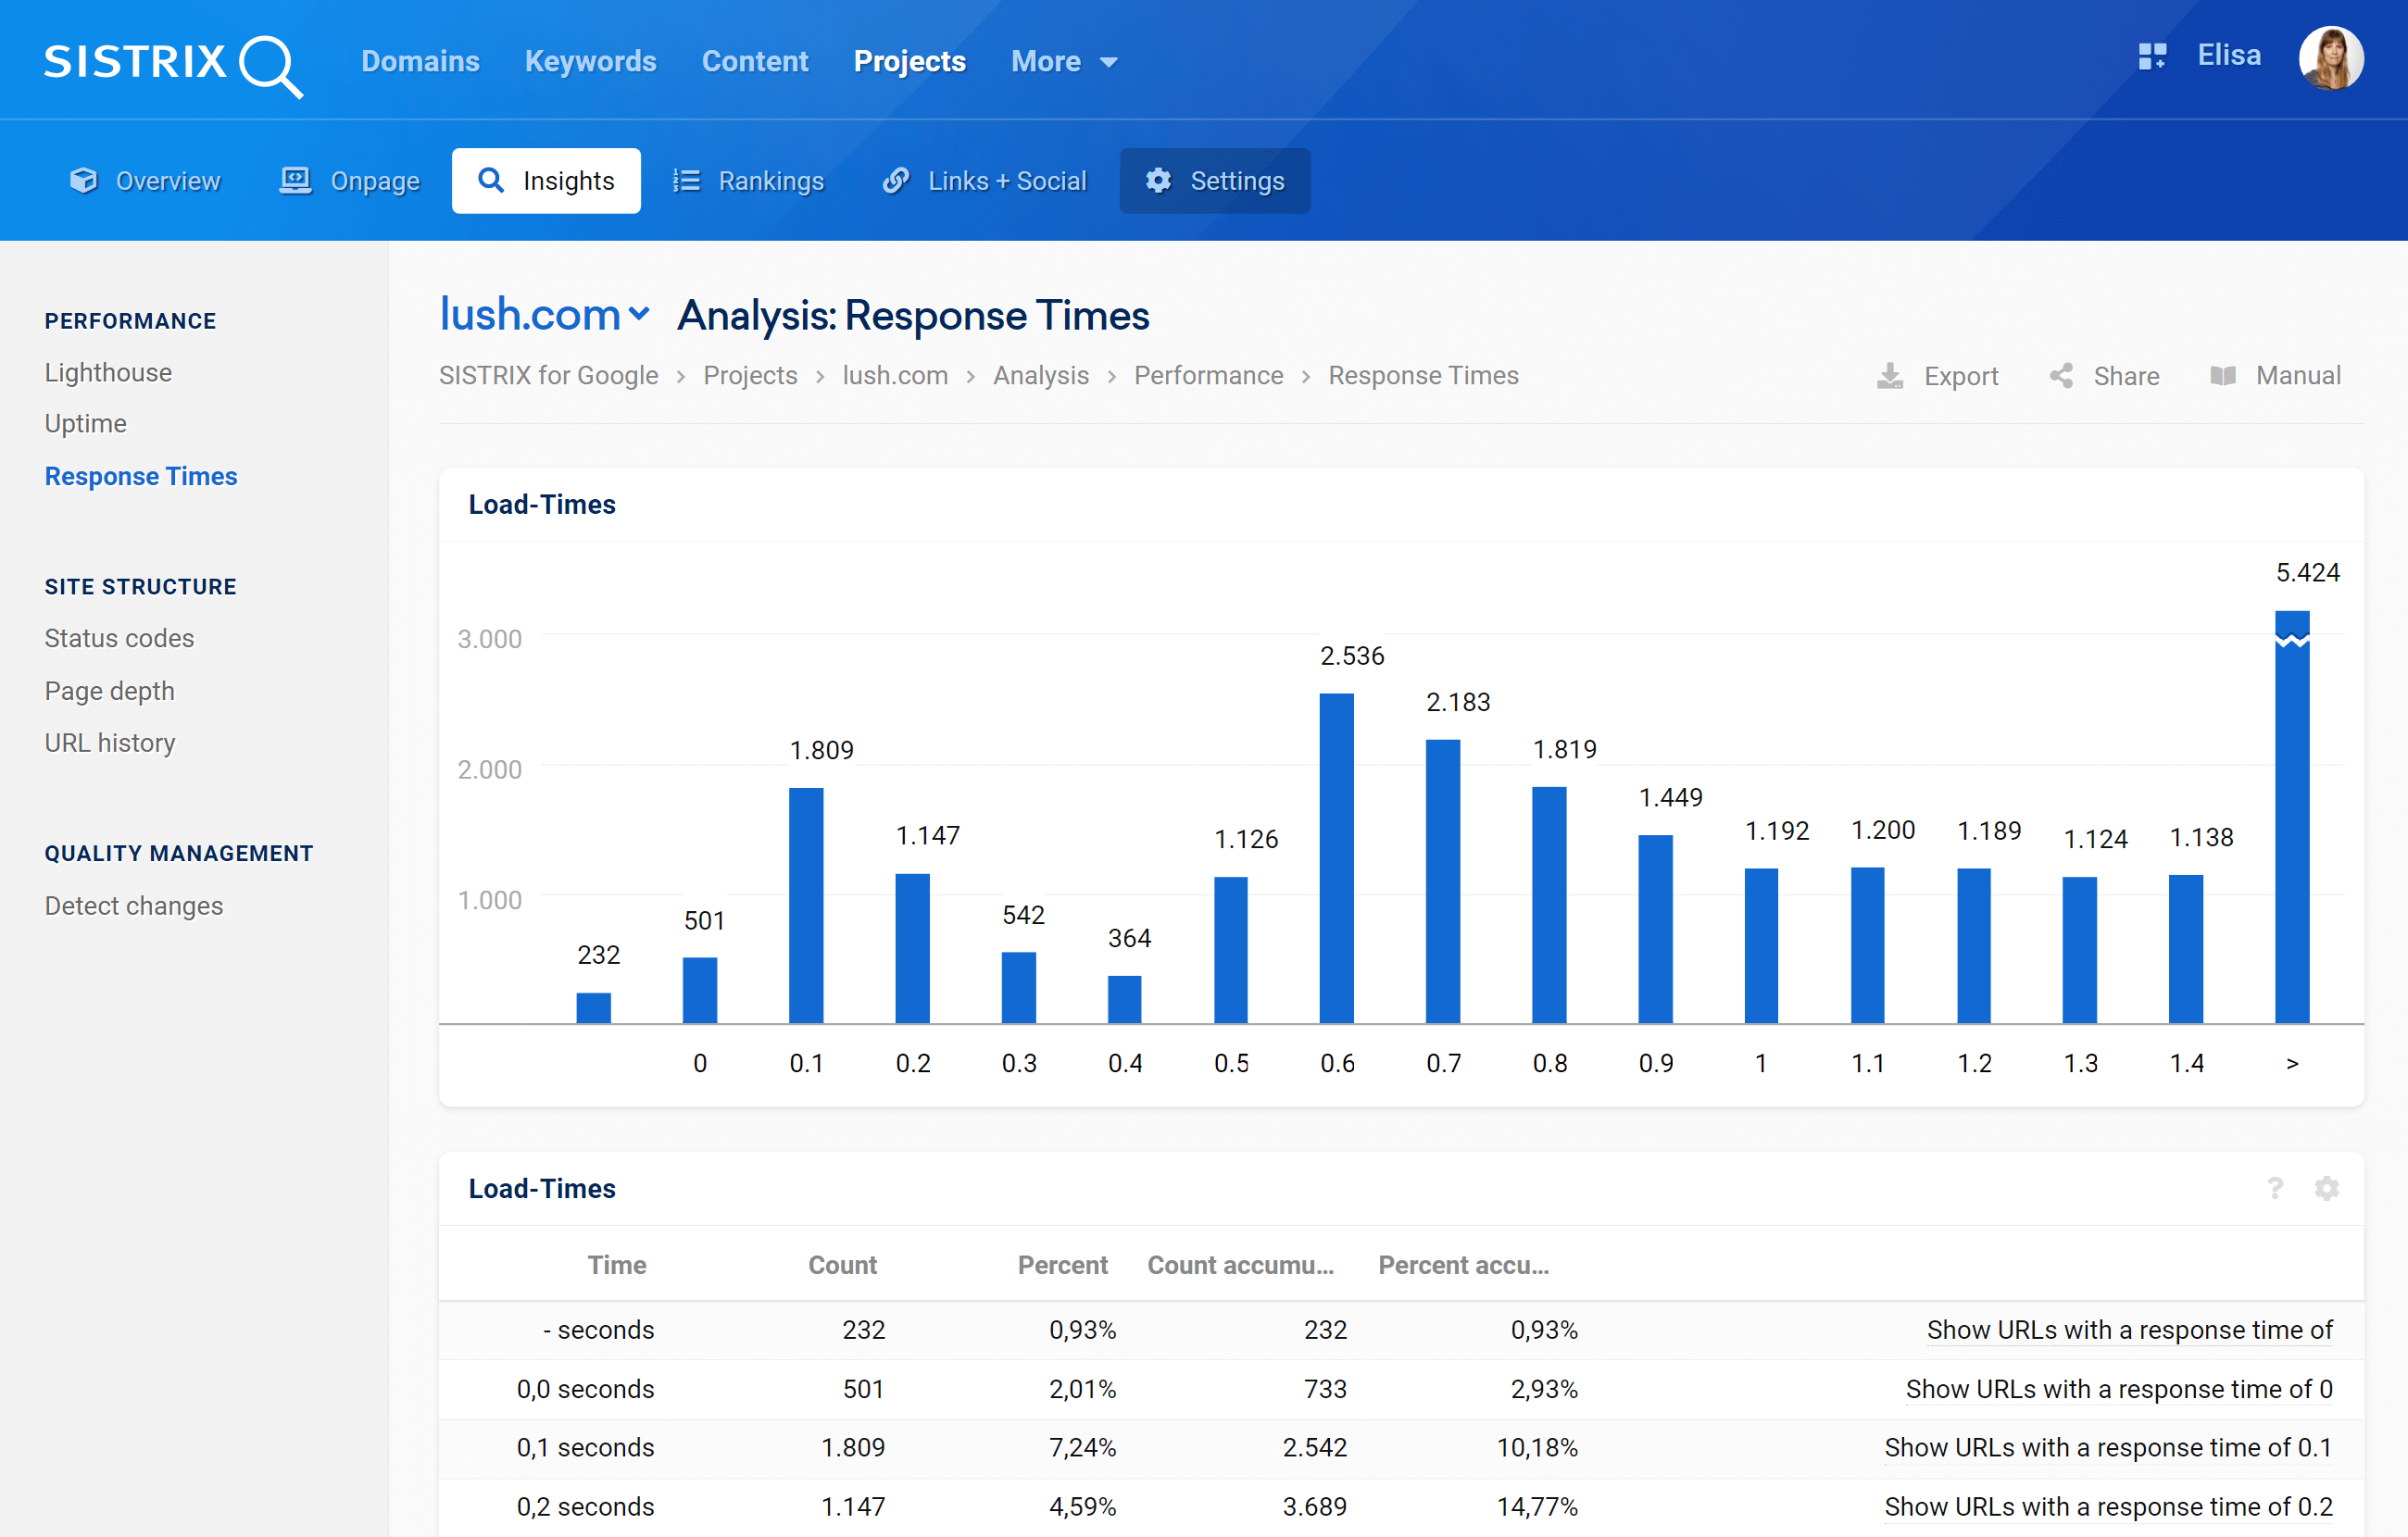
Load-Times
A quick loading time is extremely important for your users.
Find out which URLs in your Onpage project have an acceptable loading time and which don’t.
The graphical breakdown in the chart allows you a quick overview. There you can see how many URL (number above the blue bars) need how many seconds to load (number below the chart). You can find the specific URLs in the accompanying table.
Load-Times (Table)
This table allows you to quickly determine whether most of your URLs load in a reasonable amount of time.
Time: The loading time of the URLs.
Count: The number of URLs that load completely in this time.
Percent: The URLs that load completely in this time in proportion to all URLs of the domain assigned to the project.
Count accumulated: The sum of URLs that load in at least the time specified on the left. In the last row of this column, the sum therefore comprises all URLs in the project.
Percent accumulated: The accumulated percentage of URLs that load in at least the time specified on the left. In the last row of this column, the total therefore amounts to 100%.
The number and percentage of URLs, including the accumulated time and percentage, are shown next to a link that will take you to more information on the URLs.