
The Search Console overview section inside an Onpage project shows a summary of all the most important performance values from your Google Search Console. Here’s an explanation of all the boxes you’ll find. Video walk-through below.
If you linked your websites’ property to the SISTRIX Toolbox, you can access your extended Search Console data within the project and have access to a number of key values from the Google Search Console.
All the boxes can be exported or added to a Dashboard or a Report.
Clicks and Impressions
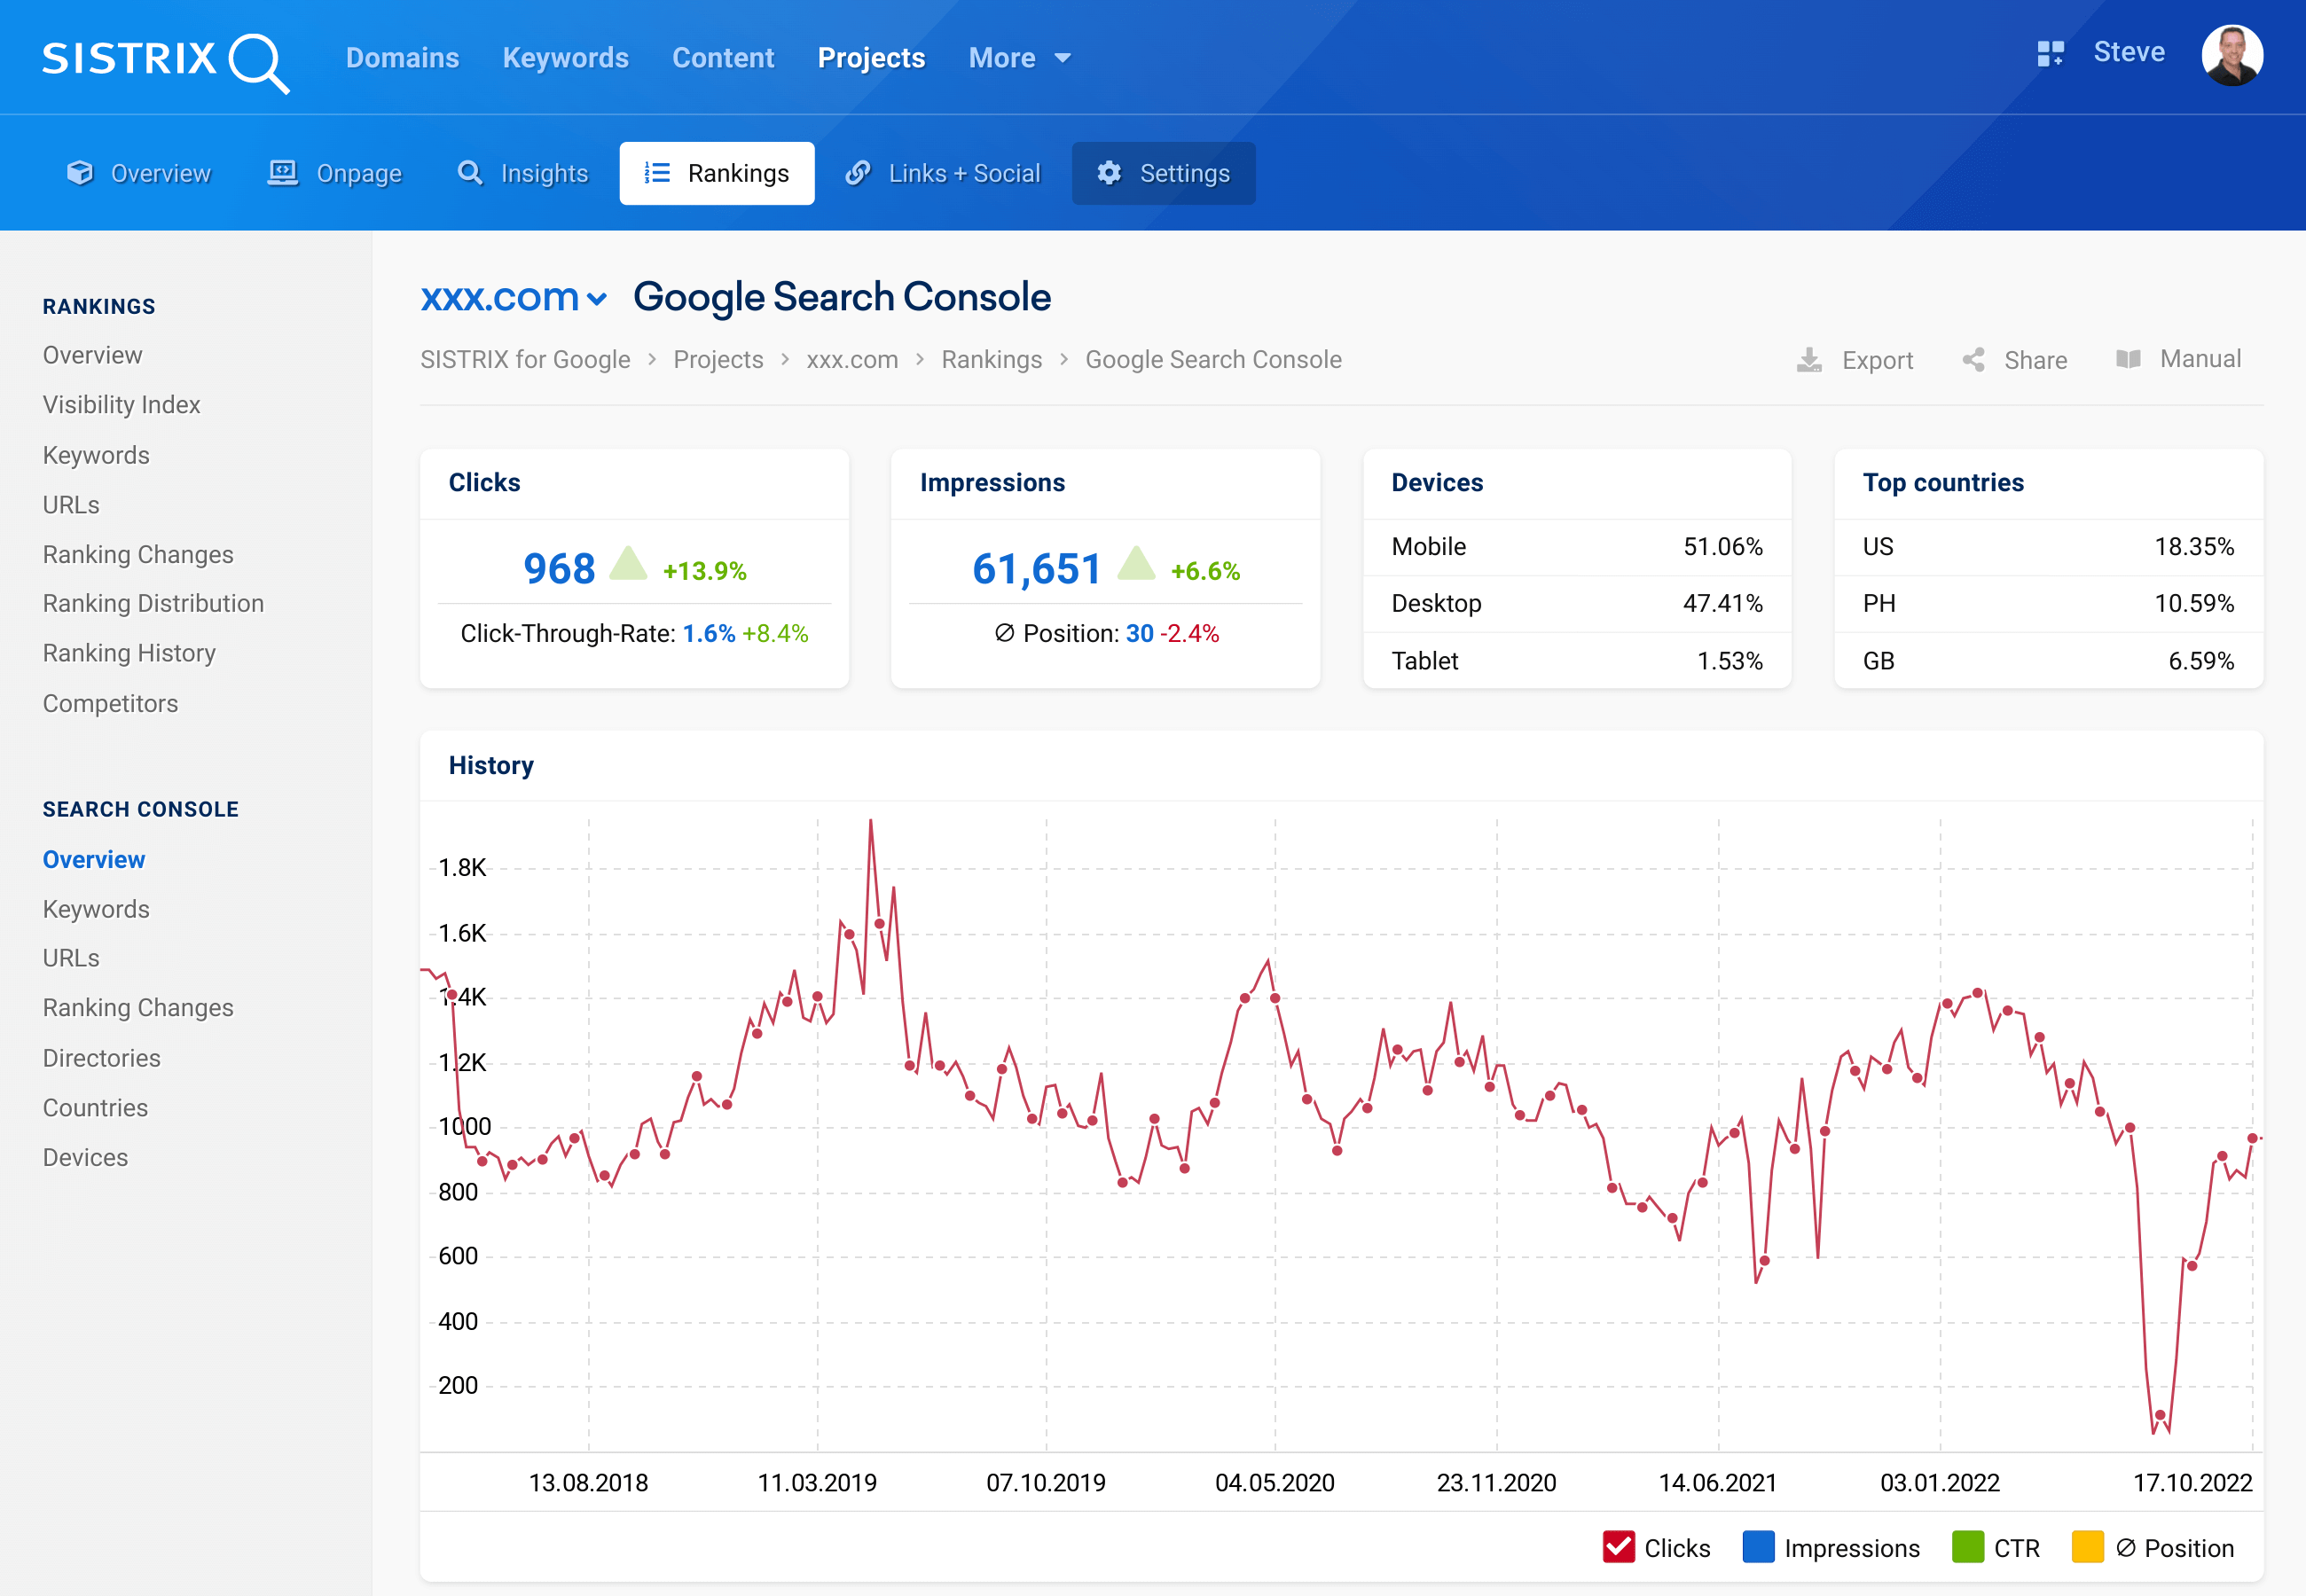
These figures, in the first two boxes on the page, give an overview of totals and the recent changes for total number of clicks and the click-through-rate, the impressions and average position from your Google Search Console Data. More information is shown in the graph and directory break down below.
Note: To view the actual keywords, go to the “Keywords” menu item.
Devices and Countries
The following two boxes show which devices (mobile, desktop and tablet) and countries (top three) the traffic is coming from, as reported by Search Console.
Performance history
To help you monitor progress and changes in traffic we provide you with various data sets from Google Search Console.
Click, impression, CTR and average position history is shown in this graph. Use the selectors at the bottom of the graph to focus on one metric.
Google Search Console Keywords
In this section you’ll find keyword data imported via the connection to Google Search Console. Click on column headers to sort the results.
For example, see all keywords with a ranking position from 1 to 10, from the USA, for mobile.
Data is archived on a weekly basis and you can select historical dates for comparisons.