
The Insights’ overview page within your Onpage project will give you extensive data about selected pages on your project’s website, focusing mainly on Core Web Vitals and other performance data.
General Options
At the top right corner of the page you’ll find some general settings, in particular:
- Download JSON: Download the original report as JSON file.
- Restart crawler: Start our onpage crawler to get new data. You can start the crawler as often as you like.
- Export: Download the data contained in this section. Read more about exports and credits here.
- Shortlink: Share the page with other Toolbox users. You’ll get a personalised shortlink, active for a few days, that you can share without any limitations.
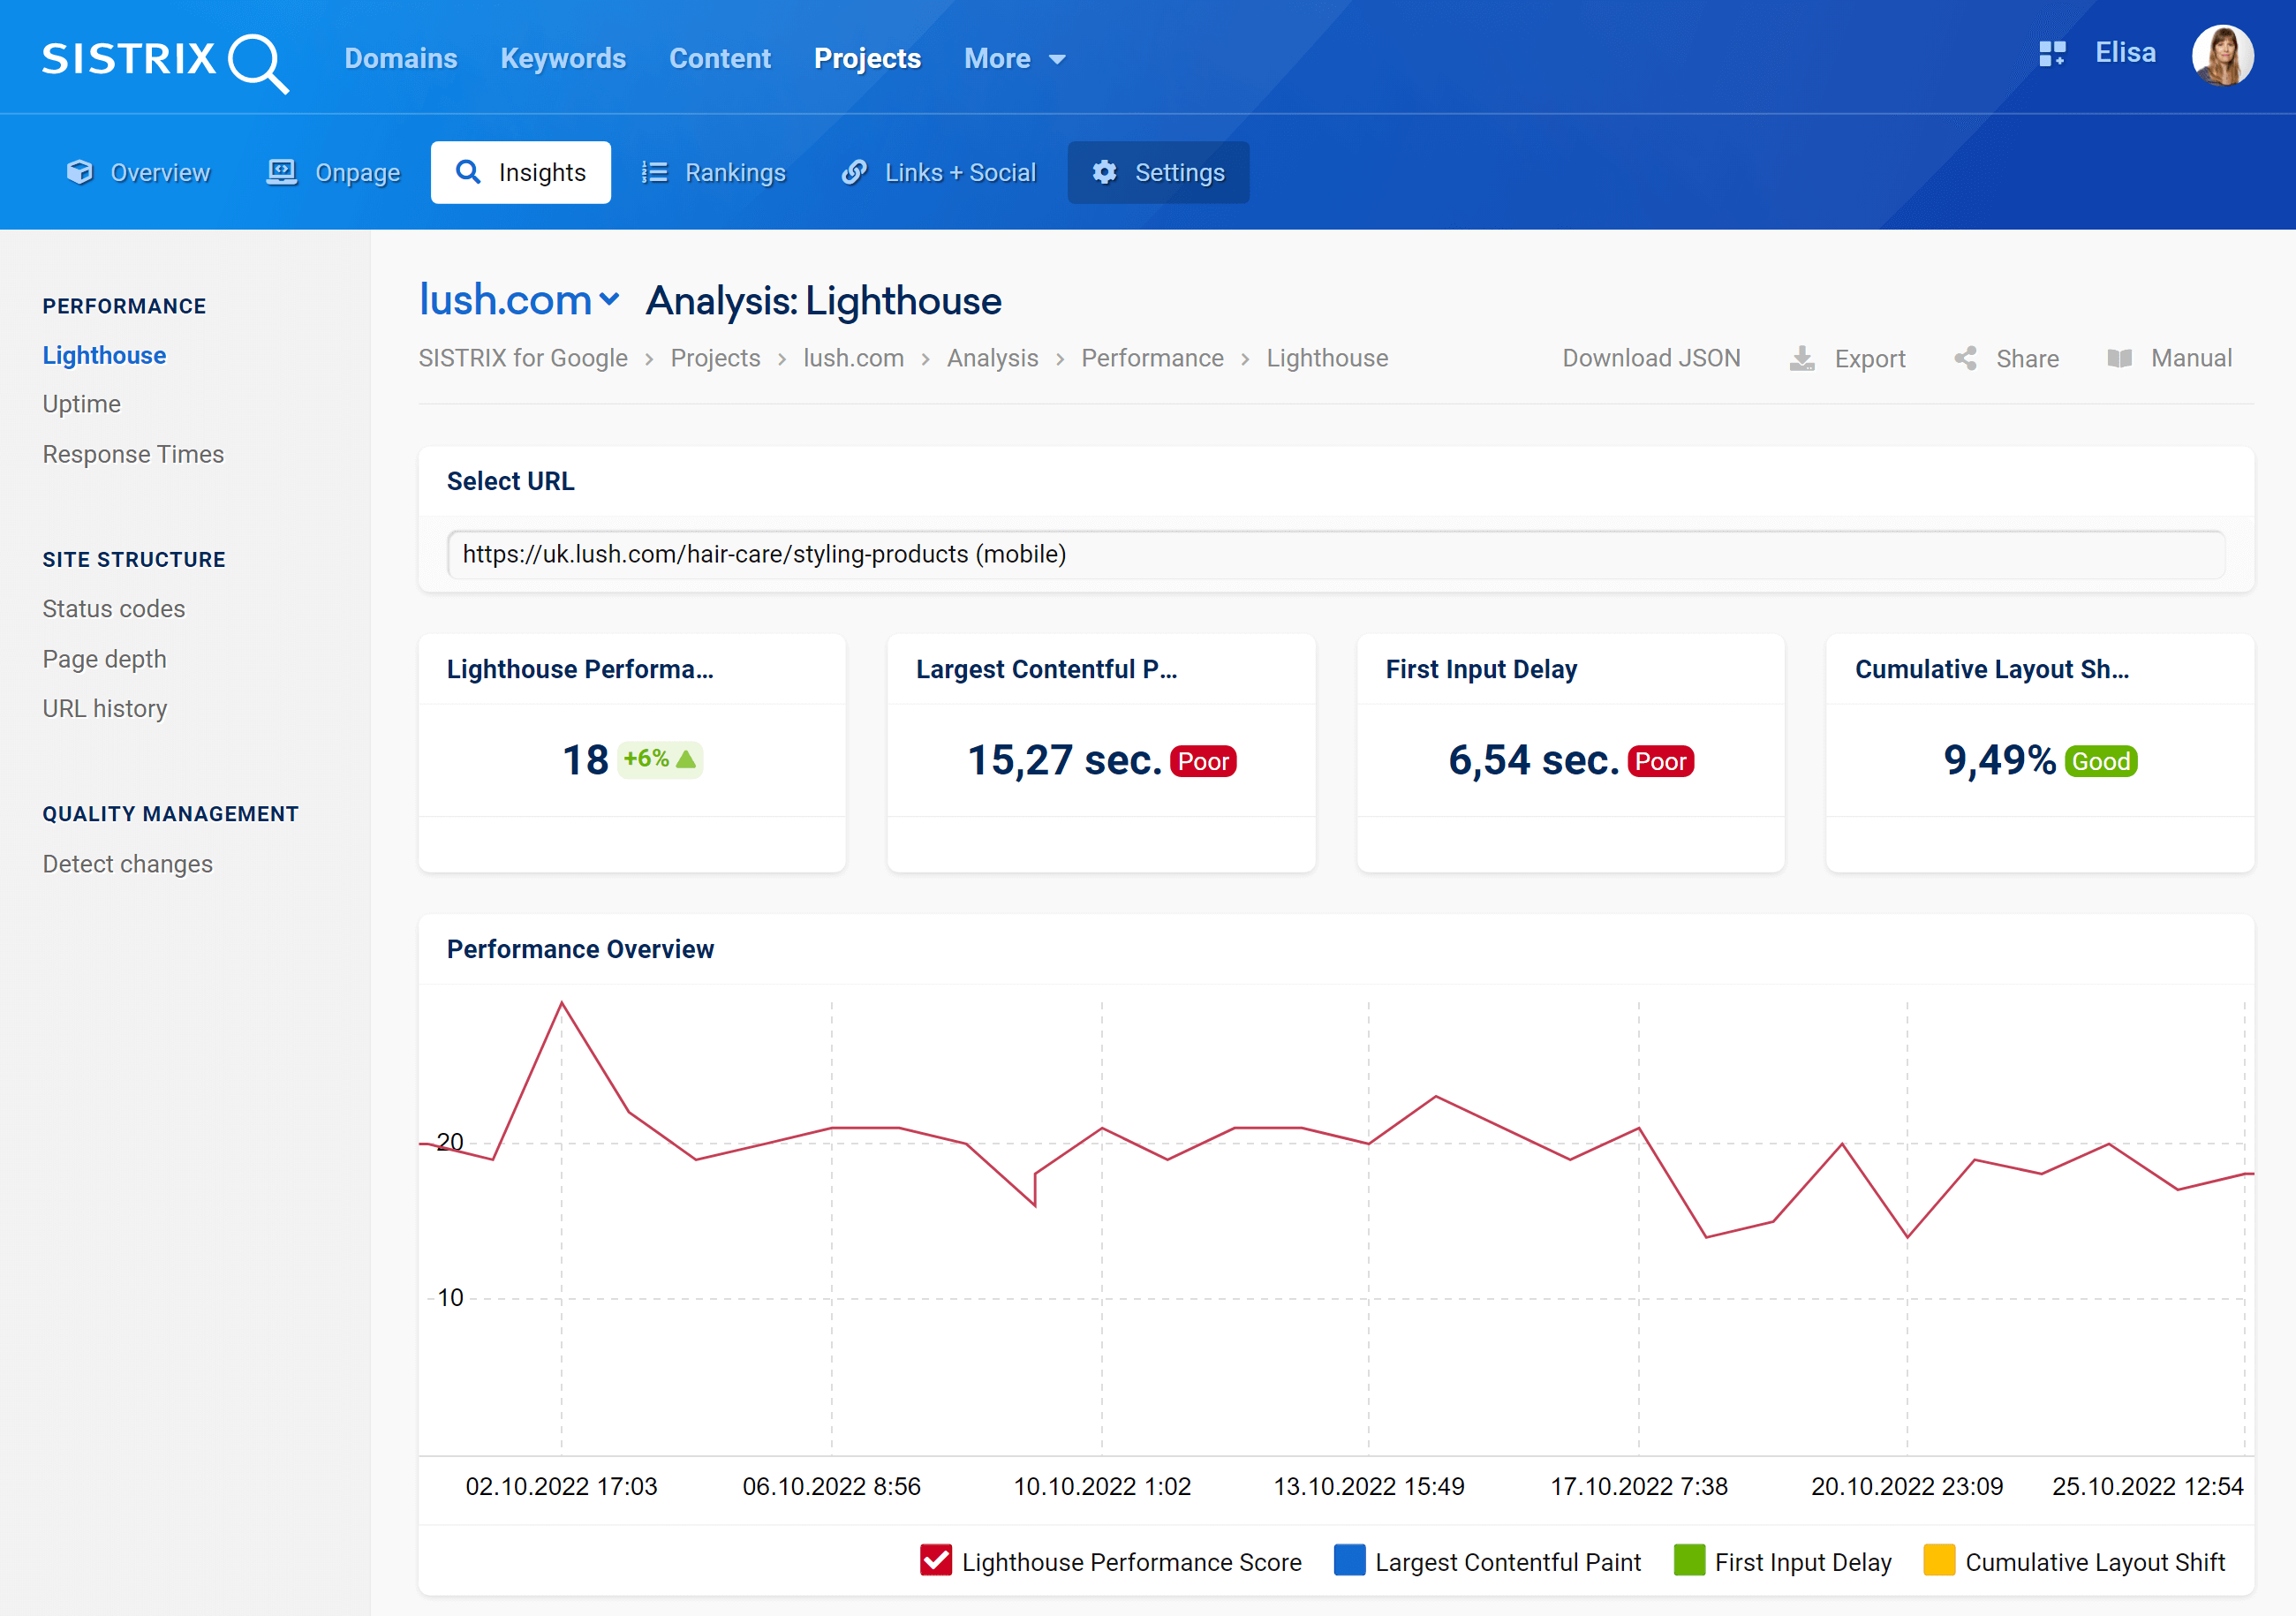
Select URL
Here you’ll find the page which is being monitored.
By default this section analyses the homepage of the website, but you can add other URLs under “Performance Monitoring”, inside your project’s Settings.
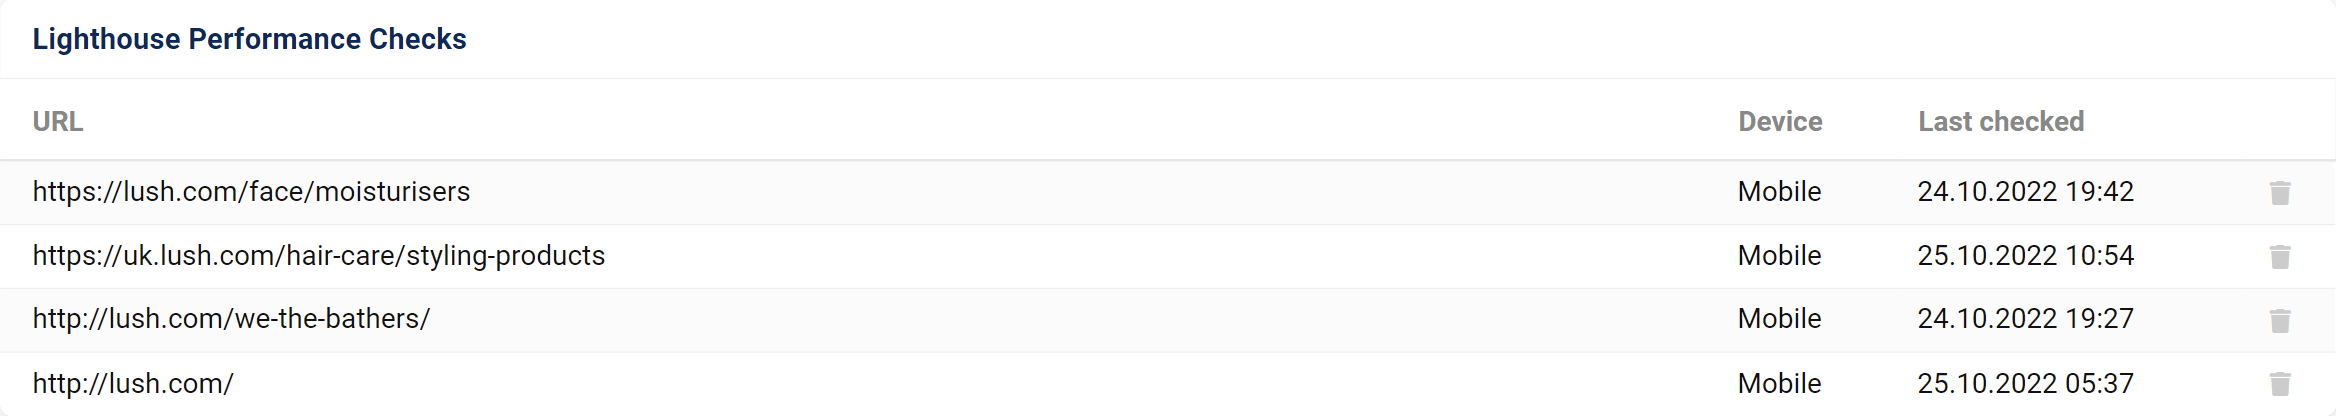
If you add another page, you can select its URL in the drop-down menu.
Lighthouse Performance Score
Here you find the metric Lighthouse Performance Score of the analysed page. This value is taken directly from Google Lighthouse and it is updated daily.
The metrics scores are colored according to these ranges:
- 0 to 49 (red): Poor
- 50 to 89 (orange): Needs Improvement
- 90 to 100 (green): Good
Largest Contentful Paint
The Largest Contentful Paint (LCP) is one of the three Core Web Vitals and it relates to the loading speed. It measures how long it takes for the largest block of content to become visible to the user.
The results of this evaluation can be:
- Good: Less than 2,500 milliseconds
- Needs improvements: Until 4,000 milliseconds
- Poor: more than 4,000 milliseconds
First Input Delay
The First Input Delay is the one of the three Core Web Vitals and it measures the time between an interaction on the page, and the response, i.e. how long the browser reacts to user input.
The results of this evaluation can be:
- Good: Less than 100 milliseconds
- Needs improvements: Until 300 milliseconds
- Poor: more than 300 milliseconds
Cumulative Layout Shift
The Cumulative Layout Shift is the one of the three Core Web Vitals and it measures whether the layout of the half-loaded page is stable or whether there are significant layout shifts during the loading process.
The results of this evaluation can be:
- Good: Less than 10%
- Needs improvements: Until 25%
- Poor: more than 25%
Performance Overview
Get an overview of the Core Web Vitals of the project website over the last week and find potential for optimisation. Tick the different values to hide or see them in the chart.
Hover the mouse on the chart to see the Core Web Vitals values for a specific date. You can also zoom into a specific date-range by holding the mouse button down and selecting the range you would like to focus on, or click on “Fullscreen” to let the graph fit your entire screen.
Click on the cogwheel icon to download the chart or add it to a dashboard or a report.
To learn more about the Core Web Vitals please read this article.
Resource Waterfall
How long does each resource on the page need until it is loaded?
In the waterfall diagram you’ll find a list of all resources as they were loaded, their status code and the time it took to load them.
Hover the mouse on the bars to see the loading time for a specific resource.