

Brands, foods, recipes, clothes, household, information, finance, banking. While it might say Tesco on the domain, evaluating search marketing success across supermarket brands is difficult. You can take a high level domain vs domain comparative approach, or, for the best view of the competitive environment, use a targeted basket of search terms. In this article we expose the real competitors. Spoiler alert: The Big Four aren’t what you think they are.
- What is the 'supermarket sector'?
- UK supermarket brands listed by Visibility Index and growth
- Desire-led analysis
- User intent 1: The generic RPI basket
- User intent 2: The online shopping search intent
- User intent 3: The groceries delivery basket
- What do people in the UK really want delivered?
- Your take-away
- Search volume history for delivery
Discover how SISTRIX can be used to improve your search marketing. 14 day free, no-commitment trial with all data and tools: Test SISTRIX for free
Follow the Retail Grocery Sector reports and trackers in our Visibility Leaders project.
What is the ‘supermarket sector’?
As with many ‘sector’ categorisations, it isn’t optimal to group the traditional supermarket brands together. Not only do their offerings change over time, but in the online world there are niche, hidden champions and non-UK competitors that you must consider in the digital high-street. You will see this clearly in the reports below.
While Sainsburys have a bank, Nectar points and other retail operations, the main domain is focused on food, clothing and home products. Marks and Spencer, on the other hand, haven’t focused strongly on groceries in the past. The Co-Op hosts their Funeralcare services on their main domain and at Tesco there’s a range of services including Clubcard, recipes, a monthly magazine and a mobile phone service provider.
The BBC brand and US-owned Good Housekeeping domains are vying for your research clicks too so whatever anyone says about bricks-and-mortar, remember that it doesn’t apply in the eCommerce world.
Despite this, the trade press still (mostly) gathers around a core set of brands. In this report we’ll show you the vast differences in the digital world of search.
UK supermarket brands listed by Visibility Index and growth
Here are the well-publicised supermarket brand domains listed along with their digital footprint size in search – the Visibility Index.
| Domain | 2025-07-01 | 2024-07-01 | VI change | Percent change |
|---|---|---|---|---|
| asda.com | 101.229 | 52.3643 | 48.8647 | 93.32% |
| marksandspencer.com | 136.716 | 106.2321 | 30.4839 | 28.70% |
| tesco.com | 121.032 | 96.4438 | 24.5882 | 25.49% |
| bmstores.co.uk | 26.1198 | 10.5504 | 15.5694 | 147.57% |
| sainsburys.co.uk | 63.803 | 48.6662 | 15.1368 | 31.10% |
| costco.co.uk | 9.7082 | 4.6095 | 5.0987 | 110.61% |
| waitrose.com | 10.9558 | 7.6831 | 3.2727 | 42.60% |
| morrisons.com | 10.6758 | 7.7317 | 2.9441 | 38.08% |
| aldi.co.uk | 4.5504 | 2.3752 | 2.1752 | 91.58% |
| coop.co.uk | 9.4586 | 7.7124 | 1.7462 | 22.64% |
| iceland.co.uk | 4.7828 | 3.086 | 1.6968 | 54.98% |
| ocado.com | 6.5144 | 4.8445 | 1.6699 | 34.47% |
| lidl.co.uk | 2.129 | 1.3878 | 0.7412 | 53.41% |
| onestop.co.uk | 0.6774 | 0.3259 | 0.3515 | 107.86% |
| booths.co.uk | 0.9057 | 0.7241 | 0.1816 | 25.08% |
| costcutter.co.uk | 0.1552 | 0.0911 | 0.0641 | 70.36% |
| farmfoods.co.uk | 0.0449 | 0.0129 | 0.032 | 248.06% |
| spar.co.uk | 0.721 | 0.6893 | 0.0317 | 4.60% |
| heronfoods.com | 0.2899 | 0.2639 | 0.026 | 9.85% |
| safeway.co.uk | 0.2165 | 0.2031 | 0.0134 | 6.60% |
| carrefour.com | 0.0884 | 0.1138 | -0.0254 | -22.32% |
| nisalocally.co.uk | 0.0518 | 0.116 | -0.0642 | -55.34% |
| premier-stores.co.uk | 0.6449 | 0.8688 | -0.2239 | -25.77% |
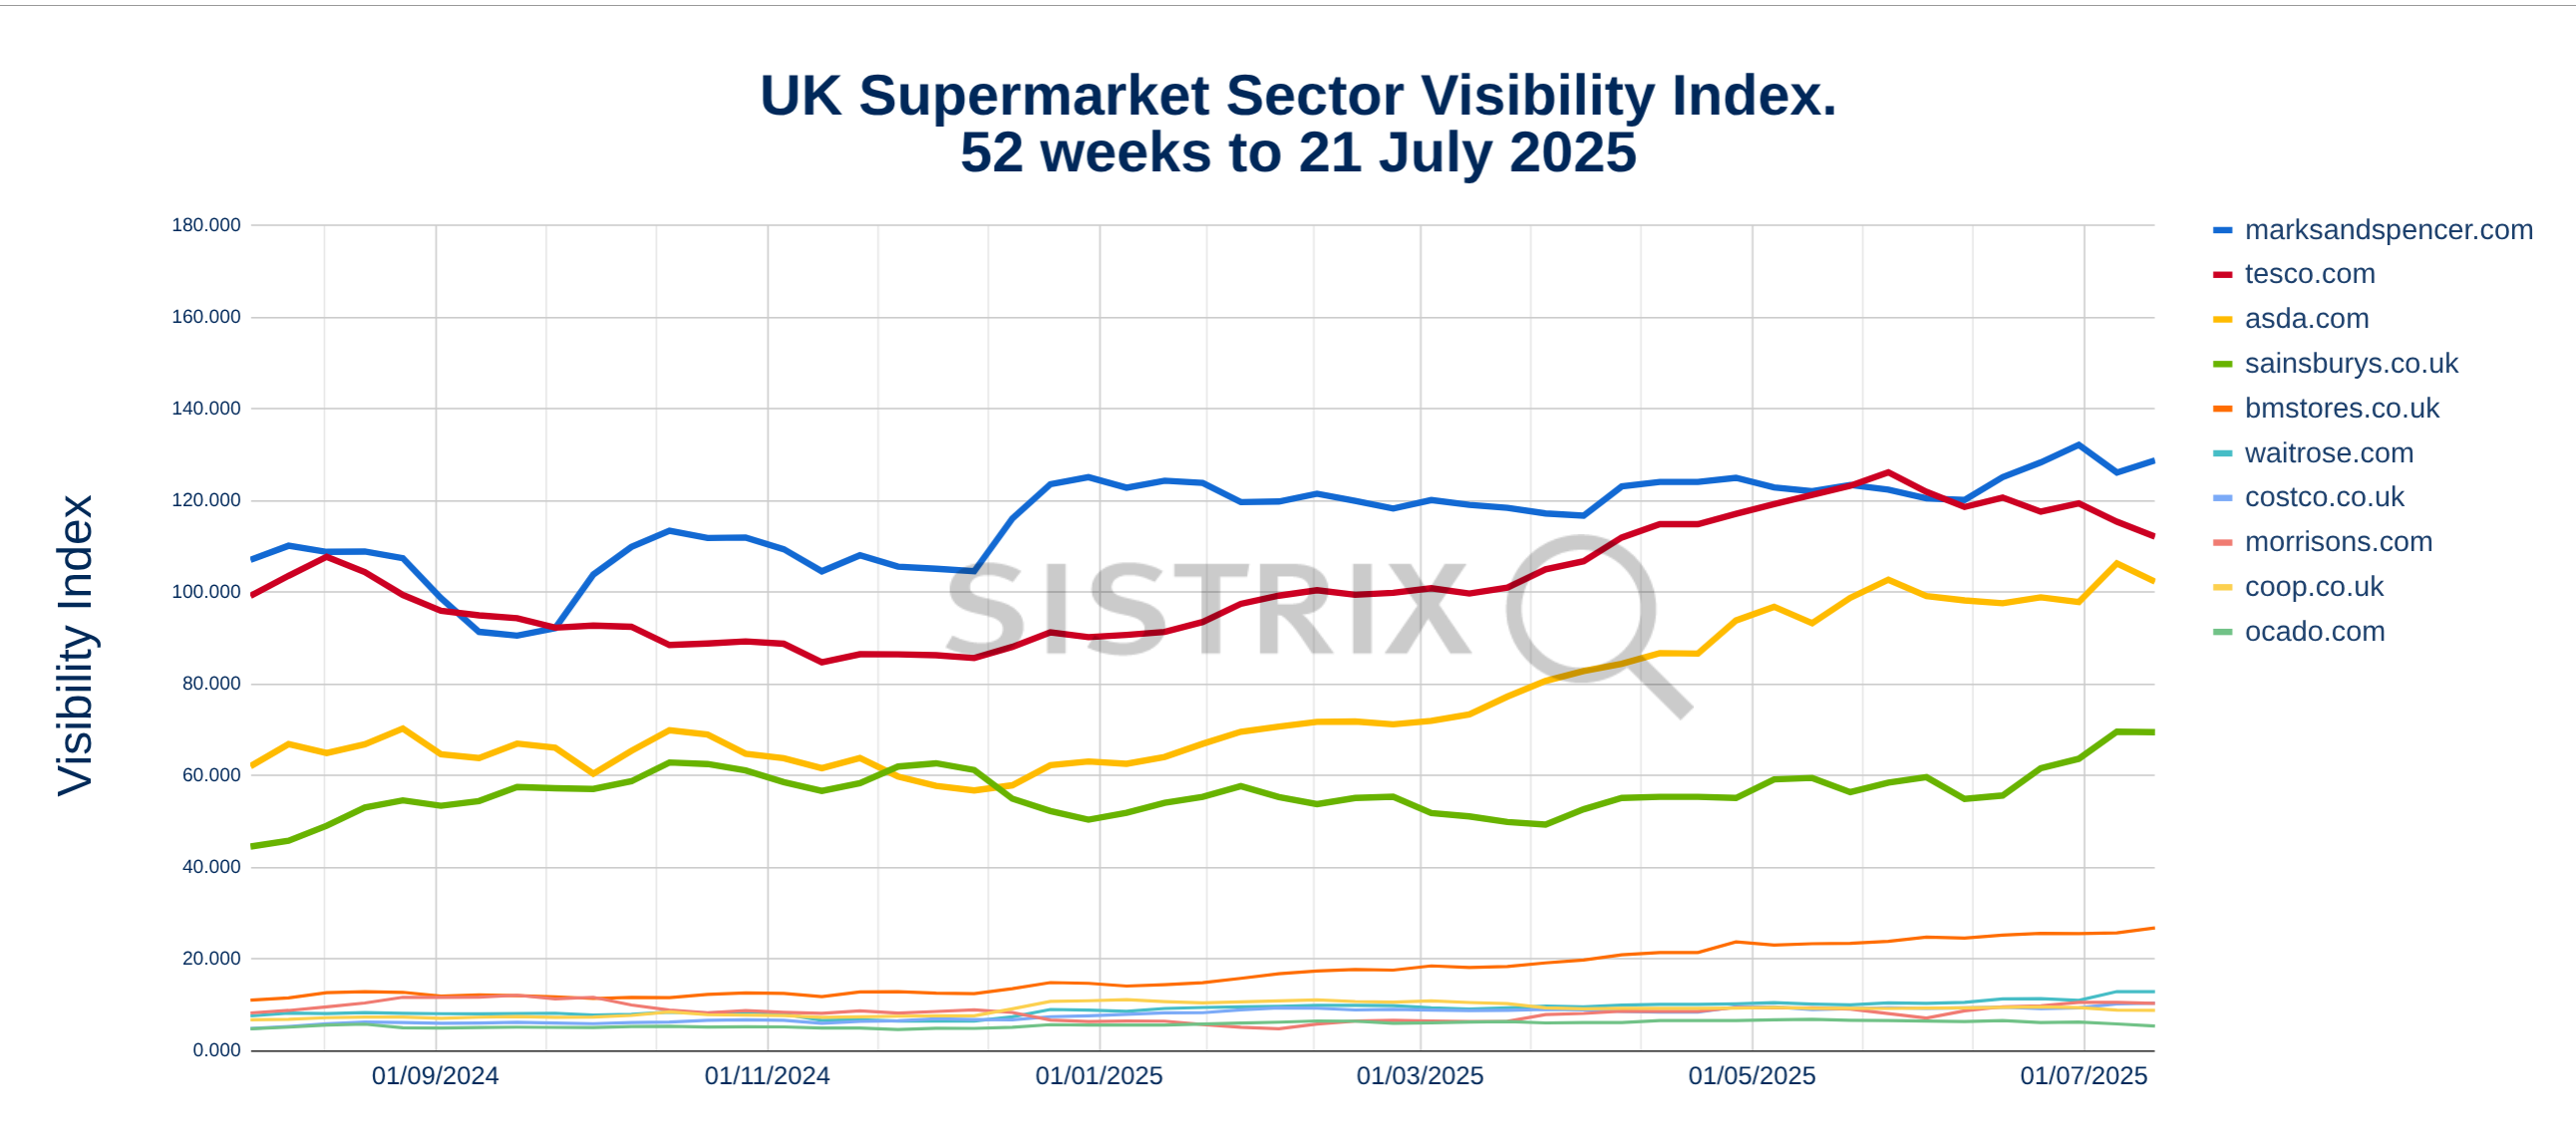
In both the domain table, and the graph, you can see Marks and Spencer leading.
One might question the inclusion of BM Stores and some of the local and convenience stores that generally don’t have online sales but by leaving it out you would be missing the important overlap in keyword rankings for food and household goods.
One might also question why Amazon are not included. They are indeed the elephant in the room that is exposed when we take approach this from a different angle. You’ll also see why M&S isn’t as big in retail grocery as you think.
Desire-led analysis
An alternative method of checking competition is to take the user view. By taking search terms used by the users in different types of journeys (intents) one sees a better-defined and more accurate representation of the digital high street.
In a previous SectorWatch, our regular dive into eCommerce sectors, we covered the retail price index and the ‘basket of goods’ used to calculate it. These keywords were modified and analysed to produce a list of domains leading in the share of search results. We have updated this Online Grocery Analysis below. 75 results are included below but a full analysis using SISTRIX keyword lists can lead to hundreds of competitors.
User intent 1: The generic RPI basket
A curated keyword list of keywords based on the UK Retail Price Index list of products shows the following top 20 domains in search visibility.
| Domain | Project Visibility Index |
|---|---|
| wikipedia.org | 932.43 |
| tesco.com | 809.66 |
| bbcgoodfood.com | 577.9 |
| sainsburys.co.uk | 364.32 |
| asda.com | 307.06 |
| bbc.co.uk | 278.19 |
| amazon.co.uk | 227.14 |
| healthline.com | 172.05 |
| recipetineats.com | 132.68 |
| allrecipes.com | 127.86 |
| rhs.org.uk | 123.59 |
| loveandlemons.com | 92.01 |
| waitrose.com | 91.51 |
| iceland.co.uk | 82.2 |
| simplyrecipes.com | 73.53 |
| webmd.com | 72.72 |
| medicalnewstoday.com | 69.04 |
| marksandspencer.com | 57.49 |
| riverford.co.uk | 56.07 |
The elephants are in the building! Big information providers compete too but there’s one type of information provider missing – the manufacturer.
There’s no evidence of Nestle, Unilever, Danone, Kellogs or any other food brand in the top 25.
User intent 2: The online shopping search intent
By modifying the RPI product search to include the common search modifier “online”, we move towards a different searcher intent. Here are the top 20 domains.
| Domain | Project Visibility Index |
|---|---|
| amazon.co.uk | 218.76 |
| tesco.com | 196.01 |
| onlinefruitandveg.com | 152.95 |
| morrisons.com | 141.03 |
| asda.com | 129.85 |
| sainsburys.co.uk | 83.15 |
| iceland.co.uk | 79.12 |
| buywholefoodsonline.co.uk | 73.47 |
| jjfoodservice.com | 68.6 |
| georgeperry.co.uk | 68.46 |
| themeatman.co.uk | 64.79 |
| donaldrussell.com | 55.88 |
| realfoods.co.uk | 55.26 |
| waitrose.com | 50.55 |
| europafoodxb.com | 48.83 |
| ericlyons.co.uk | 44.21 |
| finefoodspecialist.co.uk | 42.84 |
| riverford.co.uk | 38.77 |
| bettys.co.uk | 37.4 |
| owtons.com | 35.99 |
The supermarket’ domains we listed above are few and far between in this list of specialists.
User intent 3: The groceries delivery basket
Here are the top 20 domains for users searching for groceries delivery. For this list we harvested related keywords for groceries delivery – 2144 keywords.
| Domain | Project Visibility Index |
|---|---|
| sainsburys.co.uk | 692.54 |
| tesco.com | 648.56 |
| asda.com | 364.32 |
| ocado.com | 353.33 |
| morrisons.com | 348.81 |
| chopchopapp.co.uk | 343.25 |
| coop.co.uk | 279.76 |
| deliveroo.co.uk | 169.7 |
| waitrose.com | 162.77 |
| beelivery.com | 130.86 |
| just-eat.co.uk | 129.27 |
| ubereats.com | 115.66 |
| iceland.co.uk | 102.49 |
| amazon.co.uk | 97.38 |
| reddit.com | 89.94 |
| aldi.co.uk | 65.53 |
| snappyshopper.co.uk | 58.49 |
| moneysavingexpert.com | 55.34 |
| lidl.co.uk | 51.52 |
| foodhub.co.uk | 48.6 |
As we focus the intent, the domain landscape changes with it. The top 5 positions are unsurprising but there are interesting elements here that show a local intent, instant delivery intent and informational intent.
What do people in the UK really want delivered?
We used the top domains from above and harvested thousands of “delivery” keywords. After curating the list to brands and products, here are the top 20 delivery desires in the UK for September 2024.
| Keyword | Search-Volume |
|---|---|
| tesco delivery | 104000 |
| asda delivery | 103000 |
| morrisons delivery | 41500 |
| nandos delivery | 36500 |
| sainsburys delivery | 33300 |
| cake delivery | 8800 |
| breakfast delivery near me | 8250 |
| milk delivery near me | 5850 |
| starbucks delivery | 5450 |
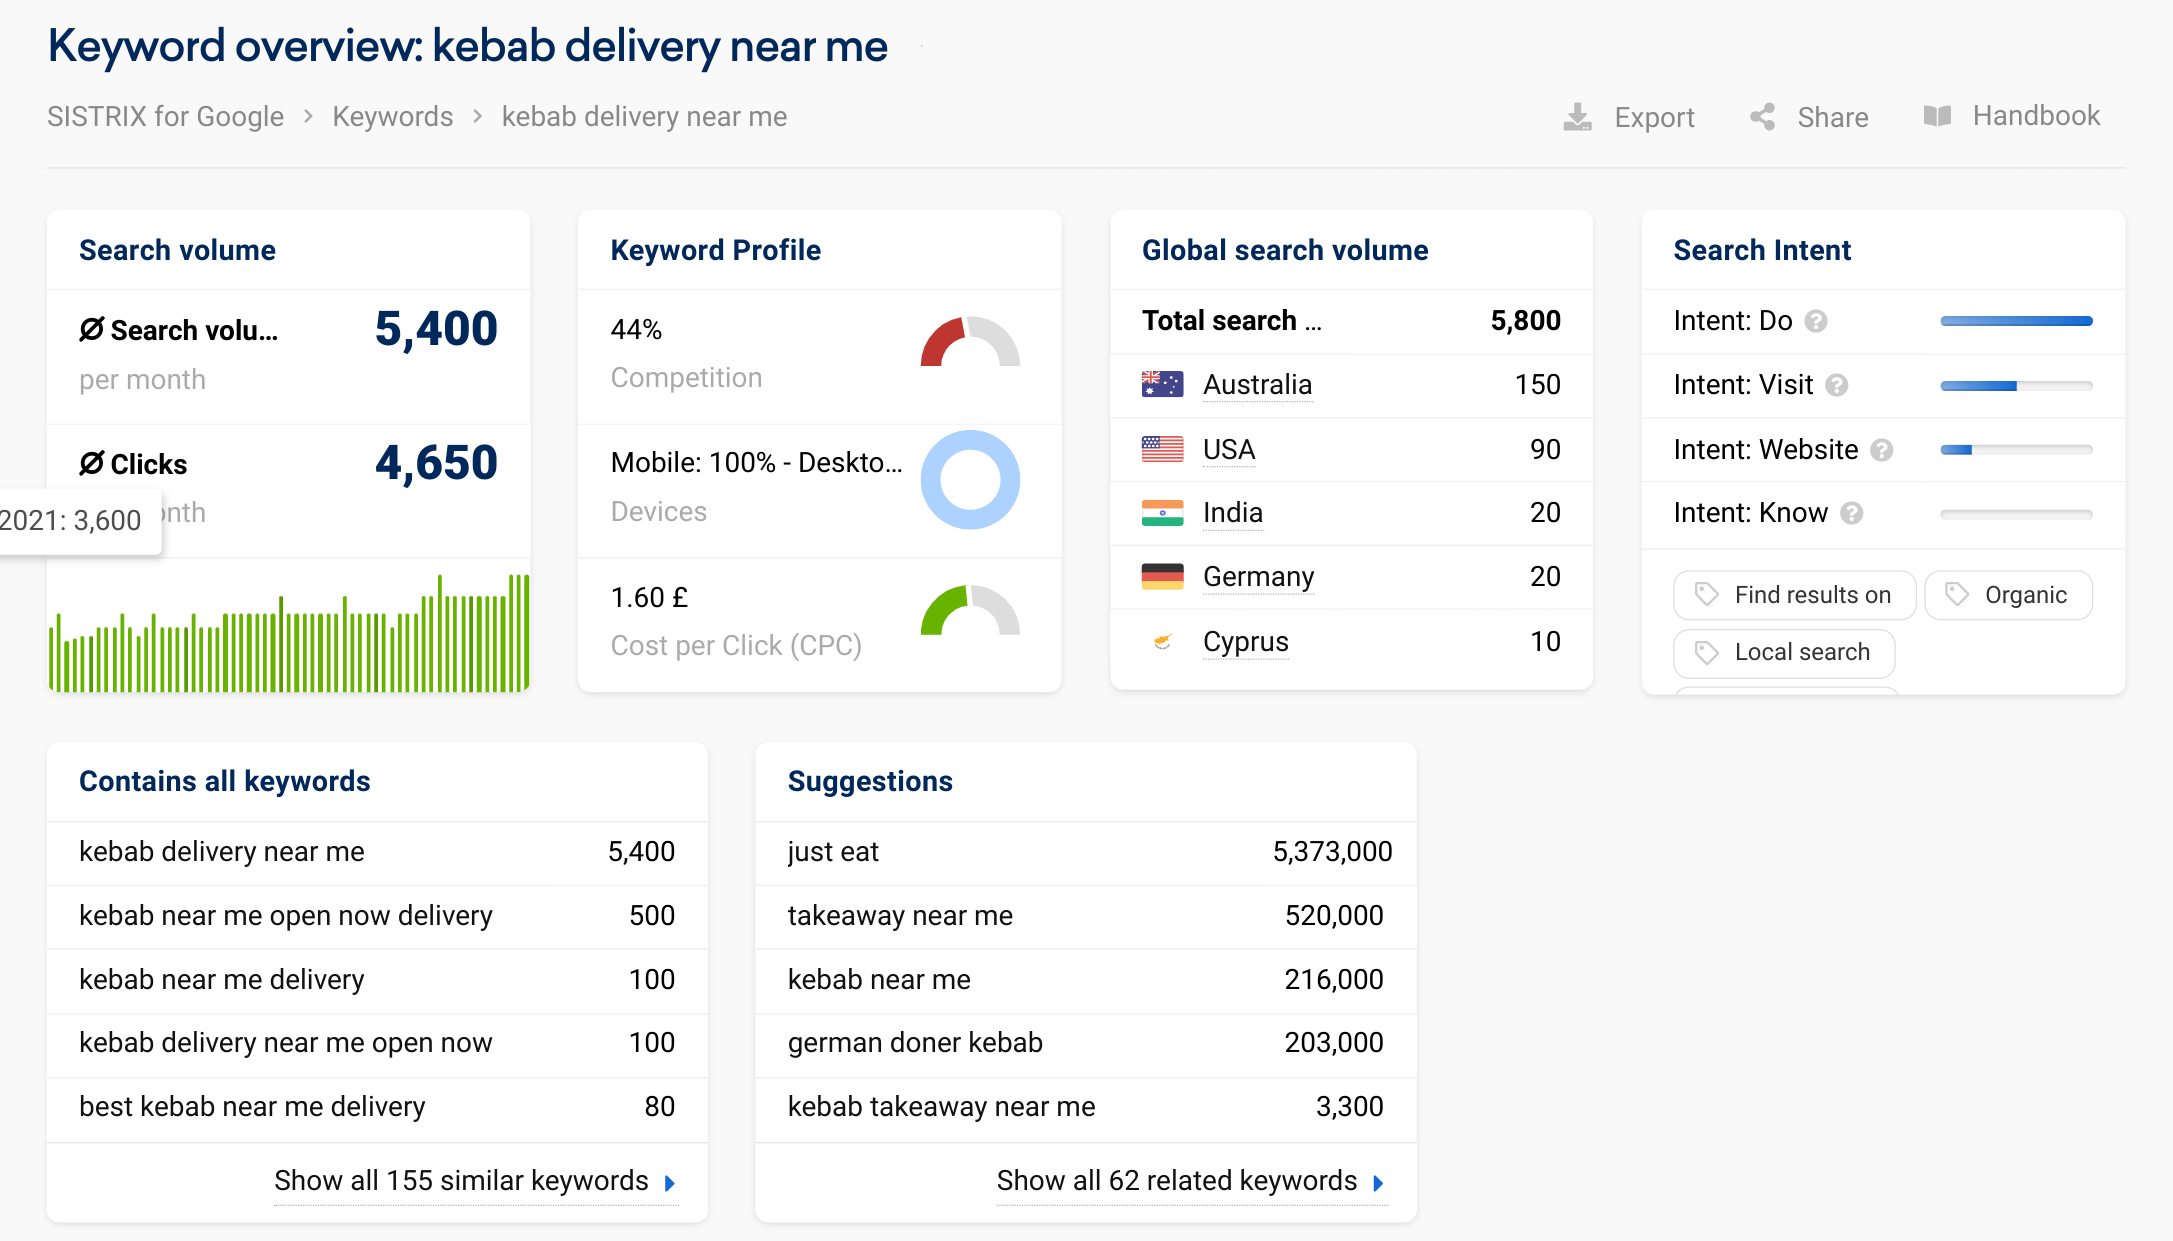
| kebab delivery near me | 5400 |
| iceland online delivery | 5350 |
| next day flower delivery | 4200 |
| alcohol delivery | 4150 |
| uber delivery | 4050 |
| pizza express delivery | 4050 |
| aldi home delivery | 3550 |
| fish and chips delivery | 3300 |
| one delivery | 3200 |
| chinese near me delivery | 3050 |
| wine delivery | 3000 |
The rising star in that list? Kebab delivery.
Your take-away
Measuring competition using the Visibility Index is a critical part of digital marketing that exposes the true competitors for content projects in the important Google Search channel.
These highly visible competitors will expose keywords, content strategies and brands that you can learn from.
Despite the advantages of the customer-and-keyword-first approach it appears that sector analyses by research and media companies remain largely biased towards real-world shops – a flawed approach.
SectorWatch is a regular monthly report focusing on a single sector. It uses the customer-first approach with keyword buckets to expose leading content and domains. You can see all SectorWatch reports here.
Search volume history for delivery
Thanks to the search history data available in SISTRIX Lists we are able to calculate the search volume history for the basket of “delivery” keywords used above.
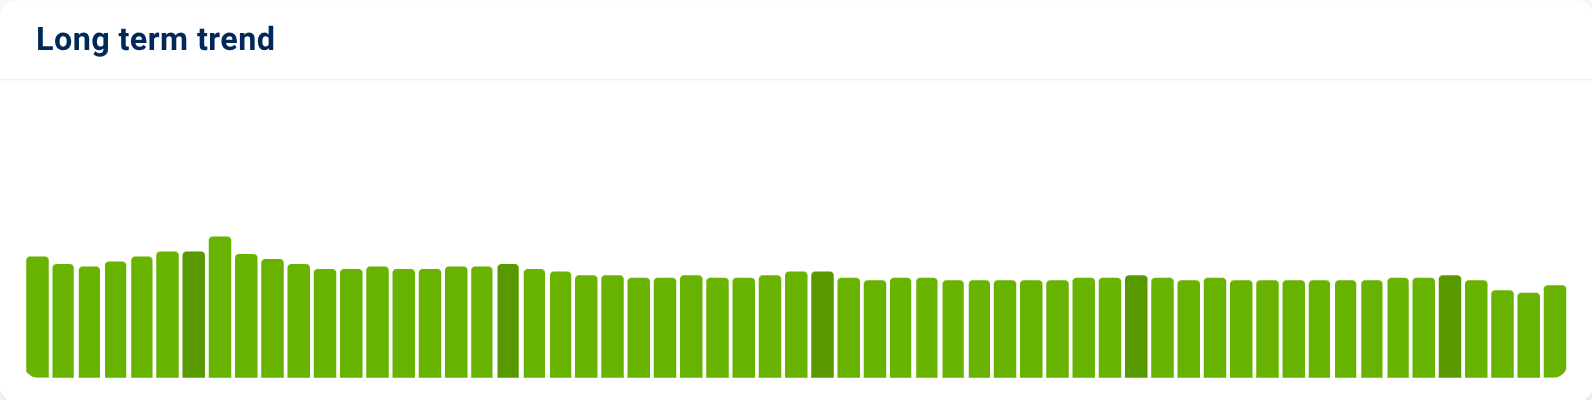
More information about keyword search volume history in SISTRIX is available.
Test SISTRIX for Free
- Free 14-day test account
- Non-binding. No termination necessary
- Personalised on-boarding with experts