
Both Google and the supermarket face the problem of selecting the perfect supply for their limited space. While the usual procedure for a supermarket is well known and part of the business administration basics, all we seem to have, when it comes to Google, is guesswork and puzzlement. In light of this, it is a great idea to look at the selection choices a supermarket has to make. Maybe in doing so, we can learn quite a bit about how Google chooses their results.
- Why won't Google simply show more than 10 results?
- Math problem: Optimise the supermarket shelf-space
- Solution to the math problem
- How can we translate the shelf space optimization to Google?
- Google cannot rate every result for every search request
- Link signals are extremely important, but also have limits
- There are only few signals available for individual pages
- Google rates the quality of the entire domain
- Google will also evaluate the user behaviour
- What data does Google use to evaluate the user behaviour?
- The limits of CTR data
- How will Google evaluate the CTR data for the entire domain?
- The Visibility for a domain will move in trends
- What does that mean in real life?
- 9 tips for optimising the constraint-claim in real life
What are the two things that a search result page on Google and a supermarket shelf have in common?
- They serve a specific purpose.
- They only have limited space available (constraint)

In both cases, the constraint is the limiting factor for the performance of the entire system. The supermarket might make more money with more shelf space, as it could offer a larger variety of products and satisfy more shopping needs. Likewise, Google might satisfy more search request with more than 10 organic results on the first search result page (Searcher Satisfaction).
Note: It is abundantly obvious that Google has the main goal of maximising profits. What we will look at in this article are the free, organic results on the search engine result pages. For the sake of simplicity, we will consider the organic result as part of Googles user-satisfaction goal, while the AdWords advertisements have the goal of maximising profits. In our article, we will not look at the potential interactions between the organic results and AdWords.
Why won’t Google simply show more than 10 results?
At a first glance, it seems that the simplest option to increase the satisfaction of their users would be for Google to show more than 10 organic results per search engine result page (SERP). Google asked their users what they thought about this idea and actually got the answer that users wanted more results. More is more, after all.
According to their former vice president, Marissa Mayer, Google then conducted a test with 30 results per SERP. The version with 30 results showed a decrease in traffic and profits by 20%, compared to the version with 10 results. How is that possible?
Google needs 0.4 seconds to create and deliver a SERP with 10 results. The page with 30 results, on the other hand, took 0.9 seconds to load. This difference of 0.5 seconds destroyed the user satisfaction and lead to a new constraint that cost them 20% of the traffic. To this day, Google will only show 10 organic results, thanks to this experiment.
The supermarket has essentially the same problem. In theory, they could simply put up more shelves. But such a measure would narrow the aisles for the customers and have a strong negative effect on the entire shopping experience. This means that the supply in a supermarket is therefore also limited to a specific amount of floor-space.
Math problem: Optimise the supermarket shelf-space
Now that we identified the constraint, we can look at a simple example. Let’s assume we have a specific shelf in a supermarket for newspapers and magazines. The shelf is made up of 10 rows which we can be use for the merchandise. The supermarket manager has the following data at his disposal.
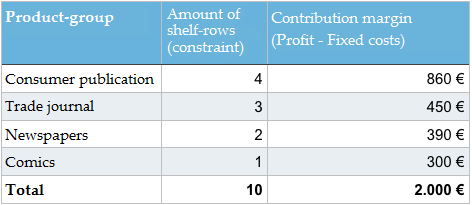
Note: I would ask our kind readers to please forgive me using the economist terminology “contribution margin” instead of the colloquial term “profit.” I simply can’t help myself. Explanation: Profit = contribution margin – fixed cost (rent, personnel costs etc.).
How should the supermarket manager adjust the assortment of newspapers and magazines in order to maximise the contribution margin? Should there be a change to the available merchandise? Do you know how to arrive at the correct solution?
Solution to the math problem
The solution is very simple, if you have internalised the basics of constraint-optimisation. The entire system needs to be adjusted in order to best utilise the constraint, in this case the available shelf space.
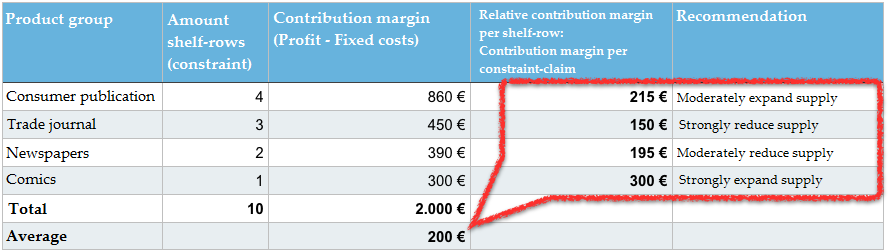
Our crucial indicator here is not the contribution margin per product-group from table 1 (consumer publications, trade journals, etc.). In order to optimise the shelf, we need a contribution margin per constraint (relative contribution margin per shelf-row). We therefore do not ask for the specific total contribution margin of all product-groups in total, but want to know how much of a contribution margin we managed to generate from the shelf-space in use. For this, we divide the contribution margin per product-group by the number of occupied rows on the shelf and get the relative contribution margin. We all know this principle from our online marketing evaluations, when we work with indicators like the Click-Through-Rate (CTR) and consider a number of clicks in relation to the constraint-claim (impression).
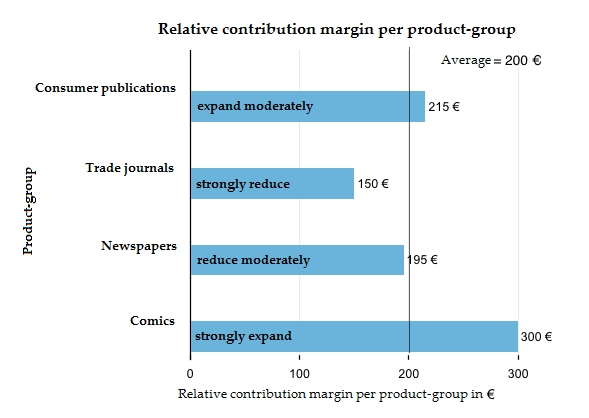
On average, 10 shelf rows will generate a contribute margin of 200€ (2.000 € CM : 10 rows). The trade journals only manage to generate 150 EUR per shelf row. This makes them the most uneconomic product-group. While they may be the product-group with the second largest overall contribution margin, aside from the consumer publications with 450 EUR, they also take up three entire rows and thereby 30% of our constraint. All the while, they only generate 22,5 percent of the contribution margin. We could surely use part of this shelf space more efficiently.
The comics only generate an overall contribution margin of 300 EUR, but they also occupy just one row on the shelf. Due to this, they are the most economical product-group with a relative contribution margin of 300 EUR.
We can now easily figure out what to optimise. We should reduce all the product-groups with a below average relative contribution margin (< 200 EUR) and instead fill their spaces with those product-groups that managed an above average relative contribution margin (> 200 EUR).
In our example, the supermarket manager should use less shelf space for trade magazines and newspapers and experiment with using the free space for comics and consumer publications. It might also be profitable to introduce an entirely new product-group, such as paperbacks, for example. The long-term goal is an increase in the average contribution margin per shelf-row.
There is no exact solution to this problem, as the marginal benefit of the product-groups is unknown. The manager does not know whether to increase the comics by 10, 50, or 100 percent. He only knows the direction of the change. He has no other choice than to iteratively test his way to the optimal solution. Once he has changed the available product-groups and their relative shelf-space, a new round of tests with new data begins.
In real life these decision processes are obviously much more complex, as a lot more information, data, and options are available. We deliberately decided to keep this example simple.
How can we translate the shelf space optimization to Google?
The principle of constraint-optimisation, also called Theory of Constraints is a well-known, practical and successful economic method. It is not only used by retailers to figure out how to best utilise their available sales areas, but throughout all business administration roles (production, marketing, supply-chain-management, finance, controlling, project management etc.).

The image of the funnel model serves as an illustration of the main theorem of the Theory-of-Constraints: “In every value chain there is exactly one system that determines the performance of the whole – a distinct constraint”.
It would not be very surprising if Google decided to not entirely reinvent the wheel and apply this basic principle to the way they choose their search results. There are a number of things in favour of this theory. Before we can take the time to think more deeply on this, we actually have to take a detour and look at some additional information on how Google’s search and rankings work.
Google cannot rate every result for every search request
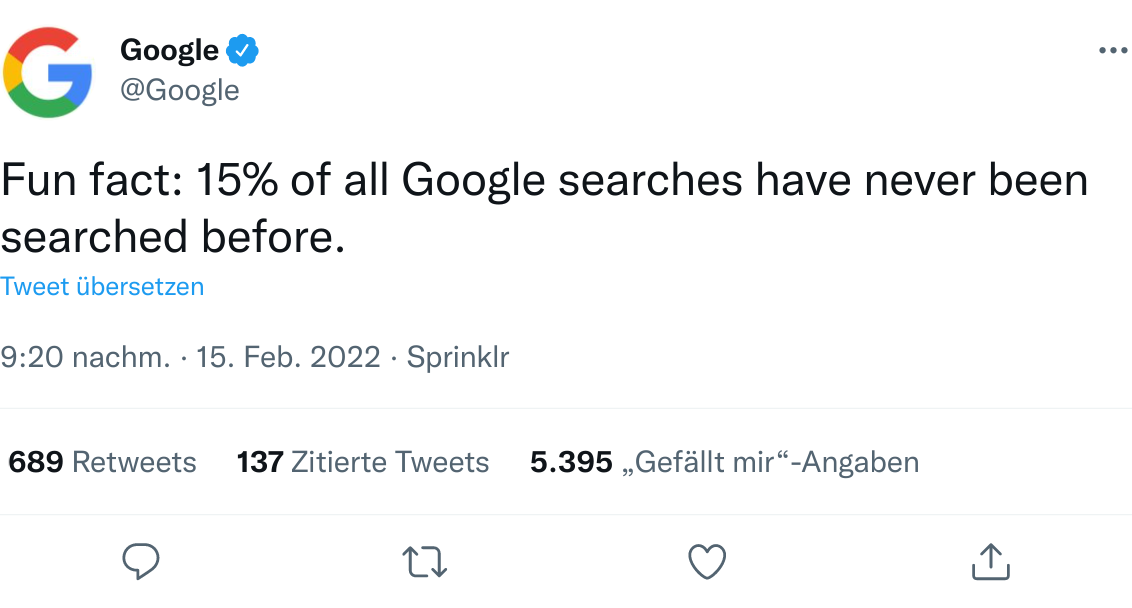
Google confirmed again in 2022 that roughly 15 percent of all daily search requests are new and have never been asked of Google before.
With between 4 and 8 billion searches made per day (2022, multiple sources), that’s a lot of unknown searches. For these requests, Google simply has no historic data on which results users rated most helpful and which best serve the purpose of their user’s Searcher Satisfaction (the goal of satisfying the user).
We can only guess how many of Googles searchrequests have been asked so few times that Google does not have a large and current enough data-pool for the purpose of assessing individual results. I would not be surprised if this number turned out to be somewhere between 30 to 60 percent of all search queries.
Even though Google can determine whether a result may be relevant for a specific search query using an OnPage analysis, what they cannot judge is whether the result will actually satisfy the user. Due to this, Google is forced to evaluate other signals, in order to come up with a good prediction of the result’s quality.
Link signals are extremely important, but also have limits
Once they have figured out all the documents which could be considered relevant for a specific search query, they will next use Google’s fundamental principle, the PageRank-algorithm. This is a procedure for assessing a number of linked documents by the structure of their links. Every SEO knows how important links still are for Google’s ranking.
The PageRank algorithm essentially works extremely well and has made Google the search-engine market leader in a short period of time. Though even this concept has its limits.
There are only few signals available for individual pages
Google knows more than 60 trillion individual pages. The large majority of these documents (URLs) on the World Wide Web do not have any links from external websites to them. A domain like eBay.de currently has more than 30 million different URLs within Google’s index. It is extremely likely that only a fraction of these URLs will have external links, especially considering that many URLs will become obsolete after an auction is over. The same also holds true for most other websites.
In order to receive link data for every individual URL, Google has to employ a large scale effort to also take the internal links of a domain into account. The problem is that the links are only trustworthy to a certain degree, as these internal links are entirely controlled by the website operators.
At the same time, we can make the case that external links are also only trustworthy to a certain degree, as they, too, have been manipulated through paid links over the years.
Google rates the quality of the entire domain
Google is able to mitigate some of the problem of having insufficient data for individual URLs by figuring out the quality of the corresponding domain. Using the sum of all signals for the domain, including all URLs, gives Google much more resilient data when evaluating a specific source.
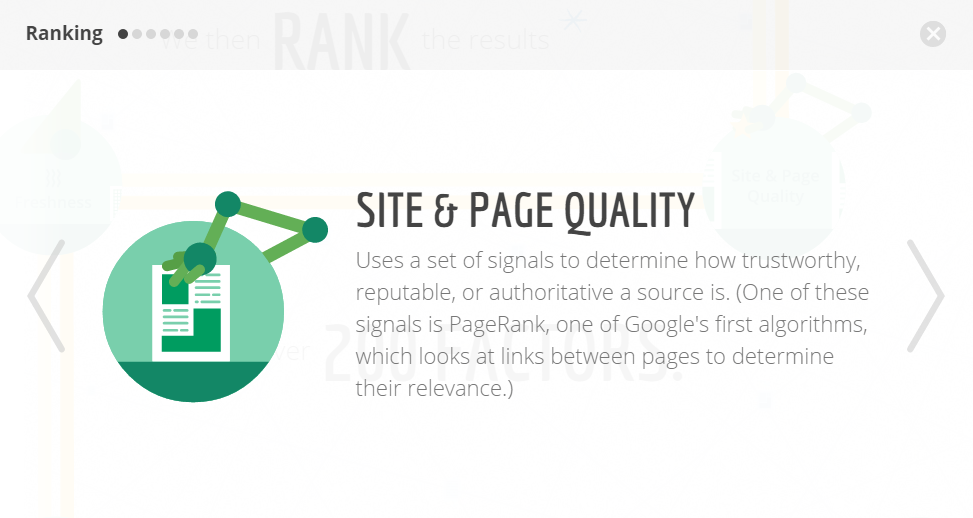
It is only logical that Google speaks of “(web)site and page quality” when explaining how their ranking works.
In SEO circles, when referring to Google’s rating of an entire domain, we speak of Domain Trust or Domain Authority (evaluating the domain for a specific topic, such as “health” or “sports”).
Our supermarket manager from before essentially has similar problems. When it comes time to decide on the assortment of products, it is simply impossible to test and evaluate each individual magazine and issue. And then there is the fact that, even from one issue to the next, there may be a change in quality within the same product. Our supermarket manager has to rely on a simplification of these complex structures, by combining individual issues into product-groups, like consumer publications and trade journals. These product-groups can then be analysed and their performance can be compare to each other.
Google will also evaluate the user behaviour
It is pretty much taken as fact, within SEO circles, that Google does not only evaluate links, but will also go one step further and take a look at the user behaviour. Using the link data, it is possible to get a first set of results, which are as trustworthy and relevant as possible, for the Top 10.
Google will arrive at much better searchresults if they also analyse the way the users interact with these results, which may then cause them to rearrange the search results.
It would neither be logical nor expedient to permanently keep a result on the first position, if users consistently prefer the results on position 2 to 10. It would be equally illogical to permanently keep a result in the Top 10 if the users rarely ever interacted with it. Not to mention that, when it comes to current events and so-called Hot Topics, links that grew historically over the years are of no use, at all. When the rankings are rearranged we speak of a reranking, for which Google has actually filed a series of patent specifications, where you will find more details on Google’s ideas, if you are interested.
User-signals can take things like content-quality, website-usability and user-preferences (for example for brands) into consideration. Any time there is any doubt, you can be sure that the user’s “vote” can be considered to more valuable that simply trusting in link data. Still, the link data is important for the site to actually be one of the choices, when it comes to a vote.
What data does Google use to evaluate the user behaviour?
It is not known which user-behaviour data Google will specifically evaluate for the ranking, or reranking. Neither do we know the exact definition of how Google defines Searcher Satisfaction and how they will rate individual results based on the user behaviour. It is conceivable that they use metrics such as the CTR, clickstream-data, time-on-site and return-to-SERP-rate, just to name a few. Where all these metrics would originate from the CTR.
Another possible source of data for the evaluation could be Google’s Chrome browser, which holds data for practically any domain. Less likely is the use of Google Analytics data, for one, as the Analytics data would only be available for domains using Google Analytics, which are only about 10 percent of all websites, according to data from buildwith.com. This percentage might actually be larger for big and well known websites.
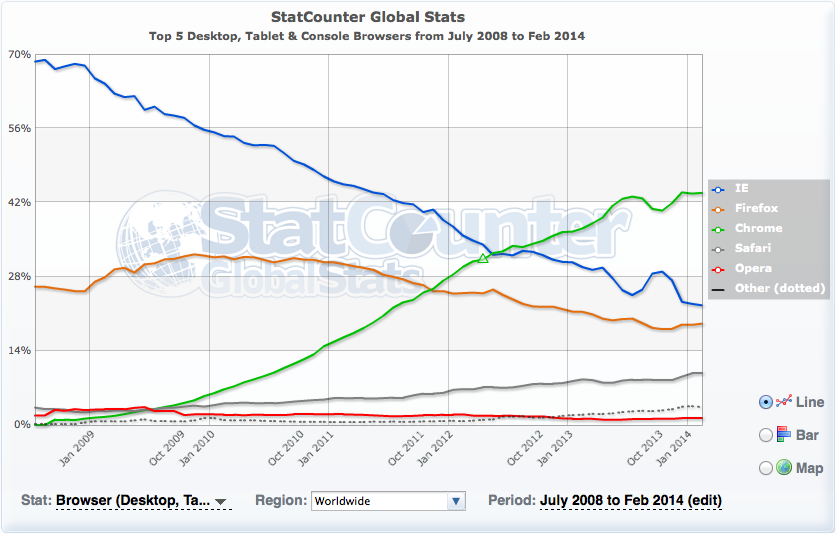
On the other hand, using the Analytics data would put Google in a credibility bind, as they have always publicly stated that they do not use Analytics data for the rankings. The Chrome browser currently has a world-wide market-share of more than 60 percent, according to StatCounter data. This should enable Google to get usage data for practically all websites in the world. When it comes to deciding on a source of data, Chrome would be the much more useful alternative than Analytics.
Additionally, Google obviously has direct access to the data from Google Search. We can be absolutely sure that this data is being both tracked and evaluated, because Google will show you the CTR for individual searchqueries and URLs within the Google Search Console.
Let’s look at an example, where we will say that Google rates the “amount of satisfaction” through the CTR, for the sake of simplicity. In reality, this evaluation will surely be much more complex and well thought-out.
In our simplified example, the CTT would be the equivalent for the Google-Search, what the relative contribution margin was for our supermarket example. The CTR will alreay take the constraint-claim into account. The value for the number of clicks is considered in relation to the impressions (constraint).
The limits of CTR data
As we noted above, for the majority of websites, there is nearly no data available for individual pages. And this is not only true for linkdata but obviously for the CTR data as well.
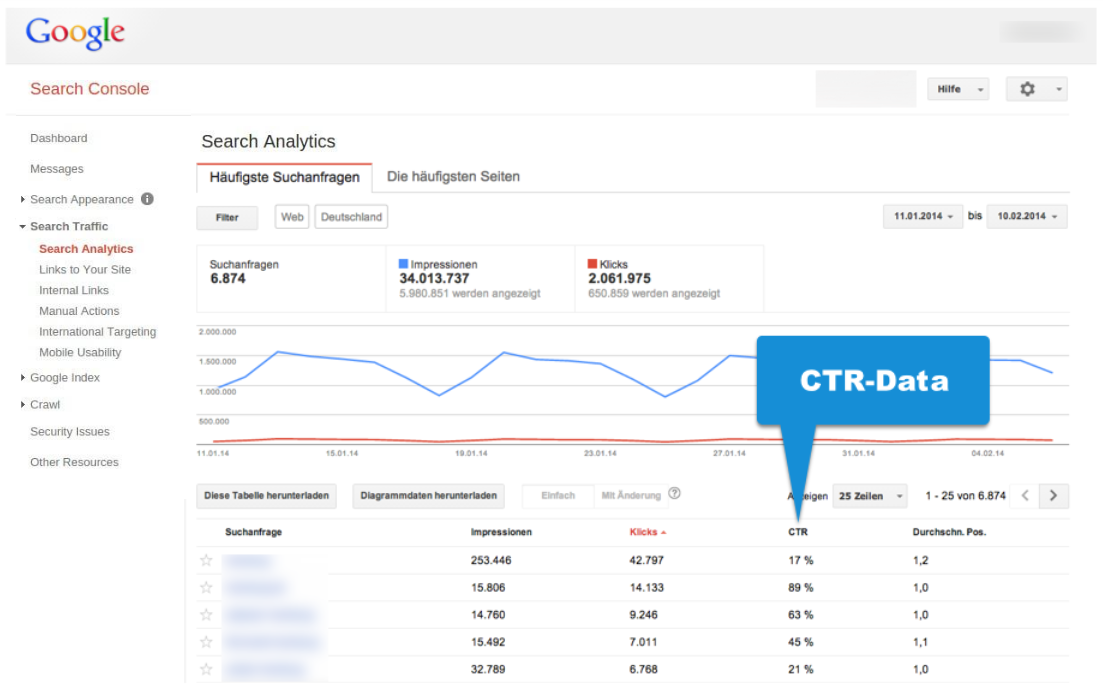
We can nicely see this within the Google Search Console, if we take a look at the CTR-data. We will relatively soon get to a point, where Google will only show “click” values below 10 on the list of keywords and individual URLs.
The data you see in the above example, which came from a big domain I evaluated for this article with more than 34 million SERP-Impressions and more than 2 million clicks per month, shows a value of less than 10 clicks per month for about 50 percent of searchqueries. We do have to keep in mind that Google will only show us the most popular searchrequests. In this case, we were only shown 6 million of the 34 million SERP-impressions, which is about 18 percent. When it comes to the large majority of searchrequests, Google simply does not have reliable data on the results for an individual domain.
All in all, it becomes pretty clear that the CTR-data can only supply information, which is at least somewhat up-to-date, for relatively popular searchqueries, regardless of the exact CTR values. This means that the CTR-data, just like the link-data, will eventually hit a wall for a large number of searchrequests.
How will Google evaluate the CTR data for the entire domain?
It would logically make sense if Google would consider the CTR-data for the entire domain (or rather a much more thought-out but unbeknownst to us definition of “Searcher Satisfaction”). This indicator could then be part of the overarching “Domain Trust” metric.
The underlying idea is quite simple. If the entire domain creates an above average amount of “Searcher Satisfaction”, then it will be possible to keep increasing the Searcher Satisfaction throughout all of Google’s searches by showing relevant results from that domain more prominently for more search requests.
The actual reasons why users may experience results from specific domains as more satisfying than others (from domains with a similar degree of relevancy) could be manifold. Domainname, brand-preferences, loading-time, content-quality, language-style, usability, (non-)pushiness of the advertisements, quality of the snippet optimisation and perceived trustworthiness are only some of the criteria that may play some part and which will be evaluated through the user’s conscious or unconscious interactions with the results.
If we follow this train of thought, then it would be within the spirit of the theory-of-constraints to allow those domains with an above-average CTR more visibility (SERP-impressions) within the SERPs. Vice versa, the SERP-impressions for a domain with a below-average amount of CTR-data would be reduced until they arrive at an average amount.
This strategy would be suitable to increase the Searcher Satisfaction in general, just as the supermarket manager from our example can increase the contribution margin for his shelf by increasing the amount of above-average economic product-groups.
The Visibility for a domain will move in trends
The Visibility of a domain will not generally go in a straight line, but is subject to constant ups and downs. This will cause the Visibility Index to show a series of distinct peaks and valleys, whose direction will define the trend. We will talk about an upwards trend if we can see a number of successively higher peaks and valleys. Conversely, we will speak of a downward trend if we see a series of successively lower peaks and valleys. If we get a series of peaks and valleys of approximately the same height, we speak of a sideways trend.
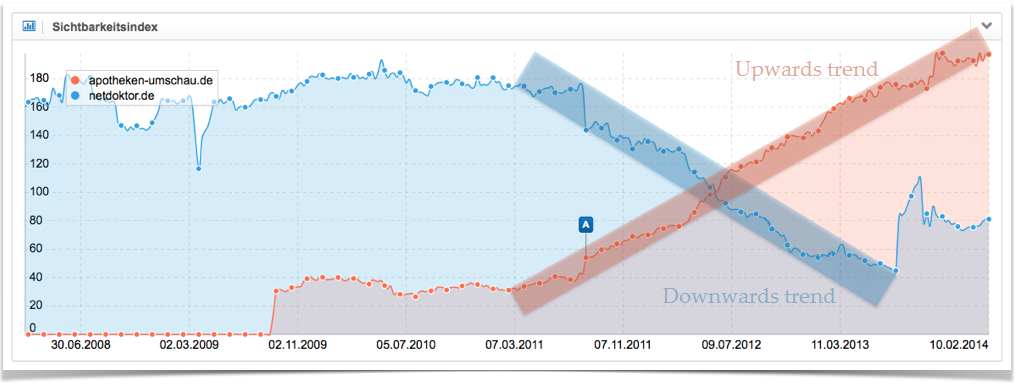
The following graph shows two very distinct trends for two German websites, which last for a long period of time. In red we have the upwards trend for the domain apotheken-umschau.de and the downwards trend for netdoktor.de in blue.
The “shelf space optimisation” model, which we introduced, would be well suited to explain these trends. A domain with above-average values for Searcher Satisfaction will get more and more Visibility, one step at a time. It is allowed to utilize the constraint “SERP-impressions” more strongly. This will keep going until the domain’s impressions in the search results become less and less and the domains ends up with average Searcher Satisfaction values.
If a domain generates below-average numbers, it will lose Visibility and may only utilize the constraint to a lesser extend.
Additionally, there are, of course, other factors which will leave their mark on the domain’s Visibility: link-development, content-creation, progressive SEO-optimisation, website redesigns, Google updates and many more.
What does that mean in real life?
We have to be very clear, this model of “shelf storage optimisation” for Google is simply a theoretical construct, which is not proven anywhere. Although, in order to understand certain developments better, it is quite helpful to have a functioning model of the workings of Google’s algorithm, in the back of your mind. If you think this is a feasible model, then we get two main levers which we can use in the real world.
- Optimise performance: All successful measures which increase the Searcher Satisfaction for a specific domain will increase the domain’s Visibility through an increase in better rankings.
- Optimise the constraint-claim: Every piece of indexed content with a below-average Searcher Satisfaction will decrease the overall performance of the domain and thereby reduce the future Visibility the domain will have within Google’s search results. This is why you should not even show these bad performing pages to Google (). You should try to only have great performing pages competing for the constraint “impressions”, in order to get a bigger piece of the constraint-claim pie from Google, in the future.
While the performance optimisation sees a constant stream of talks and articles, we nearly never hear anything about optimising for the constraint-claim. Specifically, this means deciding on which pieces of content you let Google index and which you do not. Many experienced SEOs will tell you about their observations that it can be a huge boon to your rankings if you only have truly useful and unique content within the index and deindex pages with less than stellar quality. These observations can also be explained by our “shelf storage optimisation” model.
9 tips for optimising the constraint-claim in real life
Finally, I want to give with 9 tips for optimising the constraint-claim “SERP-impressions”.
- Regularly check the CTR data in the Google Search Console. You should know both the strong- and weak-points of your domain, concerning the CTR.
- Once you know your strengths, create more content of this kind.
- For pages and search queries with a low CTR, consider whether the page is optimised for the proper search-phrase. Your page may have great content, but might be showing up for the wrong search request due to wrong signals. Have a look at the results (title, description, URL) and content of other websites in the top 10 for the keyword and try to figure out if they might have a better answer for the search request. Put yourself in the position of the searcher and try to understand their needs.
- Set those pages with bad CTR data and content without any kind of noteworthy added value to NoIndex, in order to strengthen the rest of your pages.
- It’s even better if you are able to identify entire groups of pages which you can set to NoIndex without having to worry. Please think twice, if you really need all the filter-and sorting-option pages on a shop in the index? On zalando.co.uk, for example, Google is allowed to index the site “Men’s business shoes” and the filtered results “black men’s business shoes”. The pages with filtered content for “black men’s business shoes in leather”, on the other hand, are set to NoIndex, as this trait is not sought after that often and the selectivity to the other two filters would be lost. Is it reasonable for a yellow pages directory to have all 3,500 categories for small village indexed, even when there are less inhabitants than categories? Do pages with outdated content, like expired classified ads, really belong in the index? It can be very useful to have a clear and tangibly logical separator for your indexation strategy, in order to not stress the constraint with low-quality content.
- User-Generated-Content (UGC) is cheap and therefore great, even though quality and added value are usually rather mediocre. This is the reason why forums and Q&A portals create rather negative user signals. Here, you should introduce an efficient system to make sure that only valuable content gets indexed. This selection can either happen through an editorial staff or automatically through a rating-system, for example, where the users can vote on the quality of the content.
- No matter how Google defines the Searcher Satisfaction, the CTR values are likely a part of it. You can increase the CTR through a goal-oriented design of your results (title, description, URL). A result should communicate relevancy, added value and a call to action. And keep the AIDA principle in mind, when designing the meta-description .
- Keep an eye on the number of indexed pages and explore the possible reasons for large changes, so that you may take countermeasures, if necessary.
- Avoid Duplicate Content.