
How much did a product cost in the past? Which sellers sold this product on Amazon? In this section you can find everything you need to understand the price development of a product.
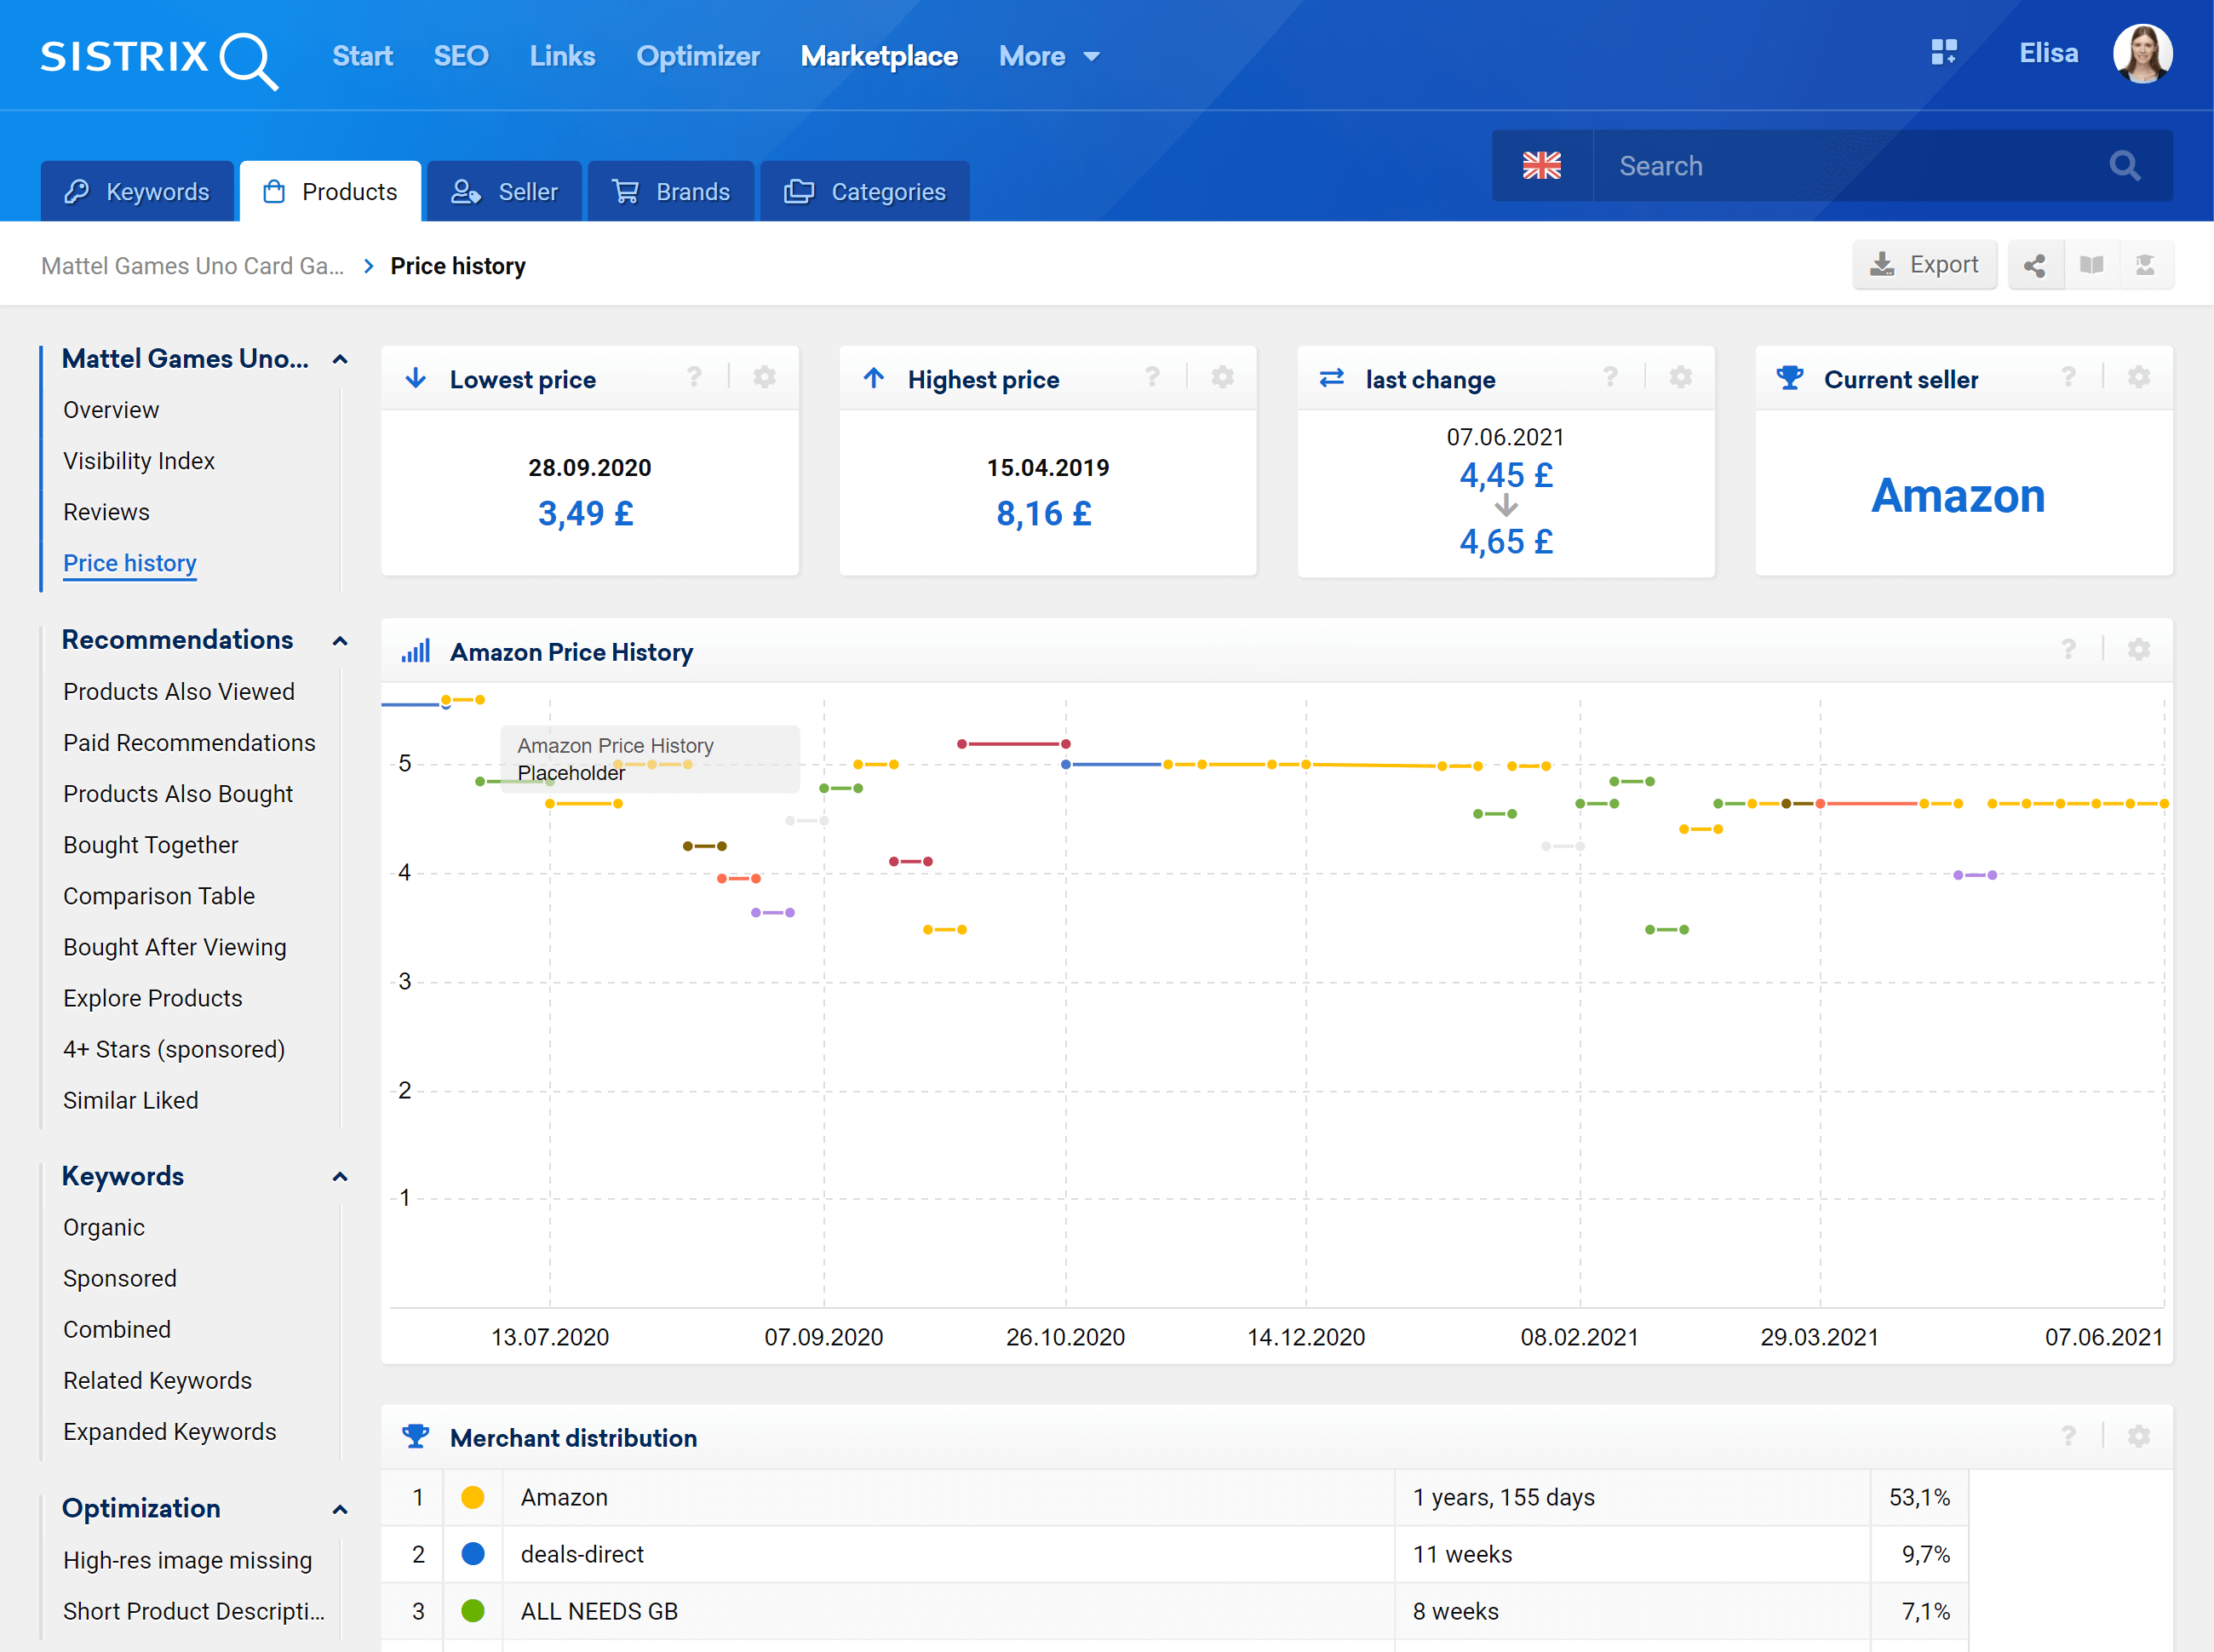
Lowest price
The lowest Buybox price registered for the product.
Highest price
The highest Buybox price registered for the product.
Most recent change
Most recent price change in the Buybox. Since there can be several Buybox-changes every day, this value should only be seen as an indication of how stable the price has been recently.
Current seller
The seller we found in the Buybox when we last checked the product page.
Amazon price history
The graph shows the development of the Buybox-price over the period. This is set to show the last year by default, but if we have older data, the graph can be expanded to include this data. Seller changes in the Buybox are indicated by a colour change and an interruption in the graph.
Seller distribution
This table lists all sellers that we have ever found in the Buybox and creates a percentage distribution over the period of time that these sellers spent in the Buybox.
Last changes
Shows the price changes recognized in the product Buybox, in descending order according to the time of the change. The table shows the following values:
- Date of price change
- Price before the change
- Price after the change
- Actual price change
- Seller
- Link to the seller’s Toolbox overview page