The list function is the perfect tool to collect keywords or products (ASINs) within SISTRIX. After creating a list, we’ll provide up-to-date and helpful additional information directly from our database.
How to Create a List
Method #1

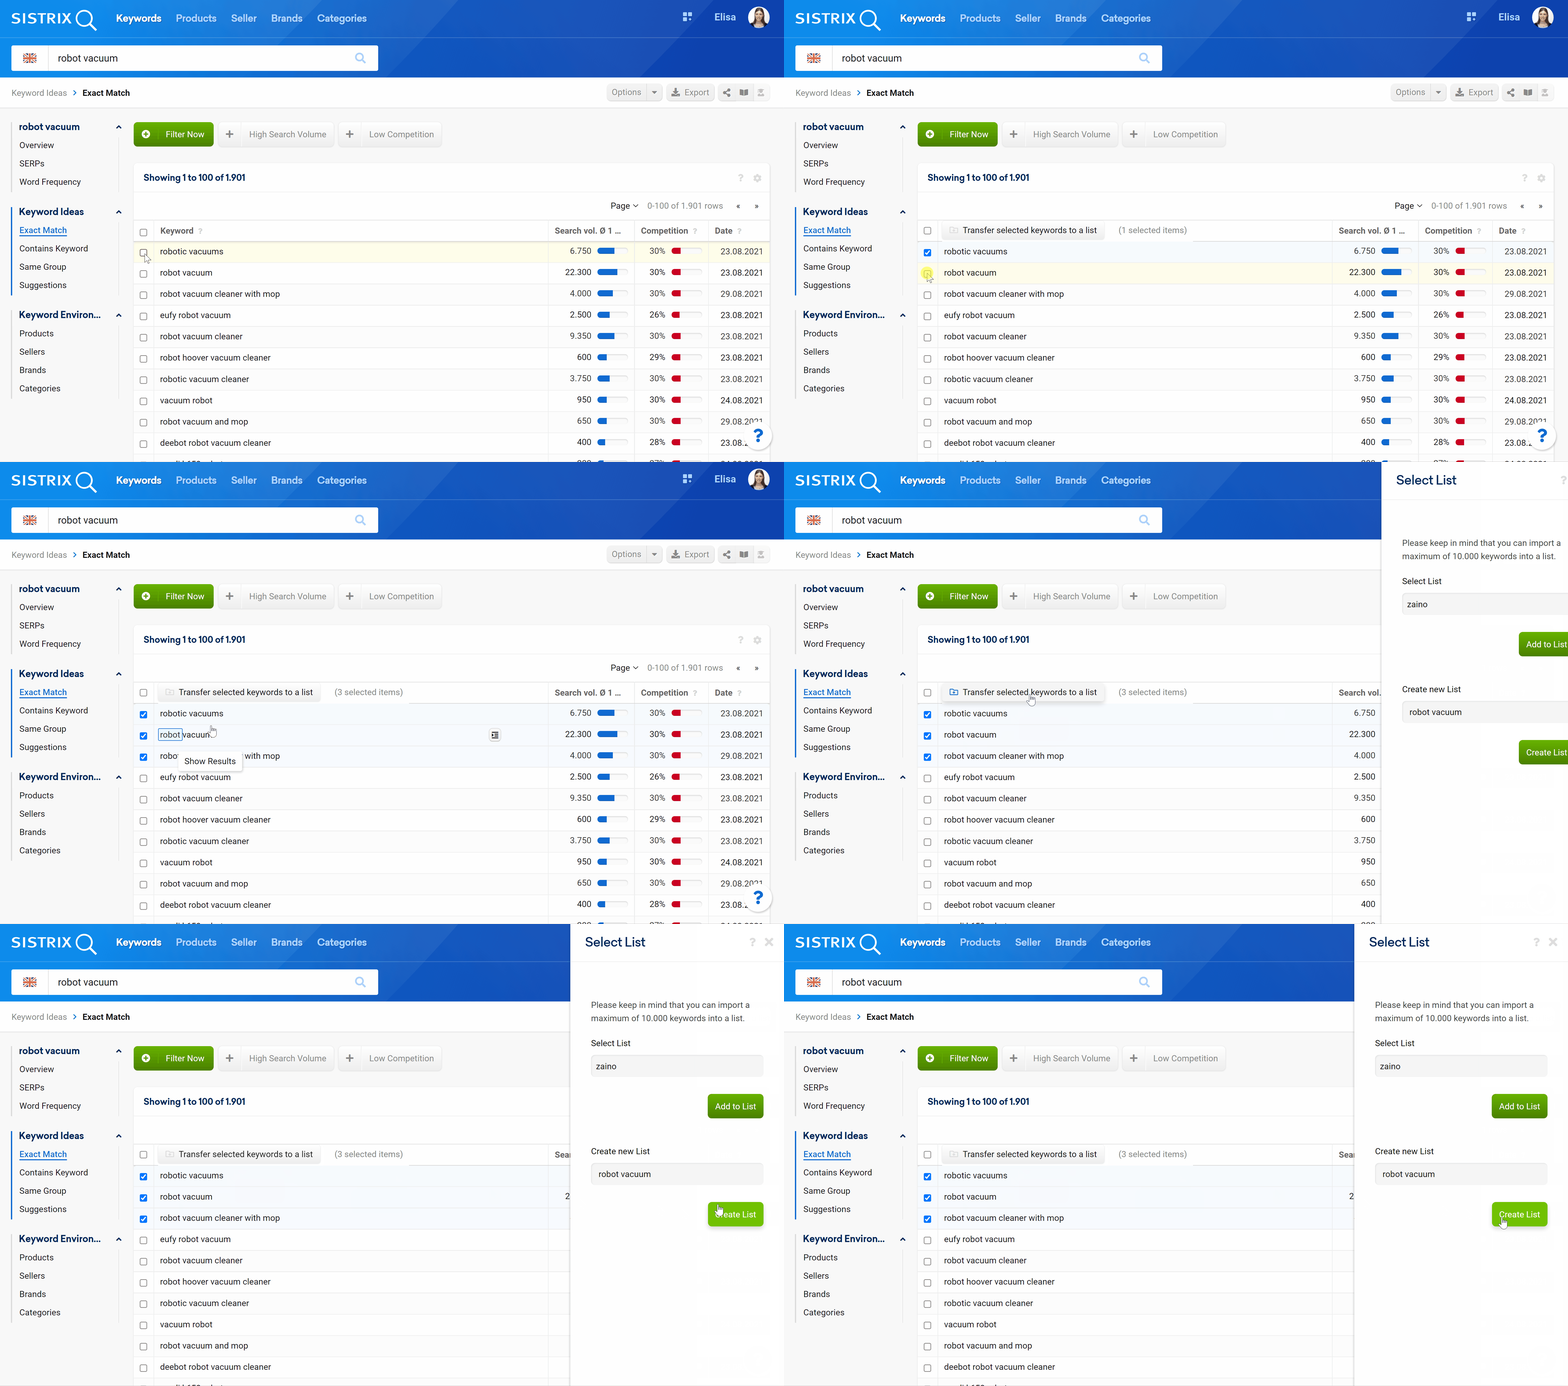
You can add keywords and domains to lists from almost all areas of the Toolbox. All keyword tables in the Toolbox have a small checkbox on the left. Tick one or more keywords (or all of them) to add it to a list with one simple click.
This will open a menu where you can create a new list for the keyword or select a list you’ve already created. The name of a new list will be automatically suggested by the Toolbox, to help you save time.
Method #2

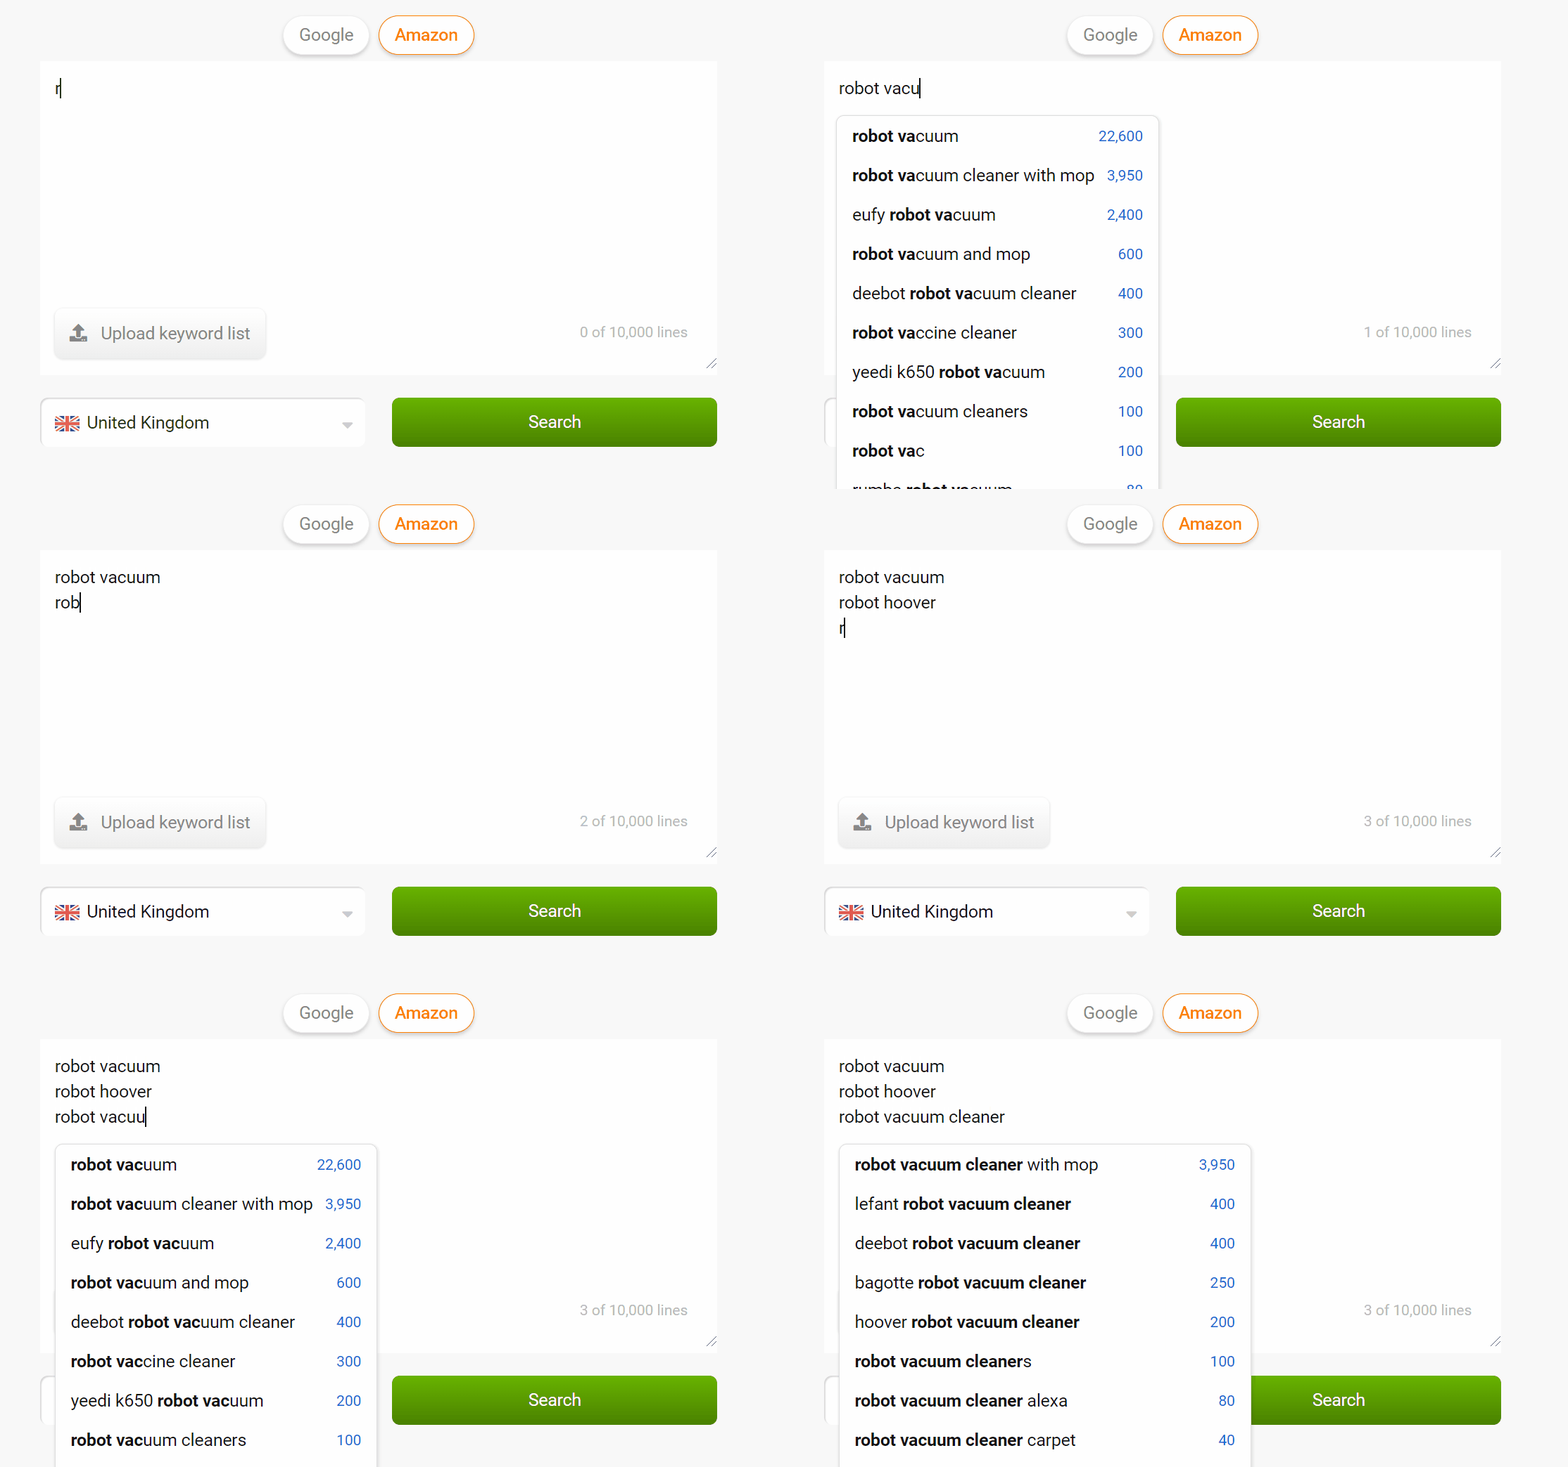
If you are on the keyword start page of the Amazon module you can simply copy and paste up to 10,000 keywords into the keyword field. If you prefer typing your keywords in, the autocomplete feature will help you find the more successful ones by showing you their average number of searches per month.
Keyword Lists
The Amazon list overview page is made up of different elements.
General Options
In the white bar, located between the Toolbox navigation menu and the filters, you’ll find general settings for the whole page, in particular:
- Update SERPs: Click this button to update the SERP data of the list. For larger lists, we show the progress in percent at the top of the bar.
- Settings: rename your list or delete it.
- Export: export the list as a CSV file. Read more about exports and credits here.
- Shortlink: share the page externally. The shortlinks are live for a limited number of days.
List Table
Here you’ll find the keywords that form the list, and the related data for these keywords. Click on a column head to sort via that column, or add a filter for that column using the “Filter Now” features.
For each keyword added, we’ll show you its annual and monthly search volume, the competition level and the referring Country database.
Brands
Here you will find a sorted list of all brands that are ranking for the given keyword list. This evaluation helps you to identify the successful brands for your keyword cluster.
The Market Share column contains two values. The first figure indicates how visible the brand is for this keyword set. (in %) The second, blue bar, shows how strong the brand is compared to the strongest brand in the list.
The keywords columns show how many rankings each brand has for the list in the Top 10 and Top 100 for the keyword list.
Sellers
Here you will find a sorted list of all sellers that are ranking for the given keyword list. This evaluation helps you to identify the successful sellers for your keyword cluster.
The Market Share column contains two values. The first figure indicates how visible the seller is for this keyword set. (in %) The second, blue bar, shows how strong the seller is compared to the strongest seller in the list.
The keywords columns show how many rankings each seller has for the list in the Top 10 and Top 100 for the keyword list.
Product Lists
The product lists works the same way as the keyword lists.
Products
Here you’ll find the products that form the list, and the related data for these products. Click on a column head to sort via that column, or add a filter for that column using the “Filter Now” features.
For each product added, we’ll show you its referring Country database.
Brands
Here you will find a sorted list of all brands that are ranking for the given product list. This evaluation helps you to identify the successful brands for your cluster.
The Market Share column contains two values. The first figure indicates how visible the brand is for this product set. (in %) The second, blue bar, shows how strong the brand is compared to the strongest brand in the list.
The products columns show how many products each brand has for the list.
Sellers
Here you will find a sorted list of all sellers that are ranking for the given product list. This evaluation helps you to identify the successful sellers for your cluster.
The Market Share column contains two values. The first figure indicates how visible the seller is for this product set. (in %) The second, blue bar, shows how strong the seller is compared to the strongest seller in the list.
The products columns show how many products each seller has for the list.